

Measuring Workload Performance with Hardware Performance Counters#
Many software performance analysis tools rely on event counts from hardware
performance monitoring units (PMUs) to characterize workload performance. This
chapter explains how to gather PMU data on NVIDIA Vera systems and combine
event counts into metrics for performance optimization. The examples use the
Linux perf tool, but the same event counts and formulas apply to any tool
that gathers hardware performance events from PMUs, such as
NVIDIA Nsight Systems.
Vera exposes PMUs for the Olympus CPU cores and for uncore fabrics and interfaces. Use core PMU events to understand CPU execution, cache, TLB, branch, and SIMD behavior. Use uncore PMU events to measure traffic through the system-level cache (SLC), local and remote memory paths, PCIe, NVLink-C2C, NV-CLink, NV-DLink, and related request-latency interfaces.
Introduction to Linux perf#
The Linux perf tool is a widely available open-source tool for collecting
application-level and system-level performance data. perf gathers data from
PMUs by using the Linux perf_event kernel interface. Gather data for the
lifetime of a process or for a fixed interval.
Installing perf depends on the distribution:
Ubuntu:
apt install linux-tools-$(uname -r)Red Hat:
dnf install perfSLES:
zypper install perf
perf supports the following measurement types:
Performance summary (
perf stat):perfcollects the total PMU event counts for a workload and reports a high-level summary of its performance characteristics.This is the preferred first pass for workload characterization.
Event-based sampling (
perf record):perfsamples configured PMU events and attributes the samples to instruction addresses and call paths.Use event-based sampling after a summary measurement identifies the region or metric that requires deeper analysis. After collecting data with
perf record, useperf reportorperf annotateto inspect the result.
Configuring Perf#
By default, unprivileged access is limited to a subset of per-process events, such as many predefined core events and software events. To permit access to all PMUs and system-wide measurements, configure the following kernel settings:
Note
Root access is required to configure these settings.
perf_event_paranoidcontrols kernel privilege checks for performance monitoring.Set this value to
-1or0to allow non-root users to perform per-process and system-wide performance monitoring. Refer to Unprivileged users for more information.kptr_restrictcontrols how kernel addresses are exposed.Set this value to
0to improve kernel symbol resolution.
For example:
$ echo -1 | sudo tee /proc/sys/kernel/perf_event_paranoid
$ echo 0 | sudo tee /proc/sys/kernel/kptr_restrict
To make these settings reboot persistent, follow your Linux distribution’s
instructions for configuring system parameters. Typically, create a file in
/etc/sysctl.d/ or edit /etc/sysctl.conf with the following settings:
kernel.perf_event_paranoid=-1
kernel.kptr_restrict=0
Warning
These settings have security implications. Read and understand the relevant Linux kernel documentation and consult your system administrator before changing them on production systems.
To access the Vera PMUs, the kernel must include the PMU drivers that correspond to the PMUs that you want to use:
Core PMU:
CONFIG_ARM_PMU_ACPICONFIG_ARM_PMUV3
Statistical Profiling Extension PMU:
CONFIG_ARM_SPE_PMU
CoreSight System PMUs:
CONFIG_ARM_CORESIGHT_PMU_ARCH_SYSTEM_PMUCONFIG_NVIDIA_CORESIGHT_PMU_ARCH_SYSTEM_PMU
NVIDIA proprietary System PMUs:
CONFIG_NVIDIA_TEGRA410_CMEM_LATENCY_PMUCONFIG_NVIDIA_TEGRA410_C2C_PMU
Gathering Hardware Performance Data with Perf#
To generate a high-level event-count report, run perf stat. For example,
to count core cycles, retired instructions, CPU slots, and stalled slots for a
process:
$ perf stat -e cycles,instructions,armv8_pmuv3_0/cpu_slot/,armv8_pmuv3_0/stall_slot/ sleep 1
To gather data system-wide for an uncore PMU, use -a. For example, to
measure CPU-sourced reads and writes to local CPU memory on socket 0:
$ perf stat -a -e duration_time,nvidia_ucf_pmu_0/cycles/,nvidia_ucf_pmu_0/mem_bytes_rd,src_loc_cpu=1,dst_loc_cmem=1/,nvidia_ucf_pmu_0/mem_bytes_wr,src_loc_cpu=1,dst_loc_cmem=1/ sleep 1
The -e option accepts a comma-separated list of performance events. Events
can be predefined aliases, PMU-qualified event names, or raw PMU events. Use
perf list to see the events available on the running kernel:
$ perf list
$ perf list fp_operation
$ perf list nvidia_ucf_pmu
To see the PMU instances that the kernel registered, inspect the event-source devices:
$ ls /sys/bus/event_source/devices
For a more detailed analysis, gather event-based samples with perf record:
$ perf record -e cycles,instructions,l1d_cache_refill,dtlb_walk ./xhpl.exe
$ perf report
$ perf annotate
Additional information about basic perf usage is available in the
perf man pages.
Vera PMU Model#
Vera exposes PMUs for the Olympus CPU cores and for uncore paths. The PMU instances vary by platform, firmware, kernel, and device configuration. On a dual-socket Vera system, the following PMU families are typical:
The Unified Coherency Fabric (UCF) is a scalable mesh for the CPU clusters providing configurable hierarchical caching and its necessary coherency. UCF is also the published name of the hardware block and PMU family.
PMU family |
Example device name |
Use |
|---|---|---|
Olympus core PMU |
|
Per-process and per-CPU execution, cache, TLB, branch, and SIMD events. |
Arm SPE PMU |
|
Statistical profiling data for sampled instruction execution. |
UCF PMU |
|
SLC events and filtered memory traffic from CPU, non-CPU, and remote sources. |
PCIe source PMU |
|
Traffic initiated by PCIe root ports or bus-device-function sources. |
PCIe target PMU |
|
Traffic targeting PCIe root ports or address ranges. |
CPU-memory latency PMU |
|
Read request count and cumulative outstanding read cycles for CPU memory. |
NVLink-C2C PMU |
|
C2C inbound and outbound read request counts and cumulative outstanding cycles. Write events are available for GPU peer paths (CG), while SoC peer paths (C2) expose read events only. |
NV-CLink PMU |
|
Incoming and outgoing remote-SoC read request counts and cumulative outstanding read cycles. |
NV-DLink PMU |
|
CXL memory read request count and cumulative outstanding read cycles over NV-DLink. |
SMMU PMCG |
|
SMMU transaction, TLB, and page-table-walk events. |
The examples in this chapter use socket or PMU instance 0. Replace the
instance suffix with the PMU instance that corresponds to the socket, root
complex, or device path that you want to measure on the target system.
Vera CPU Performance Metrics#
This section provides formulas for useful performance metrics based on Olympus
core PMU events. In formulas, event names are shown in uppercase for
readability. In perf commands, use the lowercase event aliases shown by
perf list.
When a formula denominator is zero, the metric is not meaningful for that measurement interval. Treat those cases as no data for that specific metric, not as zero.
Metric names in this chapter use ratio for values expressed from 0 to 1
and percentage for formulas multiplied by 100. Primary metrics include a
separate Formula: line. Closely related breakdowns use a compact metric
name followed by the formula on the next line.
The Linux t410 PMU event definitions include more than 400 Olympus core event aliases and more than 100 predefined metrics. The uncore sections later in this chapter provide complete event tables for the smaller traffic-specific PMUs, where the event set and filters are both part of the measurement. The core PMU has a much larger event catalog, so this section highlights the events that are most useful for first-pass performance analysis and then provides formulas for common derived metrics.
Vera also exposes per-prefetcher L2 diagnostics that were not exposed on Grace, including late demand hits, L2 refills, and first hits by prefetch source. Use those events to separate prefetch-engine behavior and access patterns after first-pass locality metrics point to prefetch activity.
Event availability depends on the kernel and perf versions installed on
the system. Use perf list as the authoritative list for the running system.
An event shown in the upstream t410 tables might be unavailable in an
older distribution kernel or perf package.
Cache Levels and PMU Views#
Cache event names identify both a cache level and an observation point. On
Vera, L3D_* and LL_CACHE_* events refer to the UCF system-level cache
(SLC) from a core-side PMU perspective, but they are not global SLC counters.
Use slc_* events from the UCF System PMU when you need the uncore SLC-side
view.
Cache view |
PMU and representative events |
Interpretation |
|---|---|---|
L0 instruction cache |
Core PMU: |
Advanced instruction-delivery view below L1. The events account for different frontend activities and do not form a cache-line hit ratio. |
L1 instruction and data caches |
Core PMU: |
Processing-element (PE)-attributed views of the first-level instruction and data caches. |
L2 cache |
Core PMU: |
Holds instruction and data traffic. The architectural event spelling
retains |
L3 cache |
Core PMU: |
Core PMU events for this PE’s accesses to L3. On Vera, L3 refers to the UCF SLC, but these events are PE-attributed and count PE-initiated accesses, not global SLC activity. Some events distinguish demand, lower-level prefetch, instruction-fetch, and translation-walk sources. |
Architectural last-level cache |
Core PMU: |
Architectural last-level-cache names for the same core-side SLC view,
because the SLC is the last-level cache on Vera. These events have the
same PE-attributed scope as |
System-level cache (SLC) |
UCF System PMU: |
Uncore, system-wide SLC view of the distributed system cache and coherent fabric. Use it for aggregate traffic, SLC hit behavior, and source, destination, local, or remote filtering across SLC slices. |
Event-Name Suffixes#
The public event names combine abbreviations to describe traffic sources and accounting conditions. The following suffixes occur frequently in this chapter.
Suffix |
Meaning in this chapter |
|---|---|
|
Read, write, or combined read-and-write traffic. |
|
Software preload or prefetch instruction traffic. |
|
Hardware-prefetch traffic. |
|
First use or hit of a line fetched by a prefetch. |
|
First use or hit of a line fetched by hardware or software prefetch, respectively. |
|
Traffic generated by an L1 or L2 prefetch source. |
|
A cache or translation structure refill after the relevant lookup misses. |
|
A quantity accumulated for each cycle that a condition is present, commonly used to derive an average latency or occupancy. |
|
Speculatively executed activity, including work that might not retire. |
|
Architecturally completed activity. |
|
Instruction-fetch traffic. |
|
Translation-table-walk traffic. |
|
Memory-management traffic as defined by the public event table. |
When CPU_SLOT is available, use it as the denominator for slot-based
metrics because it directly accounts for the active PE slot count. If you need
to derive a slot denominator for an SMT-disabled Olympus run, use
CPU_CYCLES * SLOTS. The ST/SMT note below explains the Olympus 10-slot ST
and 5-slot SMT behavior.
The CPU_CYCLES event does not count while the PE is in a
Wait For Event or Wait For Interrupt state. This behavior is important when
interpreting short measurements, idle workloads, or measurements that include
sleeping threads.
CNT_CYCLES increments at the System Counter frequency and also stops while
the PE is in Wait For Event or Wait For Interrupt state. Use
DURATION_TIME for wall-clock time.
Core PMU events are easiest to interpret when the event is attributable to the measured PE. Some events also reflect shared-core activity or activity that cannot be attributed cleanly to one hardware thread. In SMT-enabled measurements, treat per-thread or per-process counts for shared resources as directional. Compare them with per-CPU or system-wide measurements when the result drives an optimization decision.
Important Core PMU Events#
The following sections group useful core PMU events by measurement goal. Keep the first pass small, and add deeper events only after the initial results point to a specific bottleneck.
Core rate and utilization
Use these events to diagnose IPC, active frequency, entitled slot count, retired work, and stalled slots.
CPU_CYCLESCNT_CYCLESCPU_SLOTINST_RETIREDOP_RETIREDOP_SPECSTALL_SLOT
Frontend and backend pressure
Use these events to determine whether lost slots are caused by instruction fetch, branch flow, memory latency, stores, issue pressure, or rename resources.
STALL_SLOT_FRONTEND_WITHOUT_MISPREDSTALL_SLOT_BACKENDSTALL_FRONTENDSTALL_FRONTEND_MEMBOUNDSTALL_FRONTEND_CPUBOUNDSTALL_FRONTEND_L1ISTALL_FRONTEND_MEMSTALL_FRONTEND_TLBSTALL_FRONTEND_FLOWSTALL_FRONTEND_FLUSHSTALL_BACKENDSTALL_BACKEND_MEMBOUNDSTALL_BACKEND_CPUBOUNDSTALL_BACKEND_L1DSTALL_BACKEND_MEMSTALL_BACKEND_TLBSTALL_BACKEND_STSTALL_BACKEND_BUSYSTALL_BACKEND_RENAME
Operation mix
Use these events to identify the share of load, store, integer, floating-point, SIMD/SVE, crypto, barrier, prefetch, and branch operations.
INST_SPECLD_SPECST_SPECDP_SPECVFP_SPECASE_SPECASE_INST_SPECSVE_INST_SPECSIMD_INST_SPECCRYPTO_SPECISB_SPECDSB_SPECDMB_SPECCSDB_SPECPRF_SPECBR_IMMED_SPECBR_INDIRECT_SPEC
Floating-point and vector throughput
Use these events to diagnose GFLOP/s, vector utilization, and precision mix. These events count element operations, not only instructions.
FP_SCALE_OPS_SPECFP_FIXED_OPS_SPECFP_FP8_SCALE_MIN_OPS_SPECFP_FP8_FIXED_MIN_OPS_SPECFP_BF16_SCALE_MIN_OPS_SPECFP_BF16_FIXED_MIN_OPS_SPECFP_HP_SCALE_MIN_OPS_SPECFP_HP_FIXED_MIN_OPS_SPECFP_SP_SCALE_MIN_OPS_SPECFP_SP_FIXED_MIN_OPS_SPECFP_DP_SCALE_OPS_SPECFP_DP_FIXED_OPS_SPEC
SVE predication
Use these events to determine whether SVE instructions are using full vectors, partial vectors, or empty predicates.
SVE_PRED_SPECSVE_PRED_FULL_SPECSVE_PRED_PARTIAL_SPECSVE_PRED_EMPTY_SPECSVE_LDFF_SPECSVE_LDFF_FAULT_SPEC
Data cache and memory locality
Use these events to diagnose data working-set locality, local versus remote refill sources, and average load latency from outstanding-load cycles.
MEM_ACCESSMEM_ACCESS_RDMEM_ACCESS_WRMEM_ACCESS_RD_PERCYCL1D_CACHE_RWL1D_CACHE_RDL1D_CACHE_WRL1D_CACHE_REFILL_RWL1D_CACHE_REFILL_RDL1D_CACHE_REFILL_WRL1D_CACHE_REFILL_OUTER_LLCL1D_CACHE_REFILL_OUTER_DRAML1D_CACHE_REFILL_OUTER_REMOTEL2D_CACHE_REFILL_RDL2D_CACHE_REFILL_WRLL_CACHE_RDLL_CACHE_MISS_RD
Instruction fetch locality
Use these events to diagnose instruction-cache misses, frontend memory pressure, instruction-fetch latency, prefetch effectiveness, and dropped instruction prefetches.
INST_FETCHINST_FETCH_PERCYCL1I_CACHE_RDL1I_CACHE_REFILL_RDL1I_CACHE_REFILL_HWPRFL1I_CACHE_REFILL_PRFML1I_CACHE_HIT_RD_FPRFL1I_HWPRF_REQL1I_HWPRF_REQ_DROPL1I_PRFM_REQL1I_PRFM_REQ_DROPL0I_CACHE_RDL0I_CACHE_REFILLL2D_CACHE_IF_REFILLL3D_CACHE_REFILL_IF
Cache writeback and coherence
Use these events to diagnose capacity-driven L1/L2 evictions, maintenance or snoop writebacks, coherence invalidations, virtual-alias back-snoops, and full-line L3 write allocations.
L1D_CACHE_WBL1D_CACHE_WB_VICTIML1D_CACHE_WB_CLEANL2D_CACHE_WBL2D_CACHE_WB_VICTIML2D_CACHE_WB_CLEANL2D_CACHE_INVALL2D_CACHE_BACKSNOOP_L1D_VIRT_ALIASINGL3D_CACHE_ALLOCATE
Prefetch effectiveness
Use these events to determine whether hardware or software prefetches bring useful lines into the cache hierarchy and whether they arrive too late or are dropped. Also use these events to identify the active hardware-prefetch mode and throttling or queue-pressure limits.
L1D_CACHE_REFILL_HWPRFL1D_CACHE_REFILL_PRFML1D_CACHE_HIT_RW_FHWPRFL1D_CACHE_HIT_RW_FPRFML1D_CACHE_HIT_RW_FPRFL1D_LFB_HIT_RW_FHWPRFL1D_LFB_HIT_RW_FPRFML2D_CACHE_HWPRFL2D_CACHE_REFILL_HWPRFL2D_CACHE_PRFML2D_CACHE_REFILL_PRFML2D_CACHE_REFILL_PRFL2D_CACHE_L1PRFL2D_CACHE_REFILL_L1PRFL2D_CACHE_IF_REFILLL2D_CACHE_TBW_REFILLL2D_CACHE_PF_REFILLL2D_CACHE_HIT_RWL1PRF_FHWPRFL2D_CACHE_HIT_RWL1PRF_FPRFML2D_CACHE_HIT_RWL1PRF_FPRFL2D_LFB_HIT_RWL1PRF_FHWPRFL3D_CACHE_HWPRFL3D_CACHE_REFILL_HWPRFL3D_CACHE_PRFML3D_CACHE_REFILL_PRFML3D_CACHE_REFILL_PRFL3D_CACHE_L1PRFL3D_CACHE_REFILL_L1PRFL3D_CACHE_L2PRFL3D_CACHE_REFILL_L2PRFL3D_CACHE_HIT_RWL1PRFL2PRF_FPRFUNUSED_PFPFT_SENTPFT_USEFULPFT_DROPPF_MODE_0_CYCLESthroughPF_MODE_3_CYCLESLS_PF_GEN_TABLE_ALLOC_PF_PENDPF_PRQ_ALLOC_PF_PENDL2_TQ_OUTSTANDINGTXREQ_LIMIT_COUNT_CYCLES
Data-path diagnostics
Use these events to diagnose remote-access pressure, alignment penalties, streaming no-write-allocate stores, and L2 CHI response CBusy levels.
REMOTE_ACCESSLD_ALIGN_LATST_ALIGN_LATLDST_ALIGN_LATSTORE_STREAML2_CHI_CBUSY0throughL2_CHI_CBUSY3
TLB and page-size behavior
Use these events to diagnose translation miss rates, page-walk latency, and whether walks resolve to large or small pages.
L1D_TLBL1D_TLB_REFILLL1I_TLBL1I_TLB_REFILLL2D_TLBL2D_TLB_REFILLDTLB_WALKITLB_WALKDTLB_WALK_PERCYCITLB_WALK_PERCYCDTLB_WALK_LARGEDTLB_WALK_SMALLITLB_WALK_LARGEITLB_WALK_SMALL
Branch prediction
Use these events to diagnose overall branch MPKI and whether direct, indirect, return, direction, or polymorphic branches dominate mispredictions.
BR_RETIREDBR_MIS_PRED_RETIREDBR_IMMED_RETIREDBR_IND_RETIREDBR_RETURN_RETIREDBR_IMMED_MIS_PRED_RETIREDBR_IND_MIS_PRED_RETIREDBR_RETURN_MIS_PRED_RETIREDBR_MIS_PRED_DIR_RESOLVEDBR_PRED_MULTI_RESOLVEDBR_MIS_PRED_MULTI_RESOLVED
Core-to-uncore traffic from a PE
Use these events to diagnose per-core external data-beat traffic and retry pressure. Use uncore PMUs for socket-level bandwidth and filtered paths.
BUS_ACCESSBUS_ACCESS_RDBUS_ACCESS_WRBUS_CYCLESBUS_REQUEST_REQBUS_REQUEST_RETRY
Core PMU Command Templates#
Use the command templates in this section to gather the event counts required
by the formulas below. If perf reports that an event set cannot be
scheduled together, split the command into smaller event sets or run longer
intervals to reduce multiplexing noise. When perf scales multiplexed
events, inspect the percentage of time each event was running before relying on
small differences between derived metrics.
To collect a first-pass slot-accounting snapshot:
$ perf stat -e duration_time,cycles,instructions,armv8_pmuv3_0/cpu_slot/,armv8_pmuv3_0/stall_slot/ <workload>
To collect the events used by the level-1 slot metrics:
$ perf stat -e duration_time,armv8_pmuv3_0/cpu_slot/,armv8_pmuv3_0/stall_slot/,armv8_pmuv3_0/stall_slot_frontend_without_mispred/,armv8_pmuv3_0/stall_slot_backend/,armv8_pmuv3_0/op_retired/,armv8_pmuv3_0/op_spec/ <workload>
To break down frontend stall cycles:
$ perf stat -e armv8_pmuv3_0/stall_frontend/,armv8_pmuv3_0/stall_frontend_membound/,armv8_pmuv3_0/stall_frontend_cpubound/,armv8_pmuv3_0/stall_frontend_l1i/,armv8_pmuv3_0/stall_frontend_mem/,armv8_pmuv3_0/stall_frontend_tlb/,armv8_pmuv3_0/stall_frontend_flow/,armv8_pmuv3_0/stall_frontend_flush/ <workload>
To break down backend stall cycles:
$ perf stat -e armv8_pmuv3_0/stall_backend/,armv8_pmuv3_0/stall_backend_membound/,armv8_pmuv3_0/stall_backend_cpubound/,armv8_pmuv3_0/stall_backend_l1d/,armv8_pmuv3_0/stall_backend_mem/,armv8_pmuv3_0/stall_backend_tlb/,armv8_pmuv3_0/stall_backend_st/,armv8_pmuv3_0/stall_backend_busy/,armv8_pmuv3_0/stall_backend_rename/ <workload>
To collect floating-point throughput and SVE predication events:
$ perf stat -e duration_time,cycles,armv8_pmuv3_0/fp_scale_ops_spec/,armv8_pmuv3_0/fp_fixed_ops_spec/,armv8_pmuv3_0/sve_pred_spec/,armv8_pmuv3_0/sve_pred_full_spec/,armv8_pmuv3_0/sve_pred_partial_spec/ <workload>
To collect cache and TLB locality events:
$ perf stat -e cycles,instructions,armv8_pmuv3_0/l1d_cache_refill/,armv8_pmuv3_0/l1i_cache_refill/,armv8_pmuv3_0/l2d_cache_refill/,armv8_pmuv3_0/dtlb_walk/,armv8_pmuv3_0/itlb_walk/ <workload>
To collect L1 instruction-prefetch effectiveness and request-drop events:
$ perf stat -e instructions,armv8_pmuv3_0/l1i_cache_refill_rd/,armv8_pmuv3_0/l1i_cache_refill_hwprf/,armv8_pmuv3_0/l1i_cache_refill_prfm/,armv8_pmuv3_0/l1i_cache_hit_rd_fprf/,armv8_pmuv3_0/l1i_hwprf_req/,armv8_pmuv3_0/l1i_hwprf_req_drop/,armv8_pmuv3_0/l1i_prfm_req/,armv8_pmuv3_0/l1i_prfm_req_drop/ <workload>
To collect the L2 hardware- and software-prefetch access, refill, and first-hit events:
$ perf stat -e armv8_pmuv3_0/l2d_cache_hwprf/,armv8_pmuv3_0/l2d_cache_refill_hwprf/,armv8_pmuv3_0/l2d_cache_prfm/,armv8_pmuv3_0/l2d_cache_refill_prfm/,armv8_pmuv3_0/l2d_cache_hit_rwl1prf_fprf/,armv8_pmuv3_0/l2d_lfb_hit_rwl1prf_fhwprf/ <workload>
To determine whether prefetch traffic from L1 or L2 is reaching and missing L3:
$ perf stat -e armv8_pmuv3_0/l3d_cache_l1prf/,armv8_pmuv3_0/l3d_cache_refill_l1prf/,armv8_pmuv3_0/l3d_cache_l2prf/,armv8_pmuv3_0/l3d_cache_refill_l2prf/,armv8_pmuv3_0/l3d_cache_hit_rwl1prfl2prf_fprf/ <workload>
To measure hardware- and software-prefetch behavior observed at L3:
$ perf stat -e armv8_pmuv3_0/l3d_cache_hwprf/,armv8_pmuv3_0/l3d_cache_refill_hwprf/,armv8_pmuv3_0/l3d_cache_prfm/,armv8_pmuv3_0/l3d_cache_refill_prfm/ <workload>
To inspect L2 prefetch waste, downstream disposition, and prefetch mode:
$ perf stat -e instructions,cycles,armv8_pmuv3_0/unused_pf/,armv8_pmuv3_0/pft_sent/,armv8_pmuv3_0/pft_useful/,armv8_pmuv3_0/pft_drop/,armv8_pmuv3_0/pf_mode_0_cycles/,armv8_pmuv3_0/pf_mode_1_cycles/,armv8_pmuv3_0/pf_mode_2_cycles/,armv8_pmuv3_0/pf_mode_3_cycles/ <workload>
These event sets can exceed the available programmable counters when they are
combined with other groups. Split them into repeated workload runs when
possible. Otherwise, inspect the perf stat running-time percentages for
multiplexing.
To collect branch-prediction events:
$ perf stat -e instructions,armv8_pmuv3_0/br_retired/,armv8_pmuv3_0/br_mis_pred_retired/,armv8_pmuv3_0/br_ind_retired/,armv8_pmuv3_0/br_ind_mis_pred_retired/,armv8_pmuv3_0/br_return_retired/,armv8_pmuv3_0/br_return_mis_pred_retired/ <workload>
Cycle and Instruction Accounting#
Use the level-1 top-down metrics in this section as a triage view. They point to the next area to inspect. They are not, by themselves, proof of a root cause. Short intervals, multiplexed event groups, privilege filters, and SMT activity can make derived percentages noisy.
Instructions per cycle (IPC): Retired instructions per active CPU cycle.
Formula:
INST_RETIRED / CPU_CYCLESExample events:
inst_retiredandcpu_cycles.Effective active-cycle rate: Active CPU cycles per wall-clock nanosecond. Because
DURATION_TIMEis reported in nanoseconds, this formula reports GHz. If the interval includes sleep or wait states, the result includes those inactive periods and is not the instantaneous operating frequency.Formula:
CPU_CYCLES / DURATION_TIMEStalled slots percentage: Percentage of active CPU slots that did not send an operation for execution.
SMT-enabled formula:
100 * STALL_SLOT / CPU_SLOTSMT-disabled formula:
100 * STALL_SLOT / (CPU_CYCLES * SLOTS)PE utilization percentage: Percentage of active CPU slots that were not stalled.
SMT-enabled formula:
100 * (1 - STALL_SLOT / CPU_SLOT)SMT-disabled formula:
100 * (1 - STALL_SLOT / (CPU_CYCLES * SLOTS))Retired operation slots percentage: Percentage of active CPU slots that retired operations.
Formula:
100 * OP_RETIRED / CPU_SLOTSpeculative operation slots percentage: Percentage of active CPU slots that speculatively executed operations.
Formula:
100 * OP_SPEC / CPU_SLOTRetiring percentage: Percentage of active CPU slots that retired useful work.
Formula:
100 * ((OP_RETIRED / OP_SPEC) * (1 - (STALL_SLOT / CPU_SLOT)))Frontend-bound percentage: Percentage of active CPU slots lost to frontend pressure, excluding the short frontend recovery window after branch mispredictions.
Formula:
100 * STALL_SLOT_FRONTEND_WITHOUT_MISPRED / CPU_SLOTBackend-bound percentage: Percentage of active CPU slots lost to backend pressure.
Formula:
100 * STALL_SLOT_BACKEND / CPU_SLOTBad speculation percentage: Percentage of active CPU slots that executed operations but did not retire them because of a pipeline flush. In this formula,
RETIRE_SLOTS,FE_SLOTS, andBE_SLOTSare derived slot percentage contributions from the preceding retiring, frontend-bound, and backend-bound formulas, not raw PMU events.RETIRE_SLOTSis the retiring percentage,FE_SLOTSis the frontend-bound percentage, andBE_SLOTSis the backend-bound percentage.Formula:
100 - (RETIRE_SLOTS + FE_SLOTS + BE_SLOTS)Frontend stalled cycles percentage:
100 * STALL_FRONTEND / CPU_CYCLESBackend stalled cycles percentage:
100 * STALL_BACKEND / CPU_CYCLES
Use the level-2 stall events after a high-level slot metric is large:
Frontend core pressure percentage:
100 * STALL_FRONTEND_CPUBOUND / STALL_FRONTENDFrontend memory pressure percentage:
100 * STALL_FRONTEND_MEMBOUND / STALL_FRONTENDFrontend cache pressure percentage:
100 * (STALL_FRONTEND_L1I + STALL_FRONTEND_MEM) / STALL_FRONTEND_MEMBOUNDFrontend L1 instruction-cache share of cache pressure:
100 * STALL_FRONTEND_L1I / (STALL_FRONTEND_L1I + STALL_FRONTEND_MEM)Frontend downstream-memory share of cache pressure:
100 * STALL_FRONTEND_MEM / (STALL_FRONTEND_L1I + STALL_FRONTEND_MEM)Frontend TLB pressure percentage:
100 * STALL_FRONTEND_TLB / STALL_FRONTEND_MEMBOUNDFrontend branch-flow pressure percentage:
100 * STALL_FRONTEND_FLOW / STALL_FRONTEND_CPUBOUNDFrontend flush pressure percentage:
100 * STALL_FRONTEND_FLUSH / STALL_FRONTEND_CPUBOUNDBackend memory pressure percentage:
100 * STALL_BACKEND_MEMBOUND / STALL_BACKENDBackend core pressure percentage:
100 * STALL_BACKEND_CPUBOUND / STALL_BACKENDBackend cache pressure percentage:
100 * (STALL_BACKEND_L1D + STALL_BACKEND_MEM) / STALL_BACKEND_MEMBOUNDBackend L1 data-cache share of cache pressure:
100 * STALL_BACKEND_L1D / (STALL_BACKEND_L1D + STALL_BACKEND_MEM)Backend downstream-memory share of cache pressure:
100 * STALL_BACKEND_MEM / (STALL_BACKEND_L1D + STALL_BACKEND_MEM)Backend TLB pressure percentage:
100 * STALL_BACKEND_TLB / STALL_BACKEND_MEMBOUNDBackend store pressure percentage:
100 * STALL_BACKEND_ST / STALL_BACKEND_MEMBOUNDBackend issue pressure percentage:
100 * STALL_BACKEND_BUSY / STALL_BACKENDBackend rename pressure percentage:
100 * STALL_BACKEND_RENAME / STALL_BACKEND_CPUBOUNDFraction of cycles in ST mode: Share of active cycles where the core operated in single-thread mode.
Formula:
((CPU_SLOT / CPU_CYCLES) - 5) / 5Cycles in ST mode:
cpu_cycles_fraction_in_st_mode * CPU_CYCLESCycles in SMT mode:
(1 - cpu_cycles_fraction_in_st_mode) * CPU_CYCLES
Note
The ST and SMT formulas use the slot behavior exposed for Olympus in the
CPU_SLOT event. Olympus reports twice as many entitled slots per cycle
in ST mode as in SMT partitioned-resource mode, so the formula above assumes
10 slots per ST cycle and 5 slots per SMT cycle. Interpret these formulas
only for measurements taken on Vera Olympus cores.
Floating-Point Throughput#
Use operation-count events for floating-point throughput. Because
DURATION_TIME is reported in nanoseconds, operations / DURATION_TIME
reports billions of operations per second. Report the numerical result for
the floating-point events in this section in GFLOP/s. These events count
arithmetic element operations. For example, fused multiply-add operations
count as two operations per active element, and SVE operations scale with
active vector lanes. The *_SPEC events count speculatively executed
operations, including operations that might later be discarded. Treat the
resulting rates as executed-work throughput rather than strictly retired
application performance.
SVE throughput (GFLOP/s): Floating-point element operations performed by scalable vector instructions.
Formula:
FP_SCALE_OPS_SPEC / DURATION_TIMEExample event:
fp_scale_ops_spec.SVE floating-point operations per cycle:
FP_SCALE_OPS_SPEC / CPU_CYCLESNon-SVE throughput (GFLOP/s): Floating-point element operations performed by scalar or Advanced SIMD instructions.
Formula:
FP_FIXED_OPS_SPEC / DURATION_TIMEExample event:
fp_fixed_ops_spec.Non-SVE floating-point operations per cycle:
FP_FIXED_OPS_SPEC / CPU_CYCLESTotal floating-point throughput (GFLOP/s): Floating-point element operations performed by scalable and non-scalable instructions.
Formula:
(FP_SCALE_OPS_SPEC + FP_FIXED_OPS_SPEC) / DURATION_TIMETotal floating-point operations per cycle:
(FP_SCALE_OPS_SPEC + FP_FIXED_OPS_SPEC) / CPU_CYCLESFP8 operation rate (GFLOP/s): Floating-point element operations whose smallest data type is FP8.
Formula:
(FP_FP8_SCALE_MIN_OPS_SPEC + FP_FP8_FIXED_MIN_OPS_SPEC) / DURATION_TIMEExample events:
fp_fp8_scale_min_ops_specandfp_fp8_fixed_min_ops_spec.BF16 operation rate (GFLOP/s): Floating-point element operations whose smallest data type is BF16.
Formula:
(FP_BF16_SCALE_MIN_OPS_SPEC + FP_BF16_FIXED_MIN_OPS_SPEC) / DURATION_TIMEFP16 operation rate (GFLOP/s): Floating-point element operations whose smallest data type is FP16.
Formula:
(FP_HP_SCALE_MIN_OPS_SPEC + FP_HP_FIXED_MIN_OPS_SPEC) / DURATION_TIMEFP32 operation rate (GFLOP/s): Floating-point element operations whose smallest data type is FP32.
Formula:
(FP_SP_SCALE_MIN_OPS_SPEC + FP_SP_FIXED_MIN_OPS_SPEC) / DURATION_TIMEFP64 operation rate (GFLOP/s): Double-precision floating-point element operations.
Formula:
(FP_DP_SCALE_OPS_SPEC + FP_DP_FIXED_OPS_SPEC) / DURATION_TIME
Operation Mix#
Operation-mix metrics use speculatively executed operation events. These metrics are useful for understanding the type of work issued by the CPU, but they are not substitutes for floating-point-throughput metrics because instruction counts and element operation counts have different units. Do not require operation-mix percentages to sum to exactly 100%. The events are diagnostic views into different instruction classes.
Load operations percentage:
Formula:
100 * LD_SPEC / INST_SPECStore operations percentage:
Formula:
100 * ST_SPEC / INST_SPECBranch operations percentage:
Formula:
100 * (BR_IMMED_SPEC + BR_INDIRECT_SPEC) / INST_SPECInteger operations percentage:
Formula:
100 * DP_SPEC / INST_SPECScalar floating-point operation percentage:
Formula:
100 * VFP_SPEC / INST_SPECBarrier operation percentage:
Formula:
100 * (ISB_SPEC + DSB_SPEC + DMB_SPEC) / INST_SPECCSDB operation percentage:
Formula:
100 * CSDB_SPEC / INST_SPECCrypto operations percentage:
Formula:
100 * CRYPTO_SPEC / INST_SPECPrefetch operations percentage:
Formula:
100 * PRF_SPEC / INST_SPECRelease/acquire operations percentage:
Formula:
100 * (RC_LD_SPEC + RC_ST_SPEC) / INST_SPECUnaligned load/store operations percentage:
Formula:
100 * UNALIGNED_LDST_SPEC / INST_SPECSVE operations percentage:
Formula:
100 * SVE_INST_SPEC / INST_SPECAdvanced SIMD operation percentage:
Formula:
100 * ASE_SPEC / INST_SPECSIMD or SVE vector instruction percentage:
Formula:
100 * SIMD_INST_SPEC / INST_SPECValue-predicted load mismatch percentage:
Formula:
100 * VPRED_LD_SPEC_MISMATCH / VPRED_LD_SPEC
SVE Predication#
SVE predication metrics can be expressed as a share of all speculatively
executed operations or as a share of SVE predicated operations. Use the
denominator that matches the analysis question. The public t410 event
definitions also count some governing-predicate SVE operations that do not
write an SVE Z-vector destination. Treat these metrics as predicate-utilization
indicators, and inspect generated instructions when the result is surprising.
Full SVE predication percentage of all operations:
Formula:
100 * SVE_PRED_FULL_SPEC / INST_SPECPartial SVE predication percentage of all operations:
Formula:
100 * SVE_PRED_PARTIAL_SPEC / INST_SPECEmpty SVE predication percentage of all operations:
Formula:
100 * SVE_PRED_EMPTY_SPEC / INST_SPECFull SVE predication percentage within predicated SVE operations:
Formula:
100 * SVE_PRED_FULL_SPEC / SVE_PRED_SPECPartial SVE predication percentage within predicated SVE operations:
Formula:
100 * SVE_PRED_PARTIAL_SPEC / SVE_PRED_SPECEmpty SVE predication percentage within predicated SVE operations:
Formula:
100 * SVE_PRED_EMPTY_SPEC / SVE_PRED_SPEC
Cache Effectiveness#
Core cache and refill events are PE-attributed locality views. Some events include prefetch or translation-table-walk traffic, depending on the event definition. Use these metrics to identify locality symptoms, then use UCF, PCIe, NVLink-C2C, NV-CLink, or NV-DLink PMUs for aggregate bandwidth or path attribution.
Note
When comparing with Grace, do not treat the aggregate Vera
L1D_CACHE_REFILL, L2D_CACHE_REFILL, or L3D_CACHE_REFILL events
as demand-only miss signals. Vera defines the overall refill events to
include prefetch refills. For example, L2D_CACHE_REFILL is the sum of
L2D_CACHE_REFILL_RD, L2D_CACHE_REFILL_WR,
L2D_CACHE_REFILL_HWPRF, and L2D_CACHE_REFILL_PRFM. Use
demand-refill and demand-MPKI metrics when you want a closer Grace-style
comparison, and break out hardware and software prefetch refills before
attributing behavior changes.
L1 data cache miss ratio: Ratio of level 1 data cache accesses that miss.
Formula:
L1D_CACHE_REFILL / L1D_CACHEL1 data cache MPKI: Level 1 data cache refills per thousand retired instructions.
Formula:
1000 * L1D_CACHE_REFILL / INST_RETIREDL1 data demand miss ratio: Ratio of demand load/store accesses that miss the L1 data cache.
Formula:
L1D_CACHE_REFILL_RW / L1D_CACHE_RWIf you use
L1D_CACHE_MISSdirectly, account for prefetch activity. When hardware prefetchers or software preload instructions are active,L1D_CACHE_MISScan include prefetch-related L1 data-cache misses. For a demand-only L1 data-cache miss count, useL1D_CACHE_MISS - (L1D_CACHE_REFILL_PRFM + L1D_CACHE_REFILL_HWPRF).L1 data read miss ratio:
L1D_CACHE_REFILL_RD / L1D_CACHE_RDL1 data write miss ratio:
L1D_CACHE_REFILL_WR / L1D_CACHE_WRL1 data capacity writeback percentage:
100 * L1D_CACHE_WB_VICTIM / L1D_CACHE_WBL1 data coherence or maintenance writeback percentage:
100 * L1D_CACHE_WB_CLEAN / L1D_CACHE_WBL1 data refill from inner cache percentage:
100 * L1D_CACHE_REFILL_INNER / L1D_CACHE_REFILLL1 data refill from SLC percentage:
100 * L1D_CACHE_REFILL_OUTER_LLC / L1D_CACHE_REFILLL1 data refill from local memory percentage:
100 * L1D_CACHE_REFILL_OUTER_DRAM / L1D_CACHE_REFILLL1 data refill from remote memory percentage:
100 * L1D_CACHE_REFILL_OUTER_REMOTE / L1D_CACHE_REFILLL1 instruction cache miss ratio: Ratio of level 1 instruction cache accesses that miss.
Formula:
L1I_CACHE_REFILL / L1I_CACHEL1 instruction cache MPKI: Level 1 instruction cache refills per thousand retired instructions.
Formula:
1000 * L1I_CACHE_REFILL / INST_RETIREDL1 instruction demand miss ratio:
L1I_CACHE_REFILL_RD / L1I_CACHE_RDL0 instruction-cache refill MPKI:
1000 * L0I_CACHE_REFILL / INST_RETIREDUse
L0I_CACHE_RDandL0I_CACHE_REFILLas advanced frontend diagnostics after L1 instruction-cache and frontend-stall metrics identify an instruction-delivery bottleneck. Do not combine them into a cache-line hit ratio because the events account for different frontend activities.L2 cache miss ratio: Ratio of level 2 cache accesses that refill.
Formula:
L2D_CACHE_REFILL / L2D_CACHEL2 demand miss MPKI: Level 2 demand misses per thousand retired instructions, using the upstream
t410definition.Formula:
1000 * (L2D_CACHE_REFILL_RD + L2D_CACHE_REFILL_WR + L2D_CACHE_REFILL_L1PRF) / INST_RETIREDL2 demand miss ratio: Ratio of upstream
t410demand misses to demand accesses.Formula:
(L2D_CACHE_REFILL_RD + L2D_CACHE_REFILL_WR + L2D_CACHE_REFILL_L1PRF) / (L2D_CACHE_RD + L2D_CACHE_WR + L2D_CACHE_L1PRF)L2 instruction-fetch refill MPKI:
1000 * L2D_CACHE_IF_REFILL / INST_RETIREDL2 translation-table-walk refill MPKI:
1000 * L2D_CACHE_TBW_REFILL / INST_RETIREDL2 prefetch refill MPKI:
1000 * L2D_CACHE_PF_REFILL / INST_RETIREDL2 capacity writeback percentage:
100 * L2D_CACHE_WB_VICTIM / L2D_CACHE_WBL2 maintenance and snoop writeback percentage:
100 * L2D_CACHE_WB_CLEAN / L2D_CACHE_WBL2 invalidation MPKI:
1000 * L2D_CACHE_INVAL / INST_RETIREDL1 virtual-alias back-snoop MPKI:
1000 * L2D_CACHE_BACKSNOOP_L1D_VIRT_ALIASING / INST_RETIREDLast-level cache read hit ratio: Ratio of last-level cache reads that hit.
Formula:
(LL_CACHE_RD - LL_CACHE_MISS_RD) / LL_CACHE_RDLast-level cache read miss ratio: Ratio of last-level cache reads that miss.
Formula:
LL_CACHE_MISS_RD / LL_CACHE_RDLast-level cache read MPKI: Last-level cache read misses per thousand retired instructions.
Formula:
1000 * LL_CACHE_MISS_RD / INST_RETIREDL3 demand miss ratio: Ratio of demand read, demand write, L1 prefetch, and L2 prefetch accesses that miss L3.
Formula:
L3D_CACHE_REFILL_RWL1PRFL2PRF / L3D_CACHE_RWL1PRFL2PRFL3 instruction-fetch refill MPKI:
1000 * L3D_CACHE_REFILL_IF / INST_RETIREDL3 translation-table-walk refill MPKI:
1000 * L3D_CACHE_REFILL_MM / INST_RETIREDL3 full-line allocation MPKI:
1000 * L3D_CACHE_ALLOCATE / INST_RETIRED
On Olympus, L2D_CACHE_LMISS_RD counts the same hardware event as
L2D_CACHE_REFILL_RD. At L3, L3D_CACHE_LMISS_RD,
L3D_CACHE_MISS, and L3D_CACHE_REFILL_RD count the same hardware
event. Do not sum the aliases. Select one name for the metric or tool being
used.
Memory Access, Fetch, and Bus Accounting#
Load average latency: Average outstanding read cycles per memory access, as defined by the Linux
t410metrics.Formula:
MEM_ACCESS_RD_PERCYC / MEM_ACCESSInstruction fetch average latency: Average outstanding fetch cycles per instruction fetch.
Formula:
INST_FETCH_PERCYC / INST_FETCHPer-core external bus bandwidth: Data-beat bandwidth between the core’s L2 interface and the uncore.
BUS_ACCESScounts 32-byte beats.Formula:
BUS_ACCESS * 32 / DURATION_TIMEPer-core external bus read bandwidth:
BUS_ACCESS_RD * 32 / DURATION_TIMEPer-core external bus write bandwidth:
BUS_ACCESS_WR * 32 / DURATION_TIMEBus retry ratio: Ratio of retried requests at the core bus interface.
Formula:
BUS_REQUEST_RETRY / BUS_REQUEST_REQRemote accesses per thousand instructions:
1000 * REMOTE_ACCESS / INST_RETIREDREMOTE_ACCESSis a PE-attributed external-bus read view. Correlate it withL1D_CACHE_REFILL_OUTER_REMOTEand filtered UCF memory traffic before concluding that the workload has a NUMA-placement problem.Load alignment-penalty events per thousand instructions:
1000 * LD_ALIGN_LAT / INST_RETIREDStore alignment-penalty events per thousand instructions:
1000 * ST_ALIGN_LAT / INST_RETIREDCombined alignment-penalty events per thousand instructions:
1000 * LDST_ALIGN_LAT / INST_RETIREDThese events count memory accesses that incur additional latency because of address and access-size alignment. Use them with
UNALIGNED_LD_SPECandUNALIGNED_ST_SPECto distinguish issued unaligned operations from accesses that actually encounter an alignment penalty.Streaming stores per thousand instructions:
1000 * STORE_STREAM / INST_RETIREDSTORE_STREAMidentifies lines stored in streaming no-write-allocate mode. This behavior can reduce cache allocations and writebacks, so account for it when cache traffic appears lower than expected for a store-heavy workload.
Note
Core bus events are useful for per-PE traffic pressure. Use the UCF and
PCIe PMUs for socket-level bandwidth and remote/local filtering. Use the
NVLink-C2C, NV-CLink, and NV-DLink PMUs for device-specific latency paths.
BUS_CYCLES increments on CPU clock cycles regardless of PE WFE/WFI
state, so do not substitute it for CPU_CYCLES or CPU_SLOT in
top-down slot formulas.
Prefetch Effectiveness#
The t410 core event set includes first-hit events that help distinguish
prefetch traffic from useful prefetch traffic. These metrics are useful after
cache MPKI or stall metrics suggest a memory-locality issue.
Prefetch accuracy is useful prefetches divided by refilled prefetches. The
Linux t410 predefined coverage metrics use useful prefetches divided by
demand misses plus refilled prefetches. The classic coverage definition uses
useful prefetches divided by demand misses plus useful prefetches. Use the
Linux form when matching perf metric output, and the classic form when
estimating the share of would-be demand misses avoided by prefetching.
L1 instruction demand misses: Define
L1I_DEMAND_MISSESasL1I_CACHE_REFILL_RDL1 instruction prefetch refills: Define
L1I_PREFETCH_REFILLSasL1I_CACHE_REFILL_HWPRF + L1I_CACHE_REFILL_PRFML1 instruction useful prefetches: Define
L1I_USEFUL_PREFETCHESasL1I_CACHE_HIT_RD_FPRFL1 instruction prefetch accuracy percentage:
100 * L1I_USEFUL_PREFETCHES / L1I_PREFETCH_REFILLSL1 instruction prefetch coverage percentage, Linux metric form:
100 * L1I_USEFUL_PREFETCHES / (L1I_DEMAND_MISSES + L1I_PREFETCH_REFILLS)L1 instruction prefetch coverage percentage, classic form:
100 * L1I_USEFUL_PREFETCHES / (L1I_DEMAND_MISSES + L1I_USEFUL_PREFETCHES)L1 instruction hardware-prefetch drop percentage:
100 * L1I_HWPRF_REQ_DROP / L1I_HWPRF_REQL1 instruction software-prefetch drop percentage:
100 * L1I_PRFM_REQ_DROP / L1I_PRFM_REQThe drop ratios are guide-derived diagnostics rather than predefined Linux
t410metrics. Use them to determine whether request suppression, rather than poor use of successfully issued prefetches, contributes to low instruction-prefetch coverage.L1 data demand misses: Define
L1D_DATA_DEMAND_MISSESasL1D_CACHE_REFILL_RWL1 data prefetch refills: Define
L1D_DATA_PREFETCH_REFILLSasL1D_CACHE_REFILL_HWPRF + L1D_CACHE_REFILL_PRFM + L1D_LFB_HIT_RW_FHWPRF + L1D_LFB_HIT_RW_FPRFML1 data useful prefetches: Define
L1D_DATA_USEFUL_PREFETCHESasL1D_CACHE_HIT_RW_FPRF + L1D_LFB_HIT_RW_FHWPRF + L1D_LFB_HIT_RW_FPRFMThe
L1D_LFB_HIT_RW_*events count load-side first hits on lines that are still being filled by prefetches. Store hits on those fill-buffer entries are not included, so L1 data prefetch metrics are load-biased for store-heavy streams.
The accuracy and coverage formulas below use the derived prefetch counts from the preceding bullets.
L1 data prefetch accuracy percentage:
100 * L1D_DATA_USEFUL_PREFETCHES / L1D_DATA_PREFETCH_REFILLSL1 data prefetch coverage percentage, Linux metric form:
100 * L1D_DATA_USEFUL_PREFETCHES / (L1D_DATA_DEMAND_MISSES + L1D_DATA_PREFETCH_REFILLS)L1 data prefetch coverage percentage, classic form:
100 * L1D_DATA_USEFUL_PREFETCHES / (L1D_DATA_DEMAND_MISSES + L1D_DATA_USEFUL_PREFETCHES)L2 prefetch refills: Define
L2_PREFETCH_REFILLSas(L2D_CACHE_REFILL_PRF - L2D_CACHE_REFILL_L1PRF) + L2D_LFB_HIT_RWL1PRF_FHWPRFL2 hardware-prefetch refill share percentage:
100 * L2D_CACHE_REFILL_HWPRF / L2D_CACHE_REFILL_PRFL2 software-prefetch refill share percentage:
100 * L2D_CACHE_REFILL_PRFM / L2D_CACHE_REFILL_PRFL1 prefetch miss ratio at L2:
L2D_CACHE_REFILL_L1PRF / L2D_CACHE_L1PRFL2 useful prefetches: Define
L2_USEFUL_PREFETCHESasL2D_CACHE_HIT_RWL1PRF_FPRF + L2D_LFB_HIT_RWL1PRF_FHWPRFL2 demand misses: Define
L2_DEMAND_MISSESasL2D_CACHE_REFILL_RD + L2D_CACHE_REFILL_WR + L2D_CACHE_REFILL_L1PRFVera does not expose
L2D_LFB_HIT_RWL1PRF_FPRFM, so it is excluded from the L2 formulas.L2 prefetch accuracy percentage:
100 * L2_USEFUL_PREFETCHES / L2_PREFETCH_REFILLSL2 prefetch coverage percentage, Linux metric form:
100 * L2_USEFUL_PREFETCHES / (L2_DEMAND_MISSES + L2_PREFETCH_REFILLS)L2 prefetch coverage percentage, classic form:
100 * L2_USEFUL_PREFETCHES / (L2_DEMAND_MISSES + L2_USEFUL_PREFETCHES)L3 prefetch refills: Define
L3_PREFETCH_REFILLSasL3D_CACHE_REFILL_HWPRF + L3D_CACHE_REFILL_PRFM - L3D_CACHE_REFILL_L1PRF - L3D_CACHE_REFILL_L2PRFL3 hardware-prefetch refill share percentage:
100 * L3D_CACHE_REFILL_HWPRF / L3D_CACHE_REFILL_PRFL3 software-prefetch refill share percentage:
100 * L3D_CACHE_REFILL_PRFM / L3D_CACHE_REFILL_PRFL1 prefetch miss ratio at L3:
L3D_CACHE_REFILL_L1PRF / L3D_CACHE_L1PRFL2 prefetch miss ratio at L3:
L3D_CACHE_REFILL_L2PRF / L3D_CACHE_L2PRFL3 useful prefetches: Define
L3_USEFUL_PREFETCHESasL3D_CACHE_HIT_RWL1PRFL2PRF_FPRFL3 demand misses: Define
L3_DEMAND_MISSESasL3D_CACHE_REFILL_RWL1PRFL2PRF
Note
Treat L3 prefetch access and refill events as directional indicators under high prefetch activity. L3 prefetch counts can appear internally inconsistent, such as refill counts exceeding access counts. Corroborate L3 prefetch metrics with L1/L2 prefetch metrics, demand-miss metrics, uncore bandwidth, and workload-level performance before making tuning decisions.
L3 prefetch accuracy percentage:
100 * L3_USEFUL_PREFETCHES / L3_PREFETCH_REFILLSL3 prefetch coverage percentage, Linux metric form:
100 * L3_USEFUL_PREFETCHES / (L3_DEMAND_MISSES + L3_PREFETCH_REFILLS)L3 prefetch coverage percentage, classic form:
100 * L3_USEFUL_PREFETCHES / (L3_DEMAND_MISSES + L3_USEFUL_PREFETCHES)
Prefetch Waste and Resource Pressure#
Use the following public t410 events when accuracy or coverage alone does
not explain the observed performance:
UNUSED_PFcounts L2 prefetches that were not used. A high count relative to useful-prefetch activity can indicate excess traffic or cache pollution.PFT_SENT,PFT_USEFUL, andPFT_DROPdescribe downstream L2 prefetch-target activity. Do not assumePFT_SENT == PFT_USEFUL + PFT_DROP. A sent request can be satisfied by an SLC hit and therefore fall outside the useful and drop counts.PF_MODE_0_CYCLESthroughPF_MODE_3_CYCLEScount cycles in the most aggressive through most conservative hardware-prefetch modes. Normalize each count by their sum to compare the prefetch mode distribution across equivalent runs.LS_PF_GEN_TABLE_ALLOC_PF_PENDcounts cycles where a hardware prefetch is dropped because the generation table is full and cannot identify a victim. It includes software prefetches converted into hardware prefetches after a data-TLB miss.PF_PRQ_ALLOC_PF_PENDindicates replacement of a pending L1 prefetch request, andL2_TQ_OUTSTANDINGexposes L2 tracker occupancy accumulated per cycle.TXREQ_LIMIT_COUNT_CYCLESand the threshold-specificTXREQ_LIMIT_*_CYCLESevents indicate cycles spent at different request limit levels.
Normalize event counts by INST_RETIRED or CPU_CYCLES when comparing
runs of different lengths. Treat ratios such as PFT_USEFUL / PFT_SENT as
diagnostic indicators, not complete prefetch-accuracy metrics, because the
event definitions do not form an exhaustive partition.
Per-prefetcher L2 Diagnostics#
The Linux t410
miscellaneous event definitions
provide named events for inspecting individual L2 prefetch sources. The
PREFETCH_LATE_* events count demand requests that find a matching prefetch
refill still in flight. The PREFETCH_REFILL_* events count prefetch-caused
L2 refills. The CACHE_HIT_LINE_PF_* events count first demand hits on
lines filled by the corresponding prefetch source.
Prefetch engine |
Late demand-hit event |
L2 refill event |
First-hit event |
|---|---|---|---|
CMC |
|
|
|
Stride |
|
|
|
Spatial |
|
|
|
Translation-table walk |
|
|
|
Page |
|
|
|
GSMS |
|
|
|
SIP consumer |
|
|
|
Store issue |
|
|
|
Store stride |
|
|
|
PC offset |
|
|
|
Instruction fetch |
|
|
|
Converted software prefetch |
|
|
|
For example, to compare late demand hits, refills, and first hits for the stride prefetch engine:
$ perf stat -e armv8_pmuv3_0/prefetch_late_stride/,armv8_pmuv3_0/prefetch_refill_stride/,armv8_pmuv3_0/cache_hit_line_pf_stride/ <workload>
The public t410 metric definitions do not define per-prefetcher accuracy
or coverage formulas for these events. Use the three event counts as
diagnostic indicators and compare them only across equivalent workloads,
affinity, SMT state, and measurement intervals.
The labels CMC, GSMS, and SIP consumer are the source labels used by the public event tables. Because those tables do not publish expanded names, this guide retains the source labels instead of assigning speculative expansions.
TLB Effectiveness#
L1 data TLB miss ratio:
L1D_TLB_REFILL / L1D_TLBL1 data TLB MPKI:
1000 * L1D_TLB_REFILL / INST_RETIREDL1 instruction TLB miss ratio:
L1I_TLB_REFILL / L1I_TLBL1 instruction TLB MPKI:
1000 * L1I_TLB_REFILL / INST_RETIREDData TLB walk ratio:
DTLB_WALK / L1D_TLBData TLB walk MPKI:
1000 * DTLB_WALK / INST_RETIREDData TLB walk average latency:
DTLB_WALK_PERCYC / DTLB_WALKData TLB large-page walk percentage:
100 * DTLB_WALK_LARGE / DTLB_WALKData TLB small-page walk percentage:
100 * DTLB_WALK_SMALL / DTLB_WALKInstruction TLB walk ratio:
ITLB_WALK / L1I_TLBInstruction TLB walk MPKI:
1000 * ITLB_WALK / INST_RETIREDInstruction TLB walk average latency:
ITLB_WALK_PERCYC / ITLB_WALKInstruction TLB large-page walk percentage:
100 * ITLB_WALK_LARGE / ITLB_WALKInstruction TLB small-page walk percentage:
100 * ITLB_WALK_SMALL / ITLB_WALKL2 unified TLB miss ratio:
L2D_TLB_REFILL / L2D_TLBL2 unified TLB MPKI:
1000 * L2D_TLB_REFILL / INST_RETIREDData-side software-prefetch TLB walk percentage:
100 * DTLB_WALK_PRFM / DTLB_WALKInstruction-side software-prefetch TLB walk percentage:
100 * ITLB_WALK_PRFM / ITLB_WALK
Branching#
Branch misprediction ratio: Ratio of retired branches that were mispredicted.
Formula:
BR_MIS_PRED_RETIRED / BR_RETIREDBranch MPKI: Branch mispredictions per thousand retired instructions.
Formula:
1000 * BR_MIS_PRED_RETIRED / INST_RETIREDDirect branch ratio: Direct branches as a share of retired branches.
Formula:
BR_IMMED_RETIRED / BR_RETIREDIndirect branch ratio: Indirect branches, including returns, as a share of retired branches.
Formula:
BR_IND_RETIRED / BR_RETIREDReturn branch ratio: Procedure returns as a share of retired branches.
Formula:
BR_RETURN_RETIRED / BR_RETIREDDirect branch misprediction ratio:
BR_IMMED_MIS_PRED_RETIRED / BR_IMMED_RETIREDIndirect branch misprediction ratio:
BR_IND_MIS_PRED_RETIRED / BR_IND_RETIREDReturn branch misprediction ratio:
BR_RETURN_MIS_PRED_RETIRED / BR_RETURN_RETIREDDirection-misprediction count:
BR_MIS_PRED_DIR_RESOLVEDPolymorphic-indirect misprediction ratio:
BR_MIS_PRED_MULTI_RESOLVED / BR_PRED_MULTI_RESOLVED
Statistical Profiling Extension#
Vera supports the Arm Statistical Profiling Extension (SPE) PMU. SPE is a core-side statistical sampling facility, not one of the System PMUs described below. Use SPE when event counts show that a workload is limited by memory latency, branch behavior, or another execution property that needs attribution to program counters and data addresses. Refer to Statistical Profiling Extension for more information about SPE.
Note
For SVE workloads, use SPE primarily for sampled program-counter and data-address attribution. Treat SPE sample attributes that classify partial or empty SVE predicates as advisory rather than as precise predicate-utilization counts. Use the core PMU SVE predicate events and instruction inspection when partial or empty predicate behavior is part of the analysis.
The SPE PMU is registered with names such as arm_spe_0. Use perf list
to see the supported SPE options on the running kernel:
$ perf list arm_spe
SPE is collected with perf record. The exact filter options are kernel and
tool-version dependent, so start from the options shown by perf list and
then add filters such as load/store or latency filters as needed:
$ perf record -e arm_spe_0// <workload>
$ perf report
Vera System PMUs#
Vera exposes System PMUs for uncore fabrics, IO interfaces, and request-latency paths. These include CoreSight System PMUs and NVIDIA proprietary System PMUs. The PMU families and names are Vera-specific.
For kernel-level sysfs names, event descriptions, filters, and examples, refer to the Linux kernel NVIDIA Tegra410 SoC Uncore PMU documentation.
System PMU Units#
PMU family |
Type |
Example PMU name |
Use |
|---|---|---|---|
UCF |
CoreSight System PMU |
|
SLC events and filtered local, remote, CPU, and non-CPU memory traffic. |
PCIe source |
CoreSight System PMU |
|
Traffic initiated by PCIe root ports or selected bus-device-function sources. |
PCIe target |
CoreSight System PMU |
|
Traffic targeting PCIe root ports or address ranges. |
CPU-memory latency |
NVIDIA proprietary System PMU |
|
CPU-memory read request counts and cumulative outstanding read cycles. |
NVLink-C2C |
NVIDIA proprietary System PMU |
|
C2C inbound and outbound read request counts and cumulative outstanding cycles. Write events are available for GPU peer paths (CG), while SoC peer paths (C2) expose read events only. |
NV-CLink |
NVIDIA proprietary System PMU |
|
NV-CLink inbound and outbound read request counts and cumulative outstanding read cycles. |
NV-DLink |
NVIDIA proprietary System PMU |
|
CXL memory read request counts and cumulative outstanding read cycles over NV-DLink. |
The SMMU PMCG devices, such as smmuv3_pmcg_*, are System PMUs that can be
useful for SMMU transaction and translation analysis. They are listed in the
PMU family table above for completeness, but they are separate from the NVIDIA
System PMU families in this section.
System PMU events are not attributable to a single CPU core. Run perf in
system-wide mode when collecting these events. If a measurement requires
multiple events from the same PMU, group the events so they are scheduled
together:
$ perf stat -a -e duration_time,'{nvidia_ucf_pmu_0/cycles/,nvidia_ucf_pmu_0/mem_bytes_rd,src_loc_cpu=1,dst_loc_cmem=1/,nvidia_ucf_pmu_0/mem_bytes_wr,src_loc_cpu=1,dst_loc_cmem=1/}' sleep 1
To inspect the event names and filters that are available on the running kernel, list the PMU-specific events and sysfs format files:
$ perf list nvidia_ucf_pmu_0
$ ls /sys/bus/event_source/devices/nvidia_ucf_pmu_0/format
For C2C PMUs, the peer sysfs file shows what type of device the PMU is
connected to:
$ cat /sys/bus/event_source/devices/nvidia_nvlink_c2c_pmu_0/peer
When the C2C peer is a GPU, use gpu_mask to select one or more peer GPUs.
Each bit represents a GPU index. For example, gpu_mask=0x1 selects GPU 0,
and gpu_mask=0x3 selects GPU 0 and GPU 1. If gpu_mask is omitted, the
PMU monitors all connected GPUs.
Uncore Traffic Coverage#
Vera uncore PMUs use source, destination, peer, or address filters to focus
measurements on specific traffic paths. In the following table, source and
target describe the initiator interface and the destination interface or memory
address home used by the PMU filters. NVLink-C2C and NV-CLink refer to
interconnect interfaces, not memory types.
Traffic source |
Traffic target |
PMU coverage |
|---|---|---|
Local CPU |
Local CPU or system memory |
UCF PMU |
Local CPU |
Remote CPU, GPU, or CXL memory address |
UCF PMU |
Remote socket |
Local CPU or system memory |
UCF PMU |
NVLink-C2C interface |
Peer GPU or peer SoC over C2C |
NVLink-C2C PMU for C2C request counts and latency. The UCF PMU can observe associated coherent local or remote memory traffic. |
NV-CLink interface |
Peer Vera SoC over NV-CLink |
NV-CLink PMU for incoming and outgoing inter-socket read request counts and latency. The UCF PMU can observe associated memory traffic with local or remote filters. |
NV-DLink interface |
CXL memory over NV-DLink |
NV-DLink PMU for CXL memory read request counts and latency. |
PCIe root port or BDF |
Local memory, remote memory, CXL memory, or peer PCIe |
PCIe source PMU. The UCF PMU can also observe coherent local fabric traffic. |
SoC fabric target path |
PCIe BAR or CXL HDM address range |
PCIe target PMU with root-port or address filters. |
The UCF PMU provides the following filters:
Source filters:
src_loc_cpufor local CPU initiators,src_loc_noncpufor local non-CPU initiators, andsrc_remfor initiators from a remote socket.Destination filters:
dst_loc_cmemfor local CPU or system memory,dst_loc_gmemfor local GPU memory,dst_loc_otherfor local CXL memory, anddst_remfor CPU, GPU, or CXL memory addresses homed on a remote socket.External snoop events: for
ext_snp_*events, the driver enables all UCF source and destination filters by default. Users do not need to passsrc_*ordst_*filter parameters for these events. Treat the counts as all-source, all-destination external snoop activity.
The PCIe source PMU provides the following filters:
Source filters:
src_rp_maskselects root-port bits in the root complex.src_bdfselects one bus-device-function value encoded as(bus << 8) + (device << 3) + functionand requiressrc_bdf_en=1. Root-port and BDF filters are mutually exclusive. If enabled, the BDF filter applies to all events in that root complex.Destination filters:
dst_loc_cmemfor local CPU or system memory,dst_loc_gmemfor local GPU memory,dst_loc_pcie_p2pfor local PCIe peer traffic,dst_loc_pcie_cxlfor local CXL memory, anddst_remfor remote memory.
The PCIe target PMU provides the following filters:
Target root-port filter:
dst_rp_maskselects target root-port bits for PCIe BAR traffic.Target address filters:
dst_addr_base,dst_addr_mask, anddst_addr_en. Address filtering counts traffic where(address & dst_addr_mask) == (dst_addr_base & dst_addr_mask). If no target filter is specified, the PMU defaults to PCIe BAR traffic to all root ports.
UCF PMU Accounting#
The UCF PMU monitors SLC behavior and filtered memory traffic. UCF is the
distributed cache and coherent interconnect for CPU clusters, GPUs, the PCIe
Ordering Controller Unit (OCU), and other IO-coherent requesters. It also acts
as the last-level cache for CPU and CXL memory traffic. Vera platforms can
expose one UCF PMU per socket, such as nvidia_ucf_pmu_0 and
nvidia_ucf_pmu_1.
UCF PMU Events#
Event |
Description |
|---|---|
|
UCF PMU cycle counter. |
|
Bus cycle count. |
|
SLC allocations. |
|
SLC writebacks. |
|
SLC read refills. |
|
SLC write refills. |
|
SLC read accesses. |
|
SLC write accesses. |
|
SLC dataless accesses, such as coherence operations that do not transfer a data payload. |
|
SLC atomic accesses. |
|
SLC read bytes. |
|
SLC write bytes. |
|
SLC read hits. |
|
Filtered memory read accesses. |
|
Filtered memory write accesses. |
|
Filtered memory read bytes. |
|
Filtered memory write bytes. |
|
Local snoop events. |
|
External snoop accesses. The driver applies all UCF source and destination filters by default. |
|
External snoop evictions. The driver applies all UCF source and destination filters by default. |
UCF PMU Metrics#
Because DURATION_TIME is reported in nanoseconds, bytes /
DURATION_TIME reports GB/s.
UCF frequency:
CYCLES / DURATION_TIMEFiltered read bandwidth:
MEM_BYTES_RD / DURATION_TIMEFiltered write bandwidth:
MEM_BYTES_WR / DURATION_TIMEFiltered bidirectional bandwidth:
(MEM_BYTES_RD + MEM_BYTES_WR) / DURATION_TIMEFiltered read requests per PMU cycle:
MEM_ACCESS_RD / CYCLESFiltered write requests per PMU cycle:
MEM_ACCESS_WR / CYCLESSLC read bandwidth:
SLC_BYTES_RD / DURATION_TIMESLC write bandwidth:
SLC_BYTES_WR / DURATION_TIMESLC read requests per PMU cycle:
SLC_ACCESS_RD / CYCLESSLC write requests per PMU cycle:
SLC_ACCESS_WR / CYCLESSLC read hit ratio:
SLC_HIT_RD / SLC_ACCESS_RDSLC read refill ratio:
SLC_REFILL_RD / SLC_ACCESS_RDSLC write refill ratio:
SLC_REFILL_WR / SLC_ACCESS_WR
Note
Remote CPU write accounting is observation-point dependent. On the
requesting socket, metrics that use MEM_BYTES_WR or MEM_ACCESS_WR
with src_loc_cpu=1,dst_rem=1 count requester-side remote writes, but
they do not include dirty data that returns to the socket where the target
memory is homed as snoop-response data. That returned data is visible from
the home-socket UCF view as SLC writeback behavior, and can be captured with
MEM_*_WR using src_rem=1,dst_loc_cmem=1 filters. Do not treat the
requester-side dst_rem write metrics as total inter-socket write-data
traffic. Compare both views when reconciling remote writes.
CPU and Fabric Traffic Templates#
To measure SLC read access, hit, refill, and byte counters on socket 0:
$ perf stat -a -e duration_time,'{nvidia_ucf_pmu_0/cycles/,nvidia_ucf_pmu_0/slc_access_rd/,nvidia_ucf_pmu_0/slc_hit_rd/,nvidia_ucf_pmu_0/slc_refill_rd/,nvidia_ucf_pmu_0/slc_bytes_rd/,nvidia_ucf_pmu_0/slc_bytes_wr/}' <workload>
For synchronization-heavy or coherence-heavy workloads, also collect
slc_access_atomic and slc_access_dataless. Read and write accesses do
not account for these access classes.
To measure CPU traffic to local CPU memory on socket 0:
$ perf stat -a -e duration_time,'{nvidia_ucf_pmu_0/cycles/,nvidia_ucf_pmu_0/mem_bytes_rd,src_loc_cpu=1,dst_loc_cmem=1/,nvidia_ucf_pmu_0/mem_bytes_wr,src_loc_cpu=1,dst_loc_cmem=1/}' <workload>
To measure CPU traffic from socket 0 to remote memory:
$ perf stat -a -e duration_time,'{nvidia_ucf_pmu_0/cycles/,nvidia_ucf_pmu_0/mem_bytes_rd,src_loc_cpu=1,dst_rem=1/,nvidia_ucf_pmu_0/mem_bytes_wr,src_loc_cpu=1,dst_rem=1/}' <workload>
To measure traffic from a remote socket to local CPU memory on socket 0:
$ perf stat -a -e duration_time,'{nvidia_ucf_pmu_0/cycles/,nvidia_ucf_pmu_0/mem_bytes_rd,src_rem=1,dst_loc_cmem=1/,nvidia_ucf_pmu_0/mem_bytes_wr,src_rem=1,dst_loc_cmem=1/}' <workload>
Use this template on the home socket for the target CPU memory, socket 0 in
this example, with the requester-side src_loc_cpu=1,dst_rem=1 view when
checking remote CPU writes. The requester-side write events do not count dirty
data that travels to the home socket as snoop-response data.
To measure non-CPU local fabric traffic to local CPU memory:
$ perf stat -a -e duration_time,'{nvidia_ucf_pmu_0/cycles/,nvidia_ucf_pmu_0/mem_bytes_rd,src_loc_noncpu=1,dst_loc_cmem=1/,nvidia_ucf_pmu_0/mem_bytes_wr,src_loc_noncpu=1,dst_loc_cmem=1/}' <workload>
PCIe PMU Accounting#
Vera exposes PCIe source PMUs for traffic initiated by PCIe sources and PCIe
target PMUs for traffic targeting PCIe. The PMU instance name includes the
socket and root-complex index, such as nvidia_pcie_pmu_0_rc_0 and
nvidia_pcie_tgt_pmu_0_rc_0.
PCIe Source PMU Events#
Event |
Description |
|---|---|
|
PCIe source PMU cycle counter. |
|
Filtered read bytes. |
|
Filtered write bytes. |
|
Filtered read requests. |
|
Filtered write requests. |
|
Cumulative outstanding read request cycles. |
PCIe Target PMU Events#
Event |
Description |
|---|---|
|
Filtered read bytes. |
|
Filtered write bytes. |
|
Filtered read requests. |
|
Filtered write requests. |
|
PCIe target PMU cycle counter. |
PCIe PMU Metrics#
PCIe source frequency:
CYCLES / DURATION_TIMEPCIe source read bandwidth:
RD_BYTES / DURATION_TIMEPCIe source write bandwidth:
WR_BYTES / DURATION_TIMEPCIe source bidirectional bandwidth:
(RD_BYTES + WR_BYTES) / DURATION_TIMEPCIe source read requests per PMU cycle:
RD_REQ / CYCLESPCIe source write requests per PMU cycle:
WR_REQ / CYCLESPCIe source read latency:
(RD_CUM_OUTS / RD_REQ) / (CYCLES / DURATION_TIME)PCIe target frequency:
CYCLES / DURATION_TIMEPCIe target read bandwidth:
RD_BYTES / DURATION_TIMEPCIe target write bandwidth:
WR_BYTES / DURATION_TIMEPCIe target bidirectional bandwidth:
(RD_BYTES + WR_BYTES) / DURATION_TIMEPCIe target read requests per PMU cycle:
RD_REQ / CYCLESPCIe target write requests per PMU cycle:
WR_REQ / CYCLES
Note
PCIe source read latency is measured inside the PMU’s request-observation point. It does not include every component of end-to-end device or software latency.
PCIe Traffic Templates#
To measure reads and writes from PCIe root ports selected by a root-port mask to local CPU memory:
$ perf stat -a -e duration_time,'{nvidia_pcie_pmu_0_rc_0/cycles/,nvidia_pcie_pmu_0_rc_0/rd_bytes,src_rp_mask=0xff,dst_loc_cmem=1/,nvidia_pcie_pmu_0_rc_0/wr_bytes,src_rp_mask=0xff,dst_loc_cmem=1/}' <workload>
To measure PCIe source read latency for root-port traffic to local CPU memory:
$ perf stat -a -e duration_time,'{nvidia_pcie_pmu_0_rc_0/cycles/,nvidia_pcie_pmu_0_rc_0/rd_req,src_rp_mask=0xff,dst_loc_cmem=1/,nvidia_pcie_pmu_0_rc_0/rd_cum_outs,src_rp_mask=0xff,dst_loc_cmem=1/}' <workload>
To measure PCIe source traffic from one BDF, encode the BDF as
(bus << 8) + (device << 3) + function. For example, BDF 01:01.0 is
0x0108:
$ perf stat -a -e duration_time,'{nvidia_pcie_pmu_0_rc_4/cycles/,nvidia_pcie_pmu_0_rc_4/rd_bytes,src_bdf=0x0108,src_bdf_en=1/,nvidia_pcie_pmu_0_rc_4/wr_bytes,src_bdf=0x0108,src_bdf_en=1/}' <workload>
To measure PCIe source traffic to remote memory:
$ perf stat -a -e duration_time,'{nvidia_pcie_pmu_0_rc_0/cycles/,nvidia_pcie_pmu_0_rc_0/rd_bytes,src_rp_mask=0xff,dst_rem=1/,nvidia_pcie_pmu_0_rc_0/wr_bytes,src_rp_mask=0xff,dst_rem=1/}' <workload>
To measure PCIe source traffic to local peer-to-peer PCIe:
$ perf stat -a -e duration_time,'{nvidia_pcie_pmu_0_rc_0/cycles/,nvidia_pcie_pmu_0_rc_0/rd_bytes,src_rp_mask=0xff,dst_loc_pcie_p2p=1/,nvidia_pcie_pmu_0_rc_0/wr_bytes,src_rp_mask=0xff,dst_loc_pcie_p2p=1/}' <workload>
To measure PCIe source traffic to a local CXL target:
$ perf stat -a -e duration_time,'{nvidia_pcie_pmu_0_rc_0/cycles/,nvidia_pcie_pmu_0_rc_0/rd_bytes,src_rp_mask=0xff,dst_loc_pcie_cxl=1/,nvidia_pcie_pmu_0_rc_0/wr_bytes,src_rp_mask=0xff,dst_loc_pcie_cxl=1/}' <workload>
To measure traffic targeting PCIe root ports:
$ perf stat -a -e duration_time,'{nvidia_pcie_tgt_pmu_0_rc_0/cycles/,nvidia_pcie_tgt_pmu_0_rc_0/rd_bytes,dst_rp_mask=0xff/,nvidia_pcie_tgt_pmu_0_rc_0/wr_bytes,dst_rp_mask=0xff/}' <workload>
To measure traffic targeting a PCIe BAR or CXL HDM address range, use the
target address filter. This example counts traffic where the masked address
matches 0x10000 through 0x100ff:
$ perf stat -a -e duration_time,'{nvidia_pcie_tgt_pmu_0_rc_1/cycles/,nvidia_pcie_tgt_pmu_0_rc_1/rd_bytes,dst_addr_base=0x10000,dst_addr_mask=0xffffffffffffff00,dst_addr_en=1/,nvidia_pcie_tgt_pmu_0_rc_1/wr_bytes,dst_addr_base=0x10000,dst_addr_mask=0xffffffffffffff00,dst_addr_en=1/}' <workload>
CMEM, NVLink-C2C, NV-CLink, and NV-DLink Latency PMUs#
Some Vera System PMUs expose read request counts and cumulative outstanding read cycles rather than byte counters. The NVLink-C2C PMU can also expose write request counts and cumulative outstanding write cycles when the peer is a GPU. Use these PMUs to estimate average request latency for CPU memory, NVLink-C2C, NV-CLink, and NV-DLink paths. Use UCF or PCIe byte counters when you need bandwidth for the corresponding traffic path.
These latency PMUs cover the following paths:
CMEM: Read requests from the UCF edge to local CPU DRAM.
NVLink-C2C: Memory read requests that pass through the NVIDIA Chip-to-Chip (C2C) interface between the Vera SoC and a peer device. When the C2C peer is a GPU (CG path), the PMU also exposes write request events. When the peer is another SoC (C2 path), only read events are available.
NV-CLink: Incoming and outgoing memory read requests that pass through the NV-CLink interface between Vera SoCs.
NV-DLink: CXL memory read requests that pass through the NV-DLink interface.
CMEM Latency PMU Events#
Event |
Description |
|---|---|
|
PMU cycle counter. |
|
Read requests. |
|
Cumulative outstanding read request cycles. |
NVLink-C2C PMU Events#
Event |
Description |
|---|---|
|
PMU cycle counter. |
|
Cumulative outstanding inbound read request cycles. |
|
Inbound read requests. |
|
Cumulative outstanding inbound write request cycles. |
|
Inbound write requests. |
|
Cumulative outstanding outbound read request cycles. |
|
Outbound read requests. |
|
Cumulative outstanding outbound write request cycles. |
|
Outbound write requests. |
NVLink-C2C inbound events count requests from the remote device to the SoC. Outbound events count requests from the SoC to the remote device. Write events are available for GPU peer paths (CG). SoC peer paths (C2) expose read events only.
NV-CLink PMU Events#
Event |
Description |
|---|---|
|
PMU cycle counter. |
|
Cumulative outstanding inbound read request cycles. |
|
Inbound read requests. |
|
Cumulative outstanding outbound read request cycles. |
|
Outbound read requests. |
NV-DLink PMU Events#
Event |
Description |
|---|---|
|
PMU cycle counter. |
|
Cumulative outstanding CXL memory read request cycles. |
|
CXL memory read requests. |
Latency Metrics#
Because DURATION_TIME is reported in nanoseconds, the following formulas
report nanoseconds.
CMEM read latency:
(RD_CUM_OUTS / RD_REQ) / (CYCLES / DURATION_TIME)NVLink-C2C inbound read latency:
(IN_RD_CUM_OUTS / IN_RD_REQ) / (CYCLES / DURATION_TIME)NVLink-C2C outbound read latency:
(OUT_RD_CUM_OUTS / OUT_RD_REQ) / (CYCLES / DURATION_TIME)NVLink-C2C inbound write latency:
(IN_WR_CUM_OUTS / IN_WR_REQ) / (CYCLES / DURATION_TIME)NVLink-C2C outbound write latency:
(OUT_WR_CUM_OUTS / OUT_WR_REQ) / (CYCLES / DURATION_TIME)NV-CLink inbound read latency:
(IN_RD_CUM_OUTS / IN_RD_REQ) / (CYCLES / DURATION_TIME)NV-CLink outbound read latency:
(OUT_RD_CUM_OUTS / OUT_RD_REQ) / (CYCLES / DURATION_TIME)NV-DLink CXL memory read latency:
(IN_RD_CUM_OUTS / IN_RD_REQ) / (CYCLES / DURATION_TIME)
Latency PMU Templates#
To measure CPU-memory read latency on socket 0:
$ perf stat -a -e duration_time,'{nvidia_cmem_latency_pmu_0/cycles/,nvidia_cmem_latency_pmu_0/rd_req/,nvidia_cmem_latency_pmu_0/rd_cum_outs/}' <workload>
To measure C2C read-request latency counters on socket 0:
$ perf stat -a -e duration_time,'{nvidia_nvlink_c2c_pmu_0/cycles/,nvidia_nvlink_c2c_pmu_0/in_rd_req/,nvidia_nvlink_c2c_pmu_0/in_rd_cum_outs/,nvidia_nvlink_c2c_pmu_0/out_rd_req/,nvidia_nvlink_c2c_pmu_0/out_rd_cum_outs/}' <workload>
To measure C2C write-request latency counters for GPU peers:
$ perf stat -a -e duration_time,'{nvidia_nvlink_c2c_pmu_0/cycles/,nvidia_nvlink_c2c_pmu_0/in_wr_req/,nvidia_nvlink_c2c_pmu_0/in_wr_cum_outs/,nvidia_nvlink_c2c_pmu_0/out_wr_req/,nvidia_nvlink_c2c_pmu_0/out_wr_cum_outs/}' <workload>
To measure NVLink-C2C inbound reads from GPU 0, apply gpu_mask=0x1:
$ perf stat -a -e duration_time,'{nvidia_nvlink_c2c_pmu_0/cycles/,nvidia_nvlink_c2c_pmu_0/in_rd_req,gpu_mask=0x1/,nvidia_nvlink_c2c_pmu_0/in_rd_cum_outs,gpu_mask=0x1/}' <workload>
To measure NV-CLink read-request latency counters on socket 0:
$ perf stat -a -e duration_time,'{nvidia_nvclink_pmu_0/cycles/,nvidia_nvclink_pmu_0/in_rd_req/,nvidia_nvclink_pmu_0/in_rd_cum_outs/,nvidia_nvclink_pmu_0/out_rd_req/,nvidia_nvclink_pmu_0/out_rd_cum_outs/}' <workload>
To measure NV-DLink CXL memory read-request latency counters on socket 0:
$ perf stat -a -e duration_time,'{nvidia_nvdlink_pmu_0/cycles/,nvidia_nvdlink_pmu_0/in_rd_req/,nvidia_nvdlink_pmu_0/in_rd_cum_outs/}' <workload>
Profiling CPU Behavior with Nsight Systems#
The Nsight Systems tool, also referred to as nsys, profiles the system’s
compute units, including CPUs and GPUs. The tool can trace CUDA APIs, sample
CPU instruction pointers and backtraces, sample CPU core event counts, and
sample GPU hardware event counts to provide a system-wide view of workload
behavior. On supported systems and Nsight Systems editions, it can also sample
uncore CPU-socket events.
nsys can graph sampled CPU event rates on the Nsight Systems timeline.
CPU event sampling is system-wide: event counts are collected across CPUs and
are not directly attributed to individual processes or threads. When you also
gather CPU instruction-pointer or backtrace data, use timeline correlation to
identify code that was running during periods of high or low PMU activity.
Treat that relationship as temporal correlation, not proof that a specific
process caused the observed event rate.
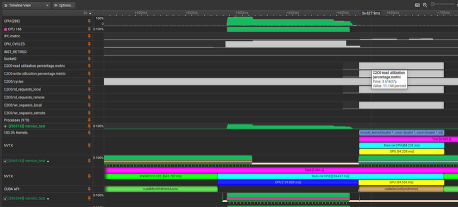
Example Nsight Systems Timeline#
Use --cpu-metrics to select CPU core events and derived metrics by name or
alias on supported Nsight Systems versions. Run
nsys profile --cpu-metrics=help to inspect what the installed version and
CPU expose. CPU event-counter sampling must also be enabled with
--event-sample=system-wide. Use --sample for CPU instruction-pointer
or backtrace sampling and --cpuctxsw for scheduler activity. Those options
do not enable event-counter sampling by themselves.
For example, after confirming the names with --cpu-metrics=help:
$ nsys profile --event-sample=system-wide --cpu-metrics=ITLB_WALK,DTLB_WALK,ipc --event-sampling-interval=5 <workload>
The legacy --cpu-core-metrics and --cpu-socket-metrics options are
Grace-specific. For Vera CPU core events and metrics, prefer
--cpu-metrics when it is available in the installed version. Do not assume
that the legacy --cpu-core-events interface applies to Vera.
Use --cpu-socket-events=help to inspect available uncore CPU-socket events.
On non-Embedded editions, selected socket events also require
--event-sample=system-wide. The separate --soc-metrics feature is
available only in Nsight Systems Embedded Platforms Edition and should not be
treated as another name for CPU core or CPU-socket event sampling.
Nsight Systems can multiplex event groups when a requested event set exceeds
the available hardware counters. Within the applicable event-selection
option, separate groups with % and use
--event-sampling-multiplex-interval to control how often Nsight Systems
switches groups. Events in one group must fit within the available PMU
counters. Use --cpu-metrics=help or the corresponding event-option help to
check the simultaneous collection limit.
Exact option support depends on the installed Nsight Systems edition, version,
and CPU. For more information, run nsys profile --help and refer to the
Nsight Systems User Guide.
nsys also supports multi-node performance analysis. In a multi-node run,
nsys typically generates one result file per rank. You can load multiple
reports in the UI for timeline visualization, or use Nsight Systems
Multi-Report Analysis recipes for statistical analysis across reports. To
reduce memory usage, collect the minimum amount of data required to capture the
behavior of interest.
Measurement Checklist#
Before drawing a performance conclusion from PMU data:
Confirm event and metric availability with
perf liston the measured system.Record the kernel,
perfversion, workload arguments, CPU affinity, SMT state, NUMA placement, and measurement duration.Select the PMU observation point that matches the question: core events for PE-attributed behavior and System PMUs for aggregate fabric or interface traffic.
Collect numerator and denominator events over equivalent intervals. Prefer one schedulable event group. Otherwise, repeat a stable workload and inspect counter running-time percentages for multiplexing.
Treat a zero denominator as no data for that metric, not as a zero result.
Repeat the measurement and compare distributions when run-to-run variation can affect the conclusion.
Correlate counter-derived symptoms with workload throughput or latency before making a tuning decision.