


GPU Node Triage#
There are several ways that system support teams are notified about potential issues on GPU based systems. These can come from error reports, monitoring system events, and diagnostic metrics. While these events can impact the operation of a GPU system, not all require intervention of the system vendor for resolution. In addition, there are common tools which can be used to gather data after a system issue which are useful to both the local system support team and the vendor for node triage.
Figure 1 to Figure 3 are flowcharts of how node triage should start based on the information provided indicating there may be a node issue.
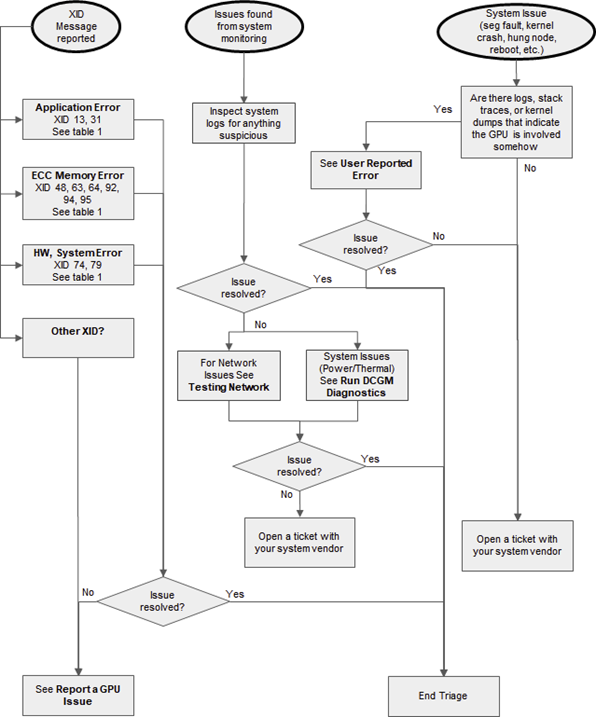
Figure 1 GPU Triage Flowchart#
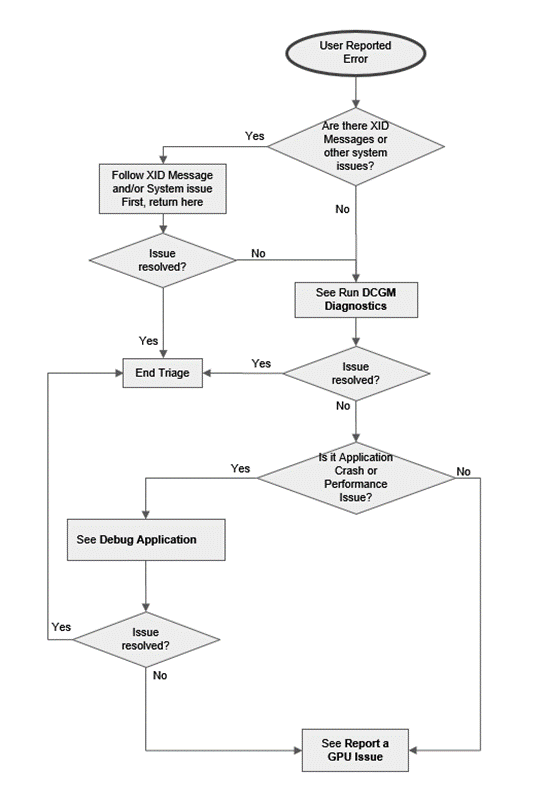
Figure 2 GPU Triage Flowchart (User Reported Error)#
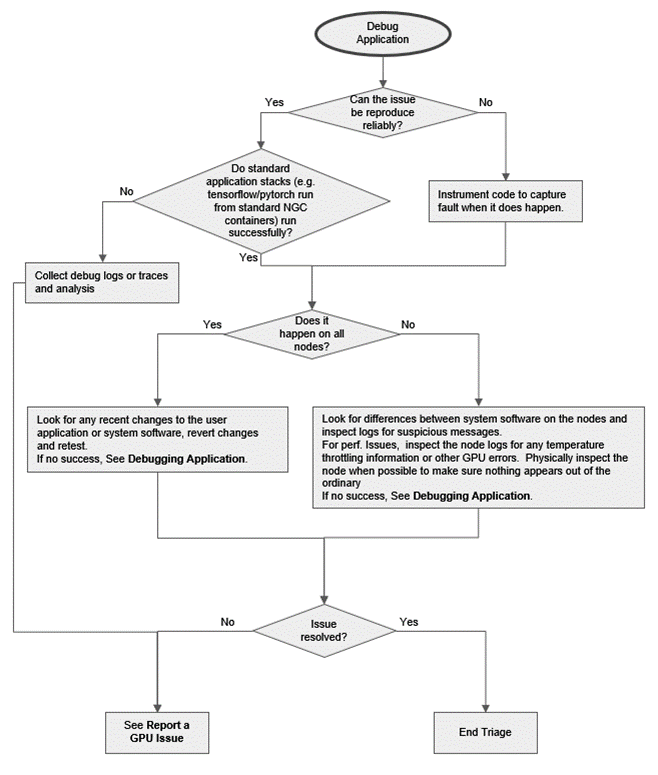
Figure 3 GPU Triage Flowchart (Debug Application)#
Reporting a GPU Issue#
When gathering data for your system vendor, you should include the following:
Basic system configuration such as OS and driver info.
A clear description of the issue, including any key log messages describing the problem.
List of debug steps taken.
A full listing of the log used for the key messages above.
Output of
nvidia-bug-report.sh.Fabric manager log files for HGX systems.
DCGM Diagnostics logs.
If associated with a user application, any details you can provide to the nature of the application (ISV code, framework, version numbers, and so on) and links to source code (if possible).
Submit a ticket to your system vendor.
Understanding Xid Messages#
The XID error document gives a listing of XID errors and potential causes. At the end of the document it also provides more information on some common XID errors and recommended actions. For details, refer to https://docs.nvidia.com/deploy/xid-errors/index.html.
The most common XID messages in Data Center deployments and recommended steps are listed in Table 1.
Xid |
Description |
Action |
|---|---|---|
13 |
Graphics Engine Exception |
Run DCGM and Field diagnostics to confirm if the issue is related to hardware. If not, debug the user application using guidance from https://docs.nvidia.com/deploy/xid-errors/index.html. If the latter, see Reporting a GPU Issue. |
31 |
Suspected Hardware Problems |
Contact the hardware vendor. They can run through their hardware diagnostic process. |
45 |
Robust Channel Preemptive Removal |
No action, informative only. Indicates channels affected by another failure. On A100, this error could be seen by itself due to unexpected Fabric Manager shutdown when FM is running in the same OS environment as the GPU. Otherwise, this error is safe to ignore as an informational message. |
48 |
Double Bit ECC Error |
If Xid 48 is followed by Xid 63 or 64: Drain/cordon the node, wait for all work to complete, and reset GPU(s) reporting the XID (refer to GPU reset capabilities/limitations section below). If Xid 48 is not followed by Xid 63 or 64: see Running Field Diagnostics to collect additional debug information. See below for guidelines on when to RMA GPUs based on excessive errors. |
61 |
PMU Breakpoint |
Report a GPU Issue and Reset GPU(s) reporting the XID (refer GPU reset capabilities/limitations section below). |
62 |
PMU Halt Error |
Report a GPU Issue and Reset GPU(s) reporting the XID (refer GPU reset capabilities/limitations section below). |
63 |
Legacy GPU: ECC page retirement recording event |
If associated with XID 48, drain/cordon the node, wait for all work to complete, and reset GPU(s) reporting the XID (refer to GPU reset capabilities/limitations section below). If not, it is from a single bit error and the system can keep running as is until there is a convenient time to reboot it. See below for guidelines on when to RMA GPUs based on excessive errors. |
A100: Row-remapping recording event |
If associated with XID 94, the application that encountered the error needs to be restarted. All other applications on the system can keep running as is until there is a convenient time to reset the GPU (refer to GPU reset capabilities/limitations section below) or reboot for row remapping to activate. See below for guidelines on when to RMA GPUs based on row remapping failures. |
|
64 |
Legacy GPU: ECC page retirement recording failure |
See above, however the node should be monitored closely. If there is no associated XID 48 error, then these are related to single bit-errors. The GPU(s) reporting the error must be reset (refer to GPU reset capabilities/limitations section below) immediately since there is a recording failure. If the errors continue, drain, triage, and see Reporting a GPU Issue. See below for guidelines on when to RMA GPUs based on excessive errors. |
A100: Row-remapping recording failure |
The node should be rebooted immediately since there is a recording failure. If the errors continue, drain, triage, and see Reporting a GPU Issue. See below for guidelines on when to RMA GPUs based on row remapping failures. |
|
74 |
NVLink Error |
Extract the hex strings from the XID error message. e.g., (0x12345678, 0x12345678, 0x12345678, 0x12345678, 0x12345678, 0x12345678, 0x12345678) Look at the bolded DWORD (the first) and take the following paths if the particular bits (counting from LSB side) are set. Bits 4 or 5: Likely HW issue with ECC/Parity –> If seen more than 2 times on the same link, report a bug. Bits 21 or 22: Marginal channel SI issue. Check link mechanical connections. If other errors accompany, follow the resolution for those. Bits 8, 9, 12, 16, 17, 24, 28: Could possibly be a HW issue; Check link mechanical connections and re-seat if a field resolution is required. Run diags if issue persists. |
79 |
GPU has fallen off the bus |
Drain and see Reporting a GPU Issue. |
92 |
High single-bit ECC error rate |
See Running Field Diagnostics to collect additional debug information. See below for guidelines on when to RMA GPUs based on excessive errors. |
94 |
Contained ECC error occurred (A100 only) |
The application that encountered the error needs to be restarted. All other applications on the system can keep running as is until there is a convenient time to reset the GPU (refer to GPU reset capabilities/limitations section below) or reboot for row remapping to activate. See below for guidelines on when to RMA GPUs based on row remapping failures. |
95 |
Uncontained ECC error occurred (A100 only) |
If MIG is enabled, drain any work on the other GPU instances, wait for all work to complete, and reset GPU(s) reporting the XID (refer to the GPU reset capabilities/limitations section below). If MIG is disabled, the node should be rebooted immediately since there is an uncorrectable uncontained ECC error. If the errors continue, drain, triage, and see Reporting a GPU Issue. See below for guidelines on when to RMA GPUs based on row remapping failures. |
123 |
SPI PMU RPC write fail |
Report a GPU issue and reset GPU(s) reporting the XID (refer to GPU reset capabilities/limitations section provided in the FM User Guide). |
XID messages 48, 63, 64, 92, 94 and 95 are related to GPU memory errors. NVIDIA GPUs prior to A100 support dynamic page retirement. For details on dynamic page retirement, refer to https://docs.nvidia.com/deploy/dynamic-page-retirement/index.html.
NVIDIA A100 GPUs introduce new memory error recovery features that improve resilience and avoid impacting unaffected applications. For details on A100 GPU Memory Error Management, refer to https://docs.nvidia.com/deploy/a100-gpu-mem-error-mgmt/index.html.
In addition, there are SXID messages for issues with the NVSwitch. Depending on the severity (fatal vs non-fatal) and the impacted port, the errors may abort existing CUDA jobs and prevent new CUDA job launches. For details, refer to https://docs.nvidia.com/datacenter/tesla/fabric-manager-user-guide/index.html.
GPU/VM/System Reset Capabilities/Limitations:
Refer to the following excerpt from the nvidia-smi man page:
Trigger a reset of one or more GPUs. Can be used to clear GPU HW and SW state in situations that would otherwise require a machine reboot.
Typically useful if a double bit ECC error has occurred. Optional -i switch can be used to target one or more specific devices. Without
this option, all GPUs are reset. Requires root. There can’t be any applications using these devices (for example, CUDA application, graphics
application like X server, monitoring application like other instance of nvidia-smi).
FM State |
Bare Metal |
Virtualization - All devices in same VM |
Shared NVSwitch Virtualization - GPUs and Switches in different VMs |
|
|---|---|---|---|---|
NVIDIA Ampere architecture and later with direct NVLink connect |
N/A |
A GPU can be reset individually. Plus, all GPUs can be reset without specifying |
GPU reset not supported in VMs. Restart the VM. |
N/A |
NVIDIA Ampere architecture + NVSwitch |
Running |
A GPU can be reset individually. As part of GPU reset operation, corresponding NVSwitch side links will be reset automatically as well by the FM. |
GPU reset not supported in VMs. Restart the VM. |
Restart GPU-only VMs. The service VM flow should ensure proper reset of NVSwitch links through communication with the FM. |
NOT Running |
Individual GPU reset is not supported. Reset all GPUs & NVSwitches connected together via NVLink. |
GPU reset not supported in VMs. Restart the VM. |
||
Hopper and later + NVSwitch |
N/A |
GPU(s) can be reset individually regardless of the FM dependency. Plus, all GPUs and NVSwitches can be reset without specifying |
GPU reset ability depends on permissions allowed to VM by hypervisor. If not allowed, restart VM. |
GPU reset ability depends on permissions allowed to VM by hypervisor. If not allowed, restart VM. |
Running DCGM Diagnostics#
- DCGM is a system level tool that provides a diagnostic test for production environments to assess node health and cluster readiness. For details, refer to
https://docs.nvidia.com/datacenter/dcgm/latest/user-guide/dcgm-diagnostics.html.
There are many options available for running the test, and a few default configurations that should work on most systems, specified with
the --run (-r) option. The available test suites are 1 (short), 2 (medium), and 3 (long). For fully stressing the system, use the long (3) option.
# dcgmi diag -r 3
The long test should take approximately 30 minutes. The other options can be used as pre-flight checks or in the system prolog to validate the node prior to starting jobs.
When DCGM diagnostics finds an issue, attempt to resolve it. Issues with the configuration can be handled with IT commands and DCGM may provide suggestions as to where to start. If the diagnostic tests find an issue with the operation of the GPU or NVSwitch fabric (when present), inspect the node and node configuration for anything out of normal.
Running Field Diagnostics#
Field diagnostic is the authoritative and comprehensive NVIDIA tool for determining the health of GPUs. It is usually required before an RMA can be started. Please contact your system vendor for instructions on when, if, and how you should run this tool.
Network Testing#
Network performance and latency can be tested using the NCCL performance tests (NVIDIA/nccl-tests). In particular,
the all_reduce_perf test is a great test for establishing network performance between groups of nodes. Pairwise tests of nodes
should result in the same performance. When a slow pair of nodes is identified, retest with those nodes and different nodes to
isolate the issue. In multi-rail network topologies, the tests can also be isolated to specific rails to determine which network
interface is of concern. More information can be found at https://developer.nvidia.com/nccl.
It is advisable to run the network tests prior to putting systems into production and record the performance achieved. This will help you understand the performance of your network and provide a baseline for future comparisons. The performance of groups of nodes can vary depending on the system network topology. Coordinate with your network vendor/architect to help understand what performance should be achievable.
Debugging Applications#
Debugging an application typically requires attaching a debugger to the user application and gathering as much data as possible up until the application crashes. The issue causing the application crash could be related to the system software, but debugging the process is the fastest way to understand where the crash is and if it can be resolved from the application side. The data gathered from the debugger can be used by NVIDIA to start debugging system software issues.
CUDA-GDB is the NVIDIA tool for debugging CUDA applications running on Linux and QNX. This enables developers to debug applications without the potential variations introduced by simulation and emulation environments. For details see https://developer.nvidia.com/cuda-gdb and https://docs.nvidia.com/cuda/cuda-gdb/index.html.
If the issue is related to performance, one can use a performance profiler, such as Nsight Systems or Nsight Compute, to understand the performance and bottlenecks in an application. Changes in system software can cause changes in application performance so even if the application did not change, profiling the application is an important step. Profiler data can highlight performance issues in the CPU, storage, or GPUs which help understand where the performance issue may be originating.