DOCA BlueMan Service Guide
This guide provides instructions on how to use the DOCA BlueMan service on top of NVIDIA® BlueField® DPU.
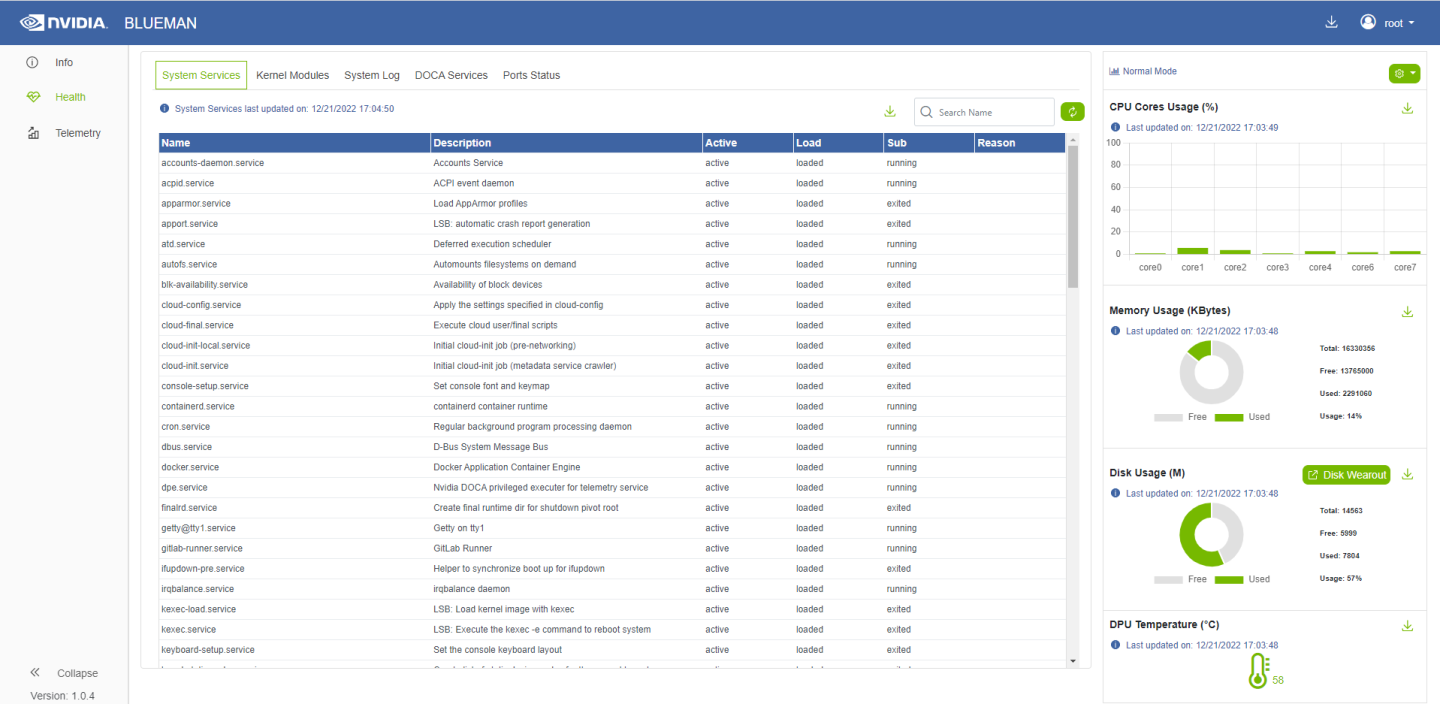
DOCA BlueMan runs in the DPU as a standalone web dashboard and consolidates all the basic information, health, and telemetry counters into a single interface.
All the information that BlueMan provides is gathered from the DOCA Telemetry Service (DTS), starting from DTS version 1.11.1-doca1.5.1.
BlueField image version 3.9.3.1 or higher
DTS and the DOCA Privileged Executer (DPE) daemon must be up and running
Verifying DTS Status
All the information that BlueMan provides is gathered from DTS .
Verify that the state of the DTS pod is ready:
$ crictl pods --name doca-telemetry-service
Verify that the state of the DTS container is running:
$ crictl ps --name doca-telemetry-service
Verifying DPE Status
All the information that DTS gathers for BlueMan is from the the DPE daemon .
Verify that the DPE daemon is active:
            $ systemctl is-active dpe.service
active
If the daemon is inactive, activate it by starting the dpe.service:
$ systemctl start dpe.service
For information about the deployment of DOCA containers on top of the BlueField DPU, refer to the NVIDIA DOCA Container Deployment Guide.
DOCA Service on NGC
BlueMan is available on NGC, NVIDIA's container catalog. Service-specific configuration steps and deployment instructions can be found under the service's container page.
Default Deployment – BlueField BSP
BlueMan
service is
located under
/opt/mellanox/doca/services/blueman
/.
The following is a list of the files under the BlueMan directory:
            doca_blueman_fe_service_<version>-doca<version>_arm64.tar
doca_blueman_conv_service_<version>-doca<version>_arm64.tar
doca_blueman_standalone.yaml
bring_up_doca_blueman_service.sh
Enabling BlueMan Service
Using Script
Run bring_up_doca_blueman_service.sh:
            $ chmod +x /opt/mellanox/doca/services/blueman/bring_up_doca_blueman_service.sh
$ /opt/mellanox/doca/services/blueman/bring_up_doca_blueman_service.sh
Manual Procedure
Import images to crictl images:
$
cd/opt/mellanox/doca/services/blueman/ $ ctr --namespace k8s.io imageimportdoca_blueman_fe_service_<version>-doca<version>_arm64.tar$ ctr --namespace k8s.io imageimportdoca_blueman_conv_service_<version>-doca<version>_arm64.tarVerify that the DPE daemon is active:
            $ systemctl is-active dpe.service
active
If the daemon is inactive, activate it by starting the
dpe.service:$ systemctl start dpe.service
Copy
blueman_standalone.yamlto/etc/kubelet.d/:$
cpdoca_blueman_standalone.yaml /etc/kubelet.d/
Verifying Deployment Success
Verify that the DPE daemon is active:
$ systemctl is-active dpe.service
Verify that the state of the DTS container is
running:$ crictl ps --name doca-telemetry-service
Verify that the state of the BlueMan service container is
running:$ crictl ps --name doca-blueman-fe $ crictl ps --name doca-blueman-conv
Configuration
The configuration of the BlueMan back end is located under /opt/mellanox/doca/services/telemetry/config/blueman_config.ini. Users can interact with the blueman_config.ini file which contains the default range values of the Pass, Warning, and Failed categories which are used in the health page. Changing these values gets reflected in the BlueMan webpage within 60 seconds.
Example of blueman_config.ini:
            ;Health Cpu usages Pass, warning, Failed
[Health:CPU_Usages:Pass]
range = 0,80
[Health:CPU_Usages:Warning]
range = 80,90
[Health:CPU_Usages:Failed]
range = 90,100
Info
General info – OS name, kernel, part number, serial number, DOCA version, driver, board ID, etc.
Installed packages – list of all installed packages on the DPU including their version
CPU info – vendor, cores, model, etc.
FW info – all the mlxconfig parameters with default/current/next boot data
DPU operation mode
Health
System service
Kernel modules
Dmesg
DOCA services
Port status of the PF and OOB
Core usage and processes running on each core
Memory usage
Disk usage
Temperature
Telemetry – all telemetry counters that come from DTS according to the enabled providers displayed on tables
Users have the ability to build graphs of specific counters
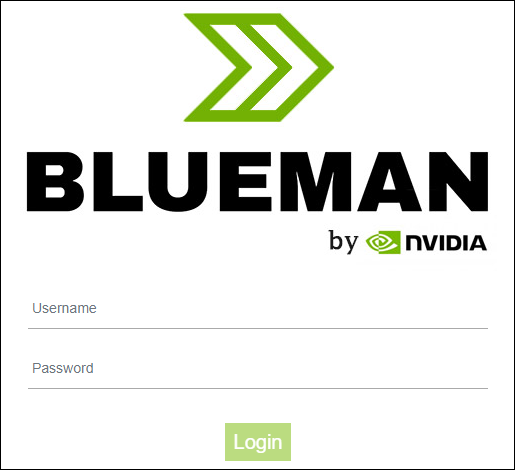
To log into BlueMan, enter the IP address of the DPU's OOB interface (http://<DPU_OOB_IP>) to a web browser located in the same network as the DPU
.
The login credentials to use are the same pair used for the SSH connection to the DPU.
For general troubleshooting, refer to the DOCA Troubleshooting.
For container-related troubleshooting, refer to the "Troubleshooting" section in the NVIDIA DOCA Container Deployment Guide.
The following are additional troubleshooting tips for DOCA BlueMan:
The following error message in the login page signifies a failure to connect to the DPE daemon: "The service is currently unavailable. Please check server up and running."
Restart the DPE daemon:
$ systemctl restart dpe.service
Verify that DTS is up and running by following the instructions in section "Verifying DTS Status".
If the message "Invalid Credentials" appears in the login page, v erify that the username and password are the same ones used to SSH to the DPU.
If all of the above is configured as expected and there is still some failure to log in, it is recommended to check if there are any firewall rules that block the connection.
For other issues, check the
/var/log/syslogand/var/log/doca/telemetry/blueman_service.loglog file.