Dynamo Benchmarking
This guide shows how to benchmark Dynamo deployments using AIPerf, a comprehensive tool for measuring generative AI inference performance. AIPerf provides detailed metrics, real-time dashboards, and automatic visualization — you call it directly against your endpoints.
You can benchmark any combination of:
- DynamoGraphDeployments
- External HTTP endpoints (vLLM, llm-d, AIBrix, etc.)
Choosing Your Benchmarking Approach
Client-side runs benchmarks on your local machine via port-forwarding. Server-side runs benchmarks directly within the Kubernetes cluster using internal service URLs.
TLDR: Need high performance/load testing? Server-side. Just quick testing/comparison? Client-side.
Use Client-Side Benchmarking When:
- You want to quickly test deployments
- You want immediate access to results on your local machine
- You’re comparing external services or deployments (not necessarily just Dynamo deployments)
- You need to run benchmarks from your laptop/workstation
→ Go to Client-Side Benchmarking (Local)
Use Server-Side Benchmarking When:
- You have a development environment with kubectl access
- You’re doing performance validation with high load/speed requirements
- You’re experiencing timeouts or performance issues with client-side benchmarking
- You want optimal network performance (no port-forwarding overhead)
- You’re running automated CI/CD pipelines
- You need isolated execution environments
- You want persistent result storage in the cluster
→ Go to Server-Side Benchmarking (In-Cluster)
Quick Comparison
AIPerf Overview
AIPerf is a standalone benchmarking tool available on PyPI. It is pre-installed in Dynamo container images. Key features:
- Measures latency, throughput, TTFT, inter-token latency, and more
- Multiple load modes: concurrency, request-rate, trace replay
- Automatic visualization with
aiperf plot(Pareto curves, time series, GPU telemetry) - Interactive dashboard mode for real-time exploration
- Arrival patterns (Poisson, constant, gamma) for realistic traffic simulation
- Warmup phases, gradual ramping, and multi-URL load balancing
Important: The --model parameter must match the model deployed at the endpoint.
For full documentation, see the AIPerf docs.
Client-Side Benchmarking (Local)
Client-side benchmarking runs on your local machine and connects to Kubernetes deployments via port-forwarding.
Prerequisites
-
Dynamo container environment - You must be running inside a Dynamo container with AIPerf pre-installed, or install it locally:
-
HTTP endpoints - Ensure you have HTTP endpoints available for benchmarking. These can be:
- DynamoGraphDeployments exposed via HTTP endpoints
- External services (vLLM, llm-d, AIBrix, etc.)
- Any HTTP endpoint serving OpenAI-compatible models
User Workflow
Step 1: Set Up Cluster and Deploy
Set up your Kubernetes cluster with NVIDIA GPUs and install the Dynamo Kubernetes Platform following the installation guide. Then deploy your DynamoGraphDeployments using the deployment documentation.
Step 2: Port-Forward and Run a Single Benchmark
Wait for model readiness. Before benchmarking, ensure your deployment has fully loaded the model. Check pod logs or hit the health endpoint (
curl http://localhost:8000/health) — it should return200 OKbefore you proceed.
This produces results in artifacts/ and prints a summary table to the console:
Actual numbers will vary based on model size, hardware, batch size, and network conditions. Client-side benchmarks include port-forwarding overhead — use server-side benchmarking for accurate performance measurement.
To stop the port-forward when done: kill %1 (or kill <PID>).
Step 3: Concurrency Sweep for Pareto Analysis
To understand how your deployment behaves across load levels, run a concurrency sweep. Each concurrency level sends enough requests for stable measurements (max(c*3, 10)):
Note: Adjust concurrency levels to match your deployment’s capacity. Very high concurrency on a small deployment (e.g., c250 on a single GPU) will cause server errors. Start with lower values and increase until you find the saturation point.
Step 4: [If Comparative] Benchmark a Second Deployment
Teardown deployment A and deploy deployment B with a different configuration. Kill the previous port-forward (kill %1), then repeat:
Step 5: Generate Visualizations
AIPerf automatically generates plots based on available data:
- TTFT vs Throughput — find the sweet spot between responsiveness and capacity (always generated for multi-run comparisons)
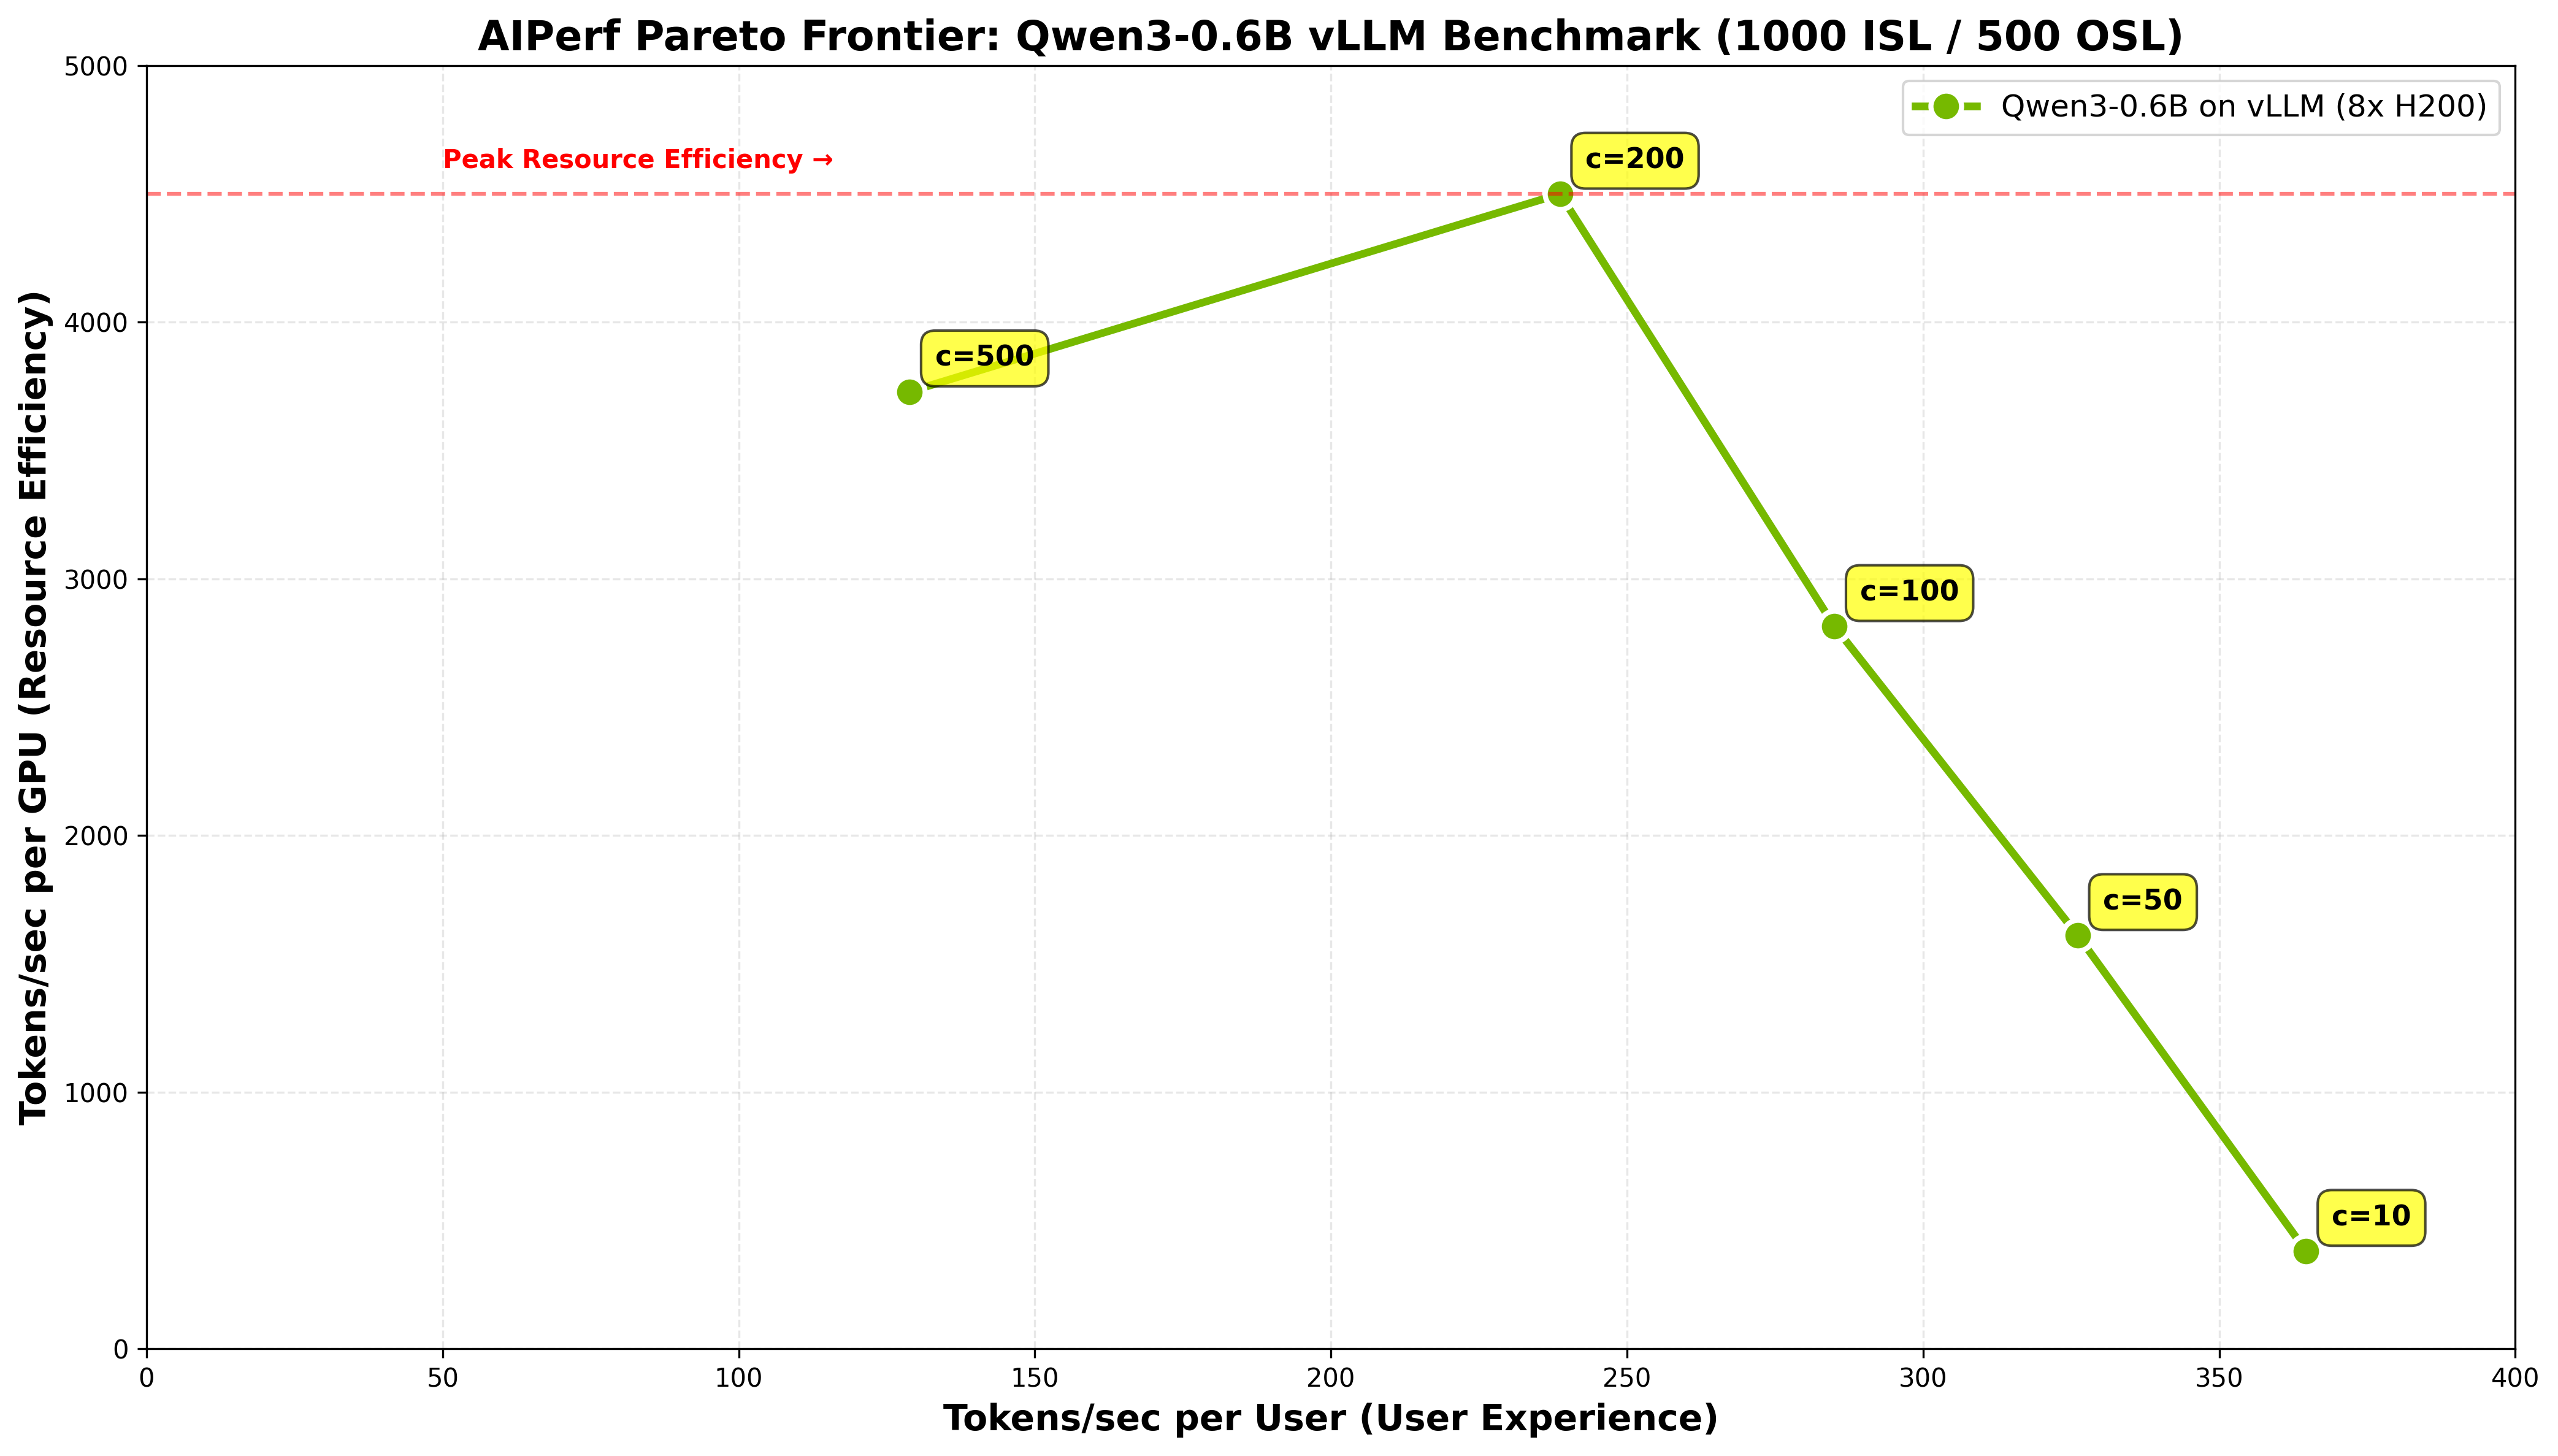
- Pareto Curves — throughput per GPU vs latency and interactivity (only generated when GPU telemetry data is available — add
--gpu-telemetryduring profiling if DCGM is running) - Time series — per-request TTFT, ITL, and latency over time (generated for single-run analysis)
Here is an example Pareto frontier from a concurrency sweep of Qwen3-0.6B on 8x H200 with vLLM, showing the tradeoff between user experience (tokens/sec per user) and resource efficiency (tokens/sec per GPU):
See the AIPerf Visualization Guide for full details on plot customization, experiment classification, and themes.
Use Cases
- Compare DynamoGraphDeployments (e.g., aggregated vs disaggregated configurations)
- Compare different backends (e.g., SGLang vs TensorRT-LLM vs vLLM)
- Compare Dynamo vs other platforms (e.g., Dynamo vs llm-d vs AIBrix)
- Compare different models (e.g., Llama-3-8B vs Llama-3-70B vs Qwen-3-0.6B)
- Compare different hardware configurations (e.g., H100 vs A100 vs H200)
- Compare different parallelization strategies (e.g., different GPU counts or memory configurations)
AIPerf Quick Reference
Commonly Used Options
For the complete CLI reference, see aiperf profile --help or the CLI docs.
Output Sequence Length
To enforce a specific output length, pass ignore_eos and min_tokens via --extra-inputs:
Understanding Results
Each aiperf profile run produces an artifact directory containing:
profile_export_aiperf.json— Structured metrics (latency, throughput, TTFT, ITL, etc.)profile_export.jsonl— Per-request raw dataprofile_export_aiperf.csv— CSV format metrics
Results are organized by the --artifact-dir you specify. For concurrency sweeps, a common pattern is:
Server-Side Benchmarking (In-Cluster)
Server-side benchmarking runs directly within the Kubernetes cluster, eliminating port-forwarding overhead and enabling high-load testing.
Prerequisites
- Kubernetes cluster with NVIDIA GPUs and Dynamo namespace setup (see Dynamo Kubernetes Platform docs)
- Storage: PersistentVolumeClaim configured with appropriate permissions (see deploy/utils README)
- Docker image containing AIPerf (Dynamo runtime images include it)
Quick Start
Step 1: Deploy Your DynamoGraphDeployment
Deploy using the deployment documentation. Ensure it has a frontend service exposed and the model is fully loaded before running benchmarks — check pod logs or verify the health endpoint returns 200 OK.
Step 2: Configure and Run Benchmark Job
First, edit benchmarks/incluster/benchmark_job.yaml to match your deployment:
- Model name: Update the
MODELvariable - Service URL: Update the
URLvariable (use<svc_name>.<namespace>.svc.cluster.local:portfor cross-namespace access) - Concurrency levels: Adjust the
for c in ...loop - Docker image: Update the
imagefield if needed
Then deploy:
Step 3: Retrieve Results
Step 4: Generate Plots
Cross-Namespace Service Access
When referencing services in other namespaces, use full Kubernetes DNS:
Monitoring and Debugging
Troubleshooting
- Service not found: Ensure your DynamoGraphDeployment frontend service is running
- PVC access: Check that
dynamo-pvcis properly configured and accessible - Image pull issues: Ensure the Docker image is accessible from the cluster
- Resource constraints: Adjust resource limits if the job is being evicted
Testing with Mocker Backend
For development and testing purposes, Dynamo provides a mocker backend that simulates LLM inference without requiring actual GPU resources. This is useful for:
- Testing deployments without expensive GPU infrastructure
- Developing and debugging router, planner, or frontend logic
- CI/CD pipelines that need to validate infrastructure without model execution
- Benchmarking framework validation to ensure your setup works before using real backends
The mocker backend mimics the API and behavior of real backends (SGLang, TensorRT-LLM, vLLM) but generates mock responses instead of running actual inference.
See the mocker directory for usage examples and configuration options.
Advanced AIPerf Features
AIPerf has many capabilities beyond basic profiling. Here are some particularly useful for Dynamo benchmarking:

