Planner Replay Benchmarking
This guide shows how to benchmark the Dynamo Planner against a recorded trace by running it inside the mock replay harness. Use it to compare agg vs disagg topologies, tune SLA targets, and study how deployment realities (engine startup time, worker counts) affect planner behavior — all without bringing up a live cluster.
For the general mechanics of trace replay (input format, arrival speedup, router modes, synthetic workloads), see Mocker Offline Trace Replay. This guide focuses on the --planner-config path.
1. Setup
Build
Build the Dynamo Python bindings so python -m dynamo.replay is available:
The --release flag is strongly recommended. Replay simulation is largely single-threaded and CPU-bound on the mocker engine core; a debug build can be 5–10× slower, which compounds across sweep runs.
Key Planner Config Knobs
Passed as JSON via --planner-config. Uses the same schema as the live planner. The fields most relevant to benchmarking:
Key Engine Arg Knobs
Passed as JSON via --extra-engine-args (agg) or --prefill-engine-args / --decode-engine-args (disagg). The replay harness uses the mocker engine, so “engine args” means the analytical perf model inputs:
Other fields follow the standard mocker engine protocol (see Mocker Offline Trace Replay).
2. Example: Agg vs Disagg On The Mooncake Agentic Trace
Download the trace:
Run agg (2 workers, TP=1):
Run disagg (1P1D, TP=1):
Each run prints the AIPerf summary table to stdout and writes an HTML diagnostics report to ./planner_reports/<report_filename>. For this trace with a long ISL and short OSL, agg is better than disagg, which gets slightly better ITL at the cost noticeably more GPU-hours.
3. Example: Cold-Start-Time Sweep
How sensitive is SLA attainment to engine startup time? Sweep startup_time from 0 to 300 seconds in 10-second steps and record TTFT/ITL/GPU-hours per run.
Each run emits the AIPerf metrics table (parse TTFT / ITL avg / p90) and its HTML report (grep GPU hours: <float>). Plotting those against startup_time gives:
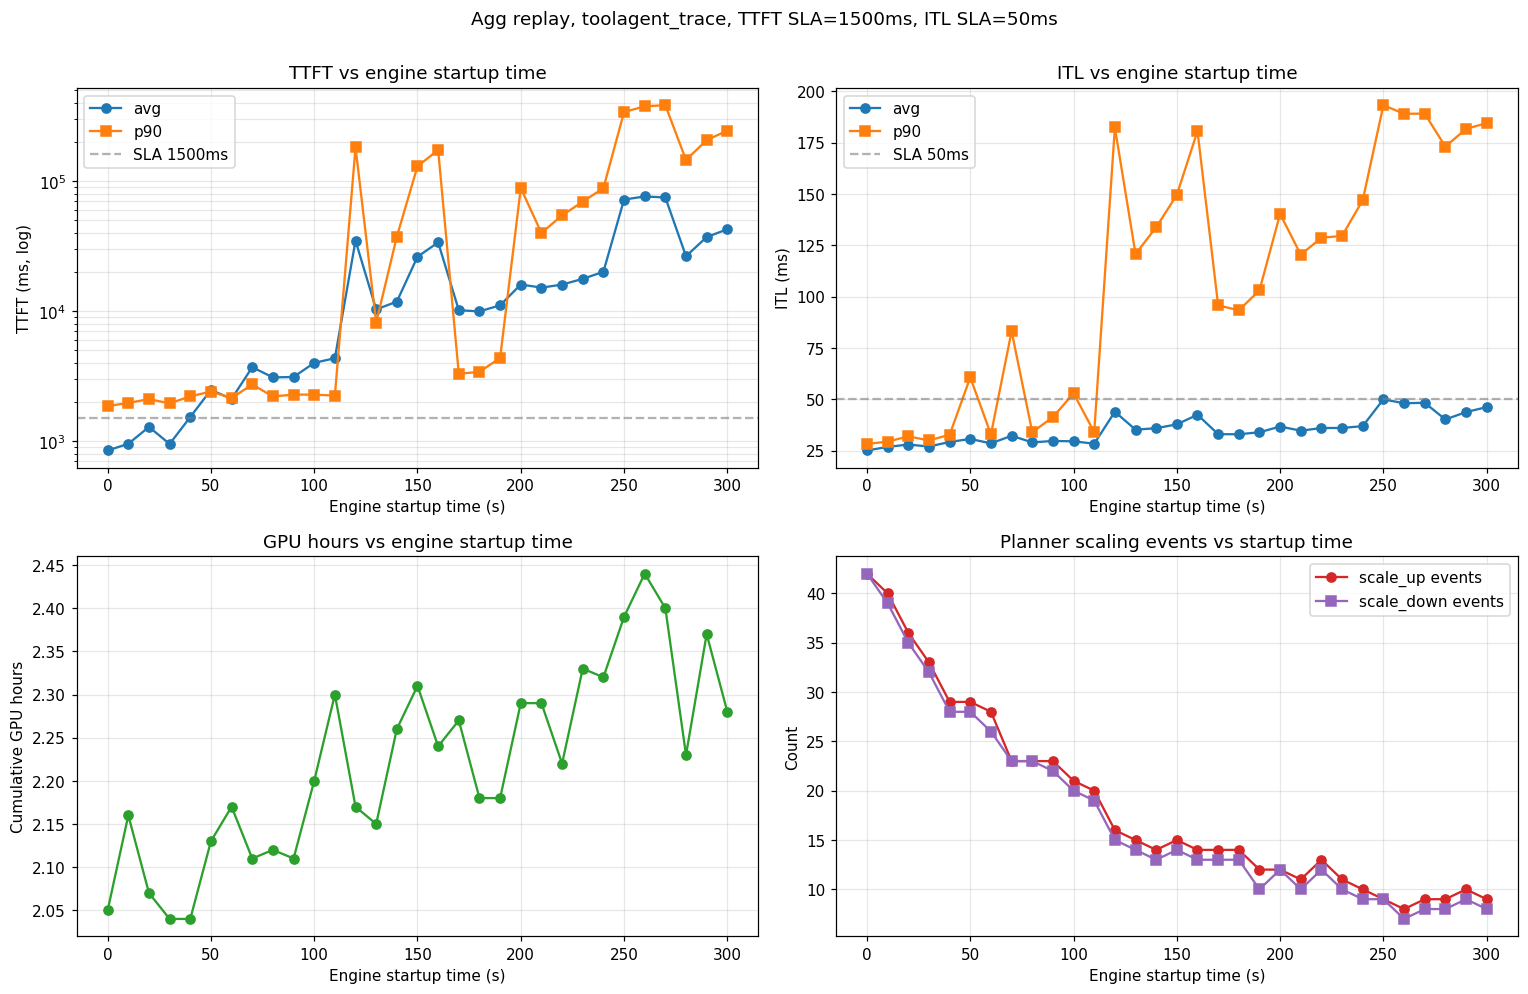
Observations from this sweep (agg, TTFT SLA 1,500 ms, ITL SLA 50 ms, H200-SXM, Llama-3.1-8B-FP8, TP=1):
- SLA cliff near 100–120 s. Below that, the planner scales up fast enough to hold TTFT; above it, p99 TTFT diverges and the system stays perpetually backlogged.
- Scaling-event count drops monotonically (42 → 8) as startup grows — long-startup runs require load planner to wait for stabilization before the next scaling decision.
- ITL is less sensitive than TTFT until the queue saturates. Below the cliff, ITL rises modestly (25 → 30 ms avg); above it, p90 ITL jumps to ~200 ms as decode requests starve.

