

RAG Ingestion Performance Benchmarking#
Benchmarking Methodology#
For ingestion performance the goal is to optimize the documents ingest rate measured as documents per second (dps) or pages per second (pps) depending on if page splitting is being used in the case of multimodal documents or full documents are ingested for text-only ingest.
For ingestions benchmarking on the NV-Ingest client side increase the document concurrent requests (CR):
CR= [16, 32, 64, 96, 128, 192, 256]
and then scale out server side services NV-Ingest along with Embedding and Extraction NIM microservices to support the higher concurrency.
This guide covers multiple methods to ingest enterprise data into Milvus Vector database based type of data and size of data however the focus is on Wiki Text Bulk Ingest with text-only data.
Basic validation for Multi-modal or Text data:
Ingestor-server (NV-Ingest) with Multimodal or Text-only PDF data - use RAG Ingestor server with NV-Ingest (backend) to ingest a small data set of 50-200 files of text or multimodal data. Parse PDF and extract content, embed and ingest the data.
Dataset: Shakespeare dataset => 44 text-only documents, 9K embeddings
Dataset: digital corpora (download bo20) => 20 multimodal PDFs, pages:1K, tables:300, charts:400, embeddings: 1.6K
Multimodal Ingestion Benchmarking:
NeMo Retriever Extraction (NV-Ingest) with Text-only PDF data - using NV-Ingest client to connect directly with NV-Ingest server to perform PDF extraction to extract tables, charts, images along with text data.
Dataset: digital corpora - bo767 => 767 PDFs; pages: 54,730; tables: 23,323; total_charts: 7835; elements: 85,888; embeddings: 76,868
Text-only Ingestion Benchmarking:
NeMo Retriever Extraction (NV-Ingest) with Text-only PDF data - using NV-Ingest client to connect directly with NV-Ingest server to perform PDF extraction to split pages and extract text data.
Dataset: digital corpora - bo767 => 767 PDFs; pages: 54,730, embeddings: 45,819
Wiki Bulk Text Ingest for large S3 parquet text-only data - using Python script to first parse parquet files in batches, then split text documents, tokenize, chunk then embed into batches. Store embeddings in MinIO object store bucket and then bulk ingest in 1GB segments (1K docs) directly into Milvus Vector DB.
Dataset: Wikipedia dataset (parquet files) => 5.9 M documents, up to 38M vector embeddings (chunk size 256/50, 2048dim X FP32)
Basic Validation - RAG Ingestor-server (NV-Ingest) Text-only Data Ingestion#
For ingesting small subset (<100 documents) of text-only or multi-modal data use RAG Ingestor server CLI (scripts) with NeMo Retriever (NV-Ingest) services to ingest different types of documents — PDF, PPT, word documents that include text, tables, charts and/or images.
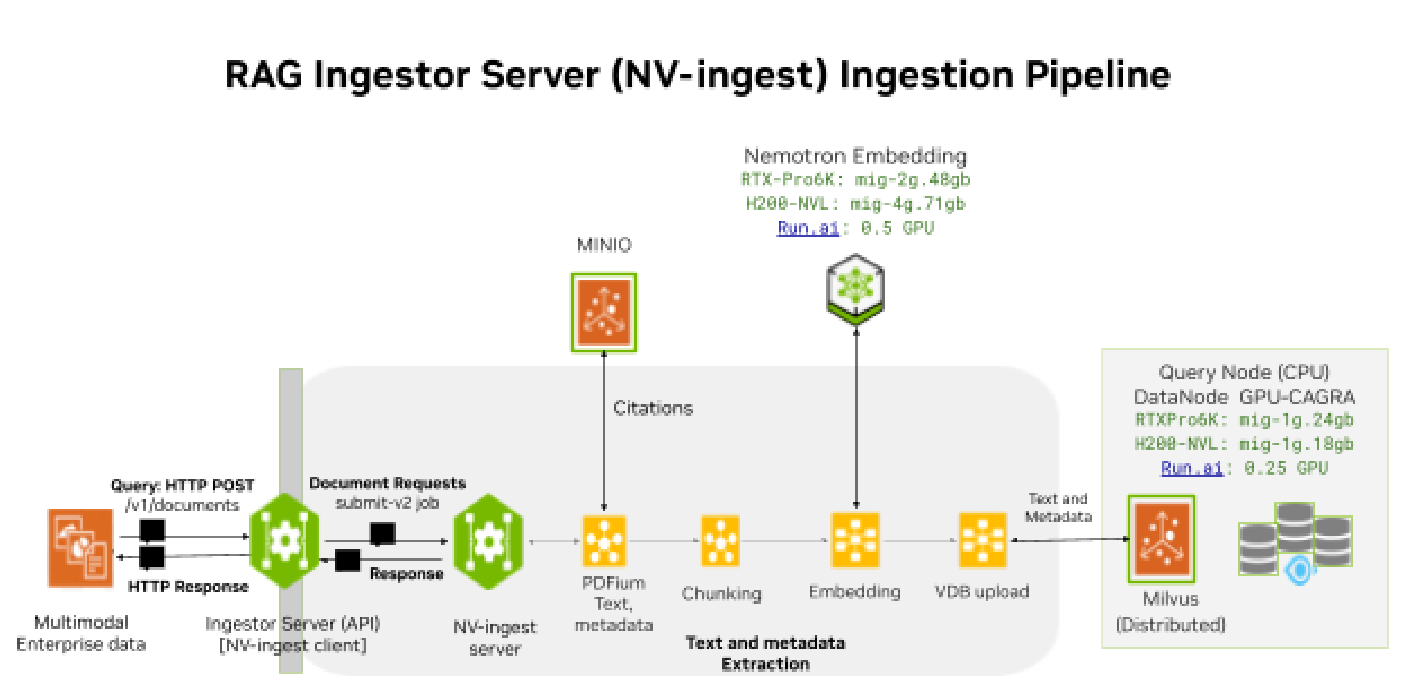
Figure 7 RAG Ingestion - NeMo Retriever Extraction (NV-Ingest) pipeline#
The Ingestor server processes document ingest requests (HTTP GET and POST to endpoint
/v1/documents) and sends responses (HTTP response Code 200/400/500) to the user when
ingestion is completed or failed.
Ingestor server provides API wrapper for the NV-Ingest client, handles collection management, stores multimodal citations in MINIO, sends requests and forwards results on document ingestion.
Dataset: Shakespeare dataset PDF/Text Text-only => 40 documents, 5.2K embeddings with (chunk 512/150).
Summary Analysis: here are the key findings from the results below:
Decreasing the Chunk Size from 512/150 to 256/50, increases the number of embeddings from 5.2K to 9.1K and increases the embed time by 15-30%
The vector DB bulk upload time for 5K vs 9K embeddings does not change significantly ~16-17s
Increasing the document concurrency from 1 to 20, decreases the Embed time by 90% up to a point. This depends on the number of NV-Ingest server workers available and CPU resources allocated.
Test |
Configuration |
Ingestion Results |
|---|---|---|
Ingestor server |
text depth: document |
Embed time: 64.81s |
text depth: document |
Embed time: 83.44s |
|
text depth: document |
Embed time: 7.02s |
|
text depth: document |
Embed time: 8.02s |
Multimodal - NeMo Retriever (NV-Ingest) Extraction NIM Microservices#
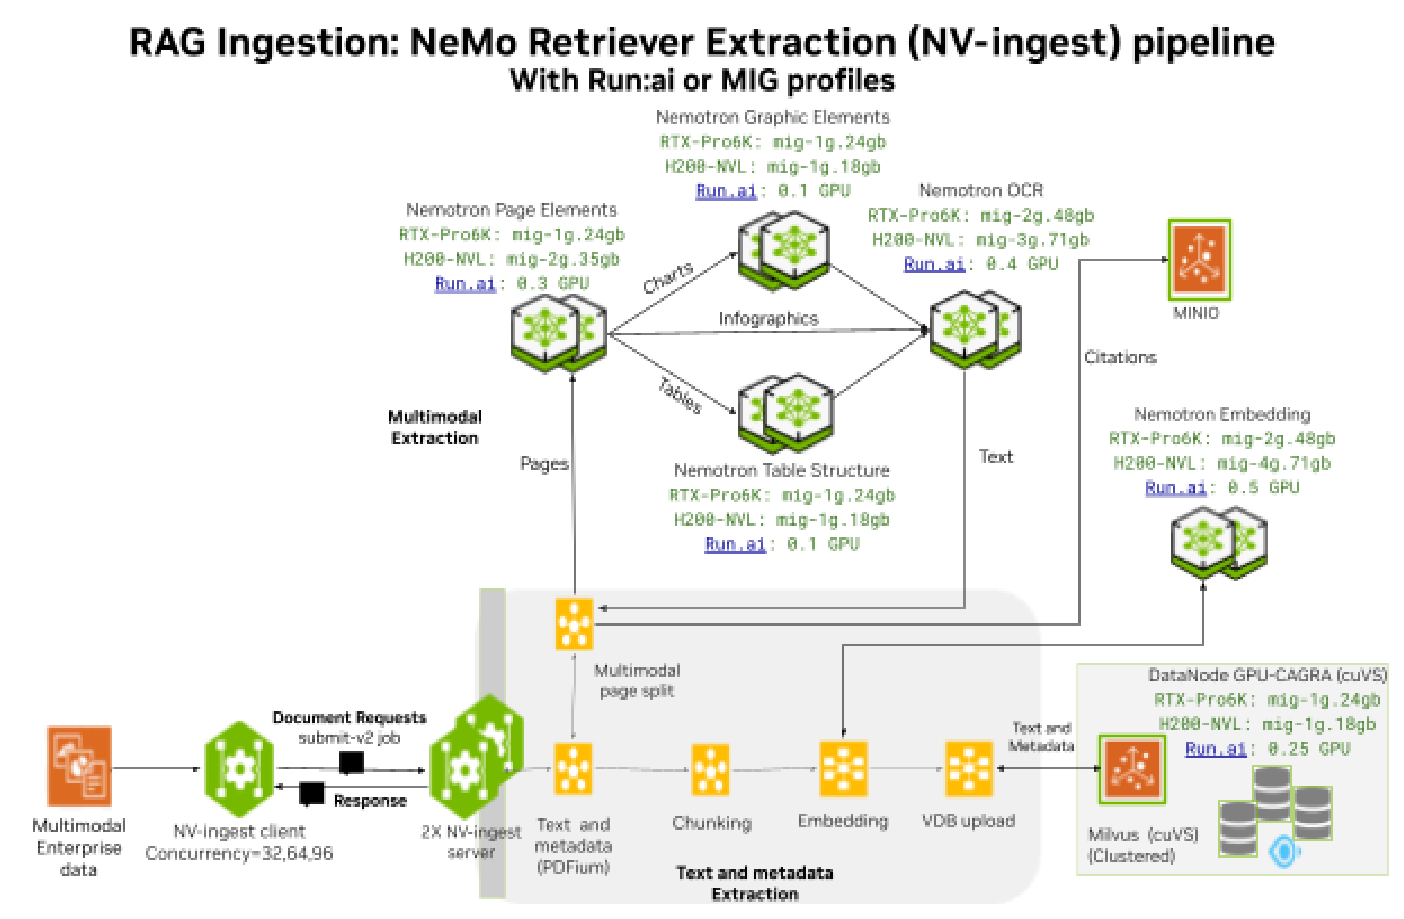
Figure 8 NV-Ingest Multi-modal Ingestion Pipeline#
Dataset: digital corpora (download bo767) => 767 PDFs; pages: 54,730; tables: 23,323; charts: 7835; elements: 85,888; vectors: 76,868.
For ingesting multi-modal data; use the NeMo Retriever (NV-Ingest) Client deployed on the benchmarking server with NV-Ingest server in the Kubernetes cluster.
For efficient GPU utilization, Embedding NIM microservices, Extraction NIM microservices and Milvus Data Node are deployed using Run:ai GPU fractions or using MIG profile for RTX PRO 6000 or H200 NVL.
Multimodal data ingest with NV-Ingest includes the same 3 tasks however Data Extraction gets more elaborate and requires deploying NV-Ingest NIM microservices:
Data Extraction [85% of time] - extract all the multimodal data (tables, charts, images) and convert them into text, Tokenize and Chunk.
Embedding [10% of time] - create vector embeddings.
Vector DB ingestion [~5% of time] - Build Index, Ingest and Store (Write).
For multimodal data the PDF extraction is done using pdfium using paged chunking TEXTDEPTH: page for better accuracy. Each page text, table, chart or image creates a vector embedding. Datasets that have tables spanning multiple pages will have tables split into multiple chunks this could affect accuracy.
Set up the benchmarking test to scale Concurrency CR = [16, 32, 48, 64, 96, 128,192, 256] and Batch Size = [32, 63, 96, 128, 192, 256, 192, 256] accordingly.
Use metrics to gauge NV-Ingest CPU and Embedding NIM GPU utilization. Scale out NV-Ingest and Embedding NIM when average CPU or GPU utilization >70-80%.
Scaling Multimodal Ingestion#
Multimodal data extraction is very CPU intensive and accounts for >60% of the end-to-end (E2E) ingestion time. It can take hours when ingesting >100K enterprise documents at a time with 20 or more multimodal elements (tables, charts, images) per document. Offloading critical table, chart, image captioning pieces to the NeMo Retriever Extraction NIM microservices using GPUs can accelerate ingestion and reduce E2E ingestion time by 50% or higher.
Multimodal data extraction is a spiky workload; GPU utilization spikes with load varying from 0% to 100% in a short time interval. Spiky workloads are ideal for GPU sharing, especially time slicing using the Run:ai scheduler. If strict isolation with hardware partitioning is needed for security reasons then use Multi-Instance GPU (MIG). Spiky workloads can benefit from parallelization with high concurrency; multiple active requests for document extraction.
The Embedding NIM, Extraction NIM microservices and Milvus data nodes can be deployed using either MIG profiles or Run:ai GPU fractions to enable efficient use of GPU resources, as shown in the Enterprise RAG Deployment Guide.
Run:ai enables deploying Helm charts directly onto a Run:ai project in a Run:ai enabled namespace. It provides flexibility to allocate GPU fractions (both compute and memory) for each NIM based on type data being ingested; table heavy vs image heavy. Run:ai has a custom Kubernetes scheduler that provides enterprise ready features to manage workload priorities, set policies to allocate or preempt resources and ensure fairshare balancing of excess resources.
Run:ai: 1.75 GPU instead of 6 GPUs
Run:ai offers optimized GPU efficiency and flexibility to customize the GPU fraction for each NIM based on the load and type of elements (text, tables, charts, images) being ingested. For typical enterprise data which tends to be more table heavy with some charts and very few images, the GPU fractions shown in the table below provides a great example to fit all 4 Extraction NIM microservices on a single GPU.
MIG: 2 GPUs instead of 6 GPUs
If security is a priority with strict isolation then use MIG with profile recommendations shown in the table below.
NV-Ingest Multimodal Baseline Scale1X |
Run:ai GPU fraction |
MIG RTX PRO 6000 |
MIG H200 NVL |
CPU/Mem |
|---|---|---|---|---|
1 NV-Ingest - 32 Workers |
NA |
NA |
NA |
16 vCPU, 32 GiB |
1 Embed — llama-nemotron-embed-1b-v2 |
0.5 GPU |
mig-2g.48gb |
mig-4g.71gb |
1 vCPU, 8 GiB |
1 OCR — nemotorn-ocr-v1 |
0.4 GPU |
mig-2g.48gb |
mig-3g.71gb |
3 vCPU, 4 GiB |
1 page-elements — nemotron-page-elements-v3 |
0.3 GPU |
mig-1g.24gb |
mig-2g.35gb |
1 vCPU, 2 GiB |
1 table-structure — nemotron-table-structure-v1 |
0.2 GPU |
mig-1g.24gb |
mig-1g.18gb |
0.5 vCPU, 3.5 GiB |
1 graphic-elements — nemotron-graphic-elements-v1 |
0.1 GPU |
mig-1g.24gb |
mig-1g.18gb |
0.25 vCPU, 3 GiB |
Milvus 1 Data node |
0.25 GPU |
mig-1g.24gb |
mig-1g.18gb |
16 vCPU, 32 GiB |
Milvus 1 Query node |
NA |
NA |
NA |
16 vCPU, 40 GiB |
When Scaling out Extraction and Embedding NIM microservices, rollout all NV-Ingest pods (in order to reset NV-Ingest gRPC connections):
kubectl scale deploy llama-nemotron-embed-1b-v2 --replicas=4

kubectl scale deploy nvingest-NV-Ingest --replicas=4

kubectl rollout restart deployment nvingest-NV-Ingest
NV-Ingest Scale 1X#
Consider Run:ai deployment with Scale 1X - 1 NV-Ingest with 1 GPU allocation for NeMo Retriever Extraction NIM microservices; 1 X OPTG: 1 OCR (40% GPU), 1 page-elements (30% GPU), 1 table-structure (20% GPU), 1 graphic-elements (10% GPU);
1 Embed (50% GPU) + 1 VDB Milvus (25% GPU) Total: 1.75 GPU.
Test configuration: 1X NV-Ingest Workers: 32, Concurrency (CR): 16, Batch Size(BS): 32.
Dataset: digital corpora (download bo767) => 767 PDFs; 77K embeddings (pages: 54,730; tables: 23,323; total_charts: 7835; elements: 85,888).
The chart below showcases GPU utilization for Extraction NIM microservices with GPU spikes from 0% to 90% for each of the 4 NIM microservices.
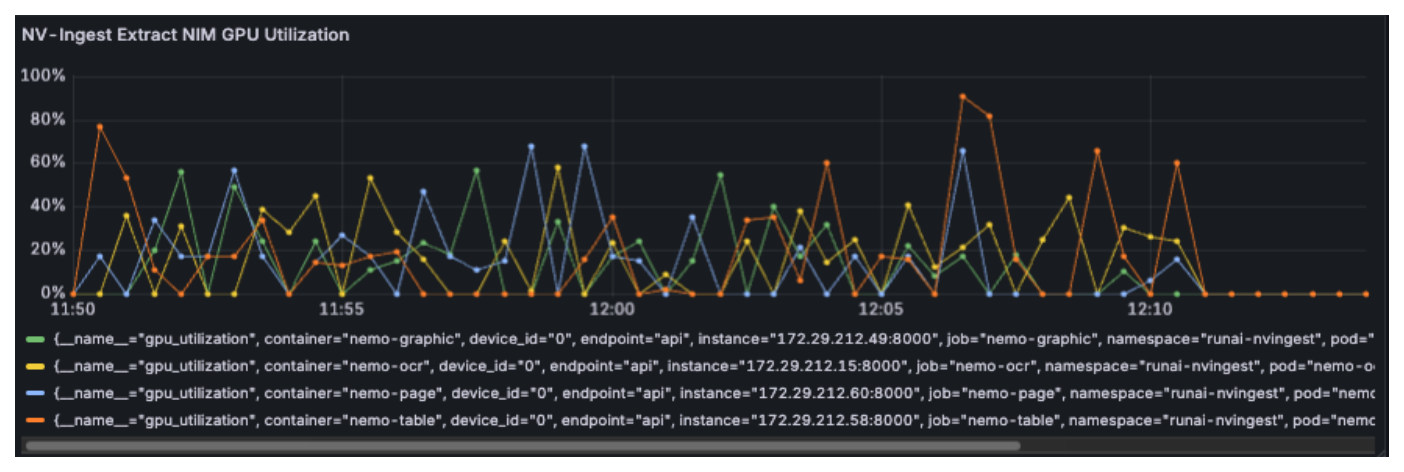
Figure 9 Run:ai GPU utilization for the Extraction NIM microservices - 1 GPU allocated: 1 X OPTG: 1 OCR (40%), 1 page-elements (30%), 1 table-structure (20%), 1 graphic-elements (10%). Run:ai GPU load is spiky and underutilized, average GPU utilization for the test duration is 37% and peaks to 97%.#
Run:ai GPU utilization (1 GPU): Mean:32% Peak:97%
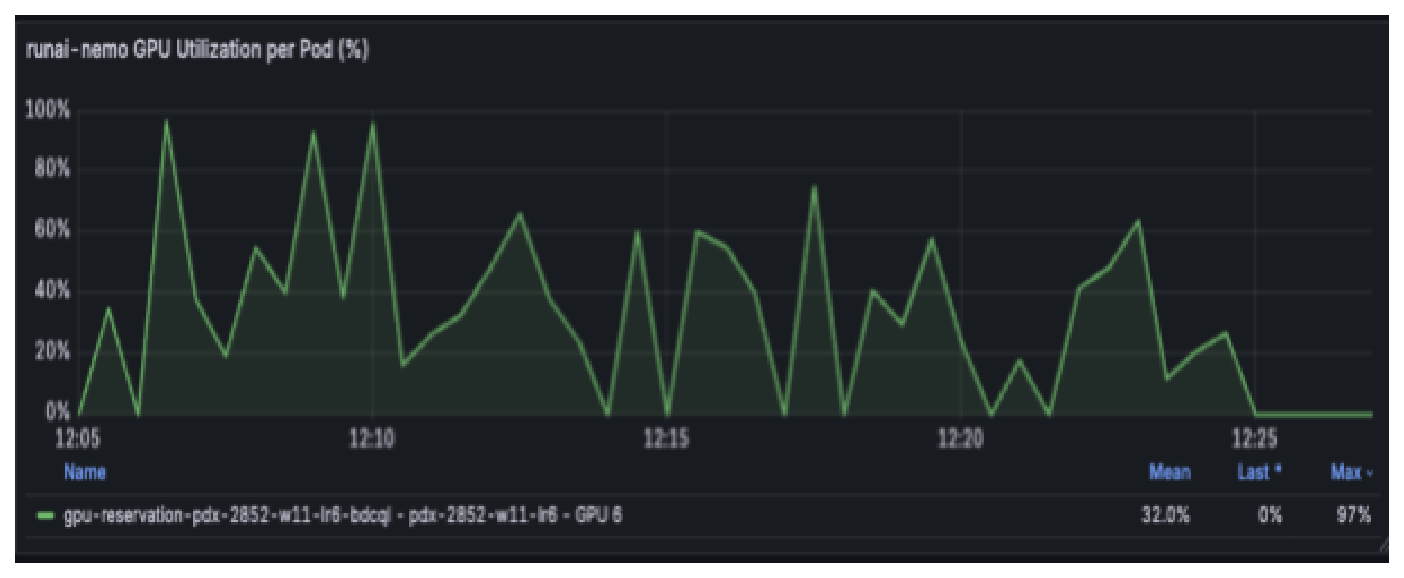
Figure 10 Run:ai GPU Utilization per Pod (%) for the Embed NIM microservice at Scale 1X (NV1-E1-1OPTG-VDB1). Mean GPU utilization: 32.0%, Peak: 97%.#
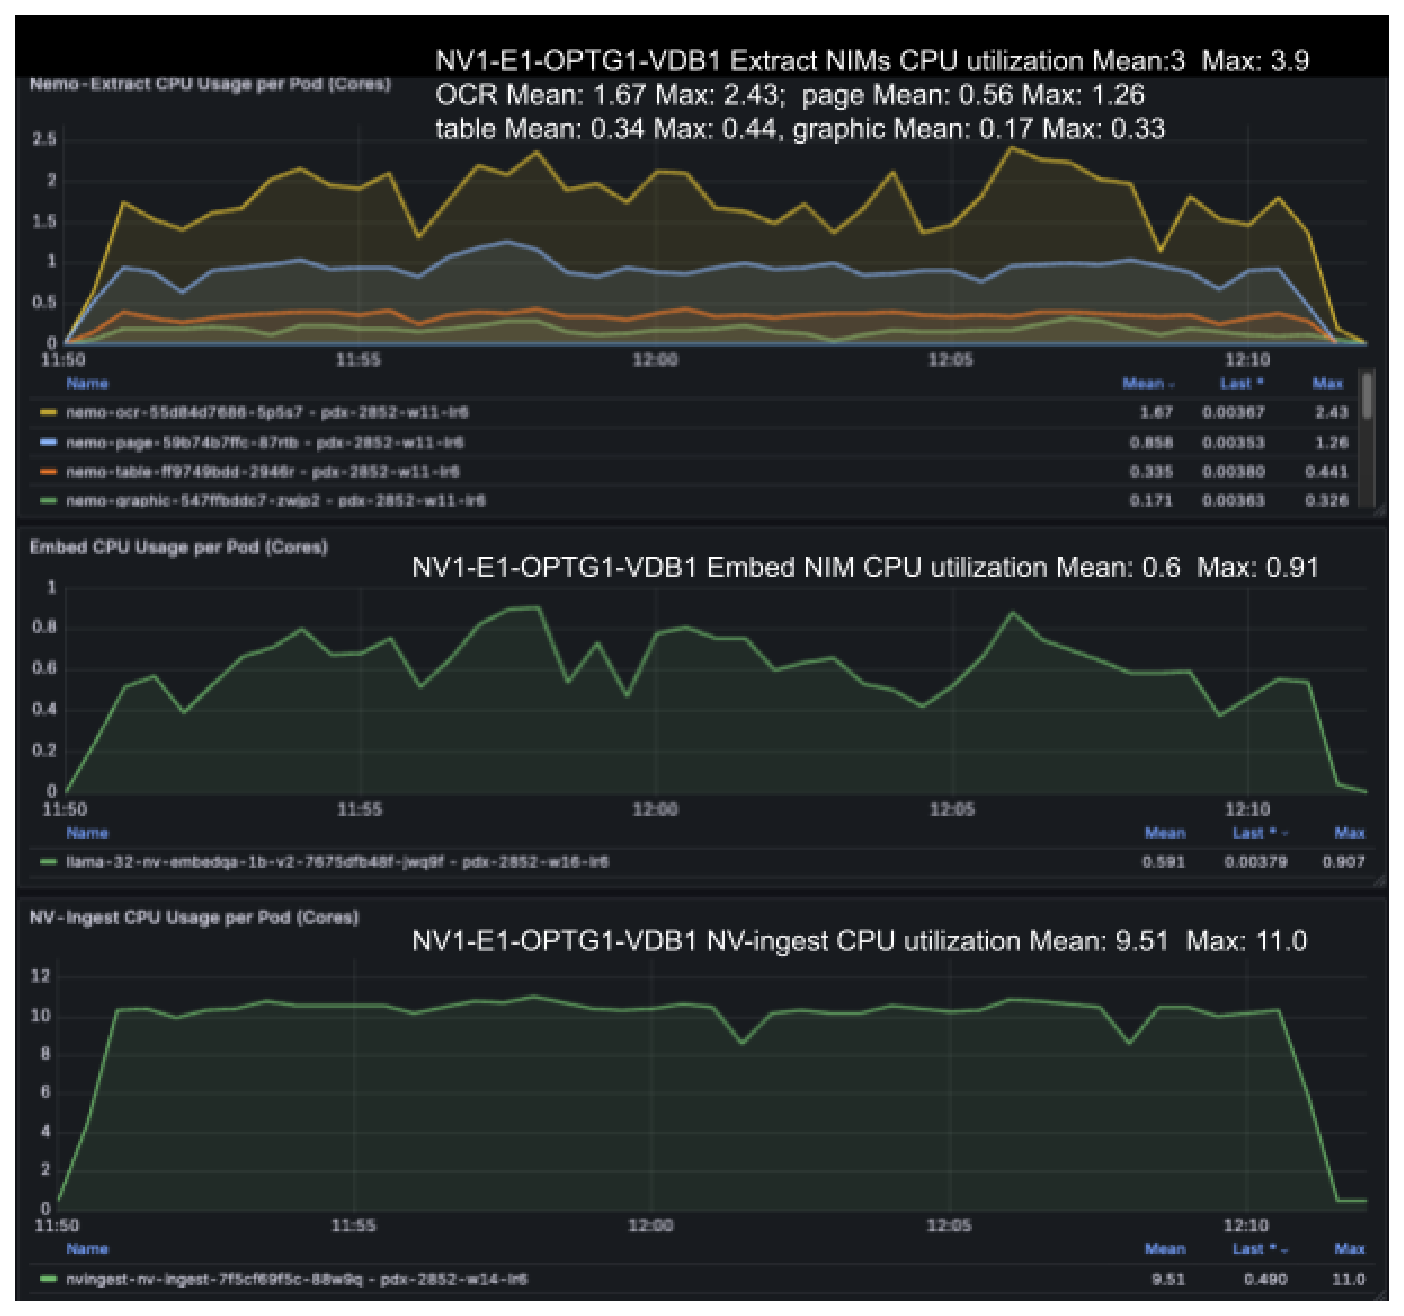
Figure 11 CPU utilization per pod for NV-Ingest Scale 1X (NV1-E1-OPTG1-VDB1): Extract NIMs CPU Mean: 3, Max: 3.9; Embed NIM CPU Mean: 0.6, Max: 0.91; NV-Ingest CPU Mean: 9.51, Max: 11.0.#
From the CPU utilization chart above, NV-Ingest CPU utilization has peaked (average 9.51 vCPU and peak 11 vCPU) and needs to be scaled out. Embedding and Extraction NIM microservices still have GPU and CPU capacity.
Scale 1X Ingestion Results
The chart below shows Embed requests rate (RPS) for NV-Ingest Scale 1X, 1X Embedding (0.5 GPU) and 1 OPTG Extraction NIM microservices (1 GPU) to extract and embed the bo767 dataset. This is followed by vector DB bulk upload of 77K embeddings to Milvus data node (0.25 GPU) for indexing, storing and loading vectors.
Test configuration: 1X NV-Ingest Workers: 32, Concurrency (CR): 16, Batch Size(BS): 32.
Dataset: bo767 => 767 PDFs; 77K embeddings (pages: 54,730; tables: 23,323; total_charts: 7835; elements: 85,888).
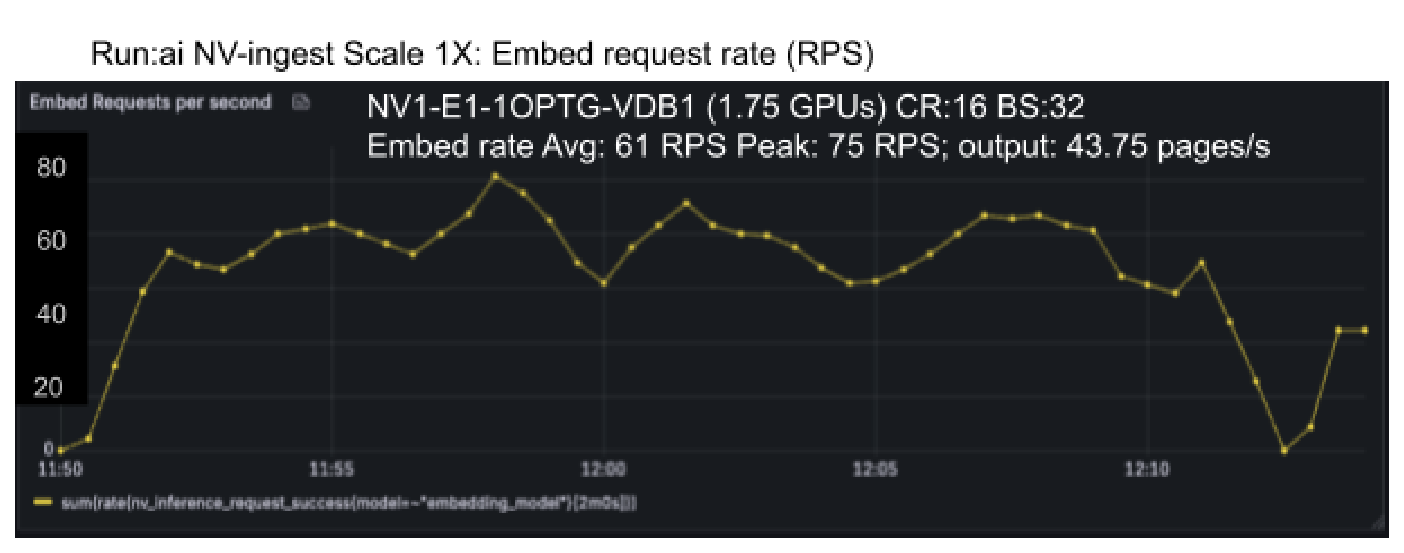
Figure 12 Embed requests rate (RPS) for NV-Ingest Scale 1X, 1X Embedding (0.5 GPU) and 1 OPTG Extraction NIM microservices (1 GPU) at Concurrency (CR): 16, Batch Size (BS): 32. Embed request rate: 61 RPS with Peak: 75 RPS.#
Scale 1X output results:
E2E Embed time (including extraction):  1251.14s => 20.85min
Vector DB ingest time: 117.27 => 1.95 min
E2E ingest times: 1368.41s => 22.81 min

Embed request rate: 61 RPS with Peak: 75 RPS
Embed rate: 43 PPS, 0.61 docs/s
E2E Ingest rate: 40 PPS, 0.56 docs/s
The Embed time and rate will vary with the NV-Ingest and NIM scale and CPU and GPU resources allocated. The Vector DB ingest time remains fairly constant (100s-120s) since the number of vectors being ingested (77K) is not very large and fits in a single 1GB upload segment. For this dataset the Milvus data node is not being scaled out either.
NV-Ingest Scale 2X#
Increase the Concurrency CR:32 and scale NV-Ingest: 2X NV-Ingest.
Run:ai Scale 2X - 2 NV-Ingest with 1 GPU allocation for NeMo Retriever Extraction NIM microservices; 1 X OPTG (1 GPU) [1 OCR (40%), 1 page-elements (30%), 1 table-structure (20%), 1 graphic-elements (10%)] + 1 Embed (50%) + 1 VDB Milvus (25%) Total: 1.75 GPU.
Test configuration: 2X NV-Ingest Workers: 32, Concurrency (CR): 32, Batch Size(BS): 64.
The chart below showcases higher GPU utilization for 4 Extraction NIM microservices.
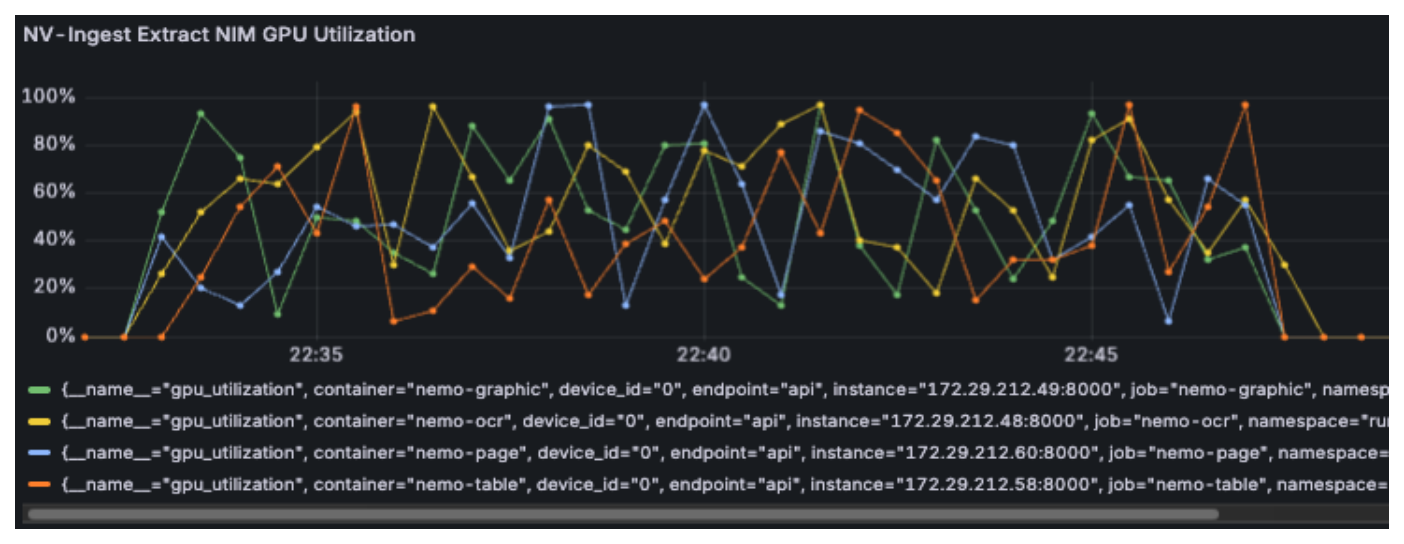
Figure 13 Run:ai GPU utilization for 4 Extraction NIM microservices at Scale 2X. At Scale 2X Run:ai GPU load shows higher utilization, average GPU utilization for the test duration is 56.5% and peaks to 98%.#
Run:ai GPU utilization for 4 Extraction NIM microservices (1 GPU): Mean:56.5% Peak:98%
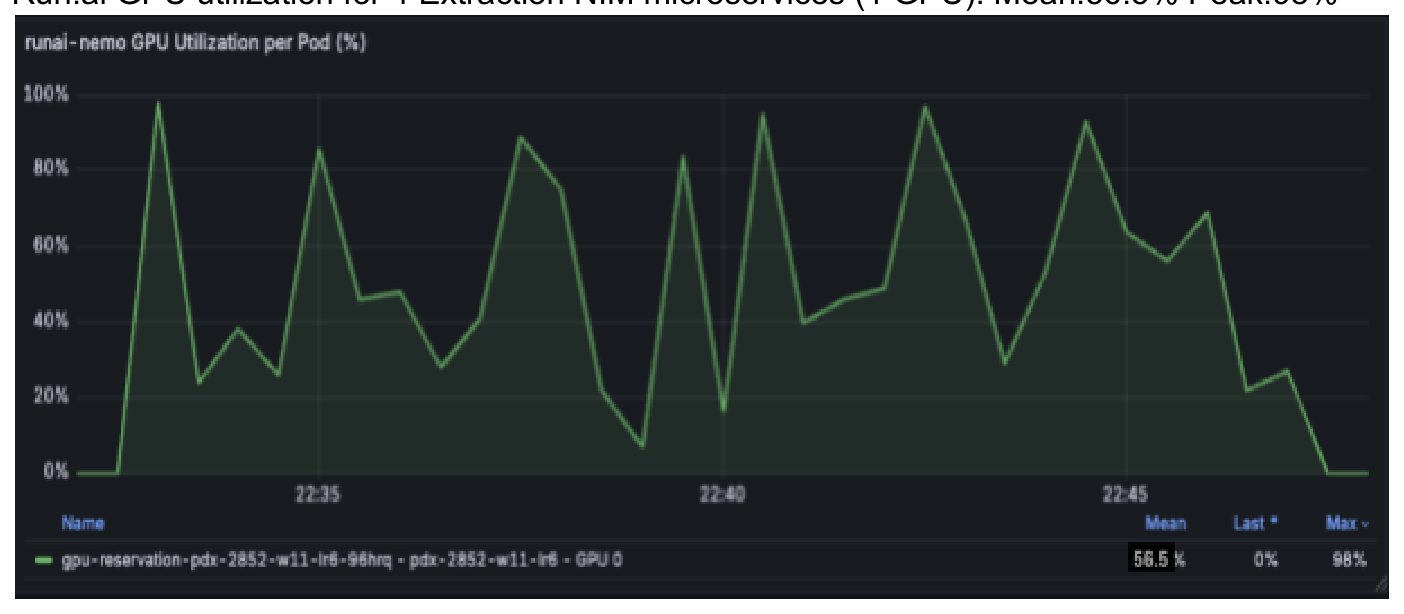
Figure 14 Run:ai GPU Utilization per Pod (%) for the Embed NIM microservice at Scale 2X (NV2-E1-1OPTG-VDB1). Mean GPU utilization: 56.5%, Peak: 98%.#
At Scale 2X the CPU utilization chart below shows the Extraction NIM microservices (OCR, page-elements, table-structure, graphic-elements) reaching peak CPU capacity but there is 40% spare GPU capacity.
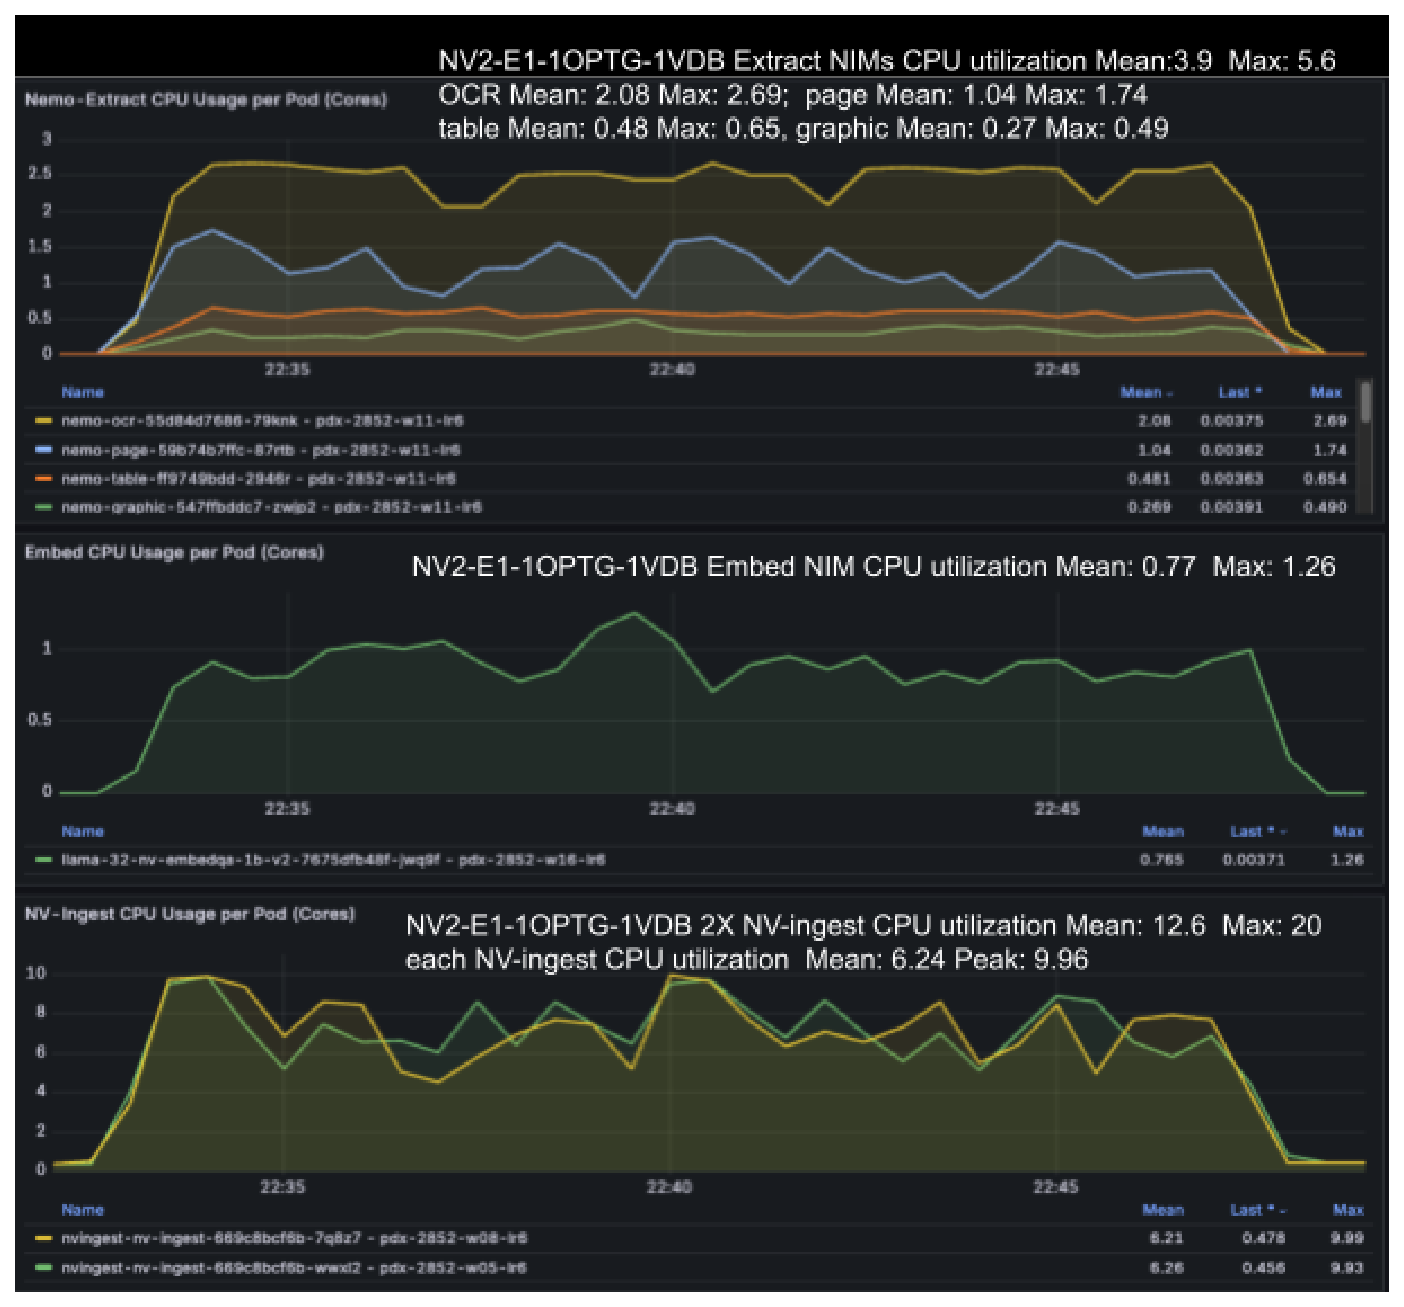
Figure 15 CPU utilization per pod for NV-Ingest Scale 2X (NV2-E1-1OPTG-1VDB): Extract NIMs, Embed NIM, and NV-Ingest CPU utilization showing Extraction NIM microservices reaching peak CPU capacity.#
To improve efficiency, add more CPU capacity to NIM microservices; increase resource
requests/limits and increase NIM multithreading (OMP_NUM_THREADS>1) used to parallelize
code, where a master thread forks multiple slave threads to execute tasks simultaneously
across allocated CPU cores. Creating too many threads can lead to high management
overhead (high CPU utilization), decreasing efficiency.
Another option is to use strong scaling, reduce the Run:ai GPU fractions allocated to the Embed and Extraction NIM microservices by 50%. Allocate only 1 GPU instead of 1.75 GPU where 1 X OPTG (0.5 GPU) [1 OCR (20%), 1 page-elements (15%), 1 table-structure (10%), 1 graphic-elements (5%)]; + 0.5 Embed (25%) + 1 VDB Milvus (25%) Total: 1 GPU.
With Extraction NIM microservices if there is insufficient GPU capacity then workload is partly pushed into the CPU. This increases NIM CPU utilization and can result in more long tail latencies, longer Embed times, poorer performance and reduced efficiency.
Scale 2X Ingestion Results
The chart below shows Embed requests rate (RPS) for NV-ingest Scale 2X, 1 Embedding (0.5 GPU) and 1 OPTG Extraction NIM microservices (1 GPU) to extract and embed the bo767 dataset. This is followed by vector DB bulk upload of 77K embeddings to Milvus data node (0.25 GPU) for indexing, storing and loading vectors.
Test configuration: 2X NV-Ingest Workers: 32, Concurrency (CR): 32, Batch Size(BS): 64.
Dataset: bo767 => 767 PDFs; 77K embeddings (pages: 55K; tables: 23K; total_charts: 8K; elements: 86K).
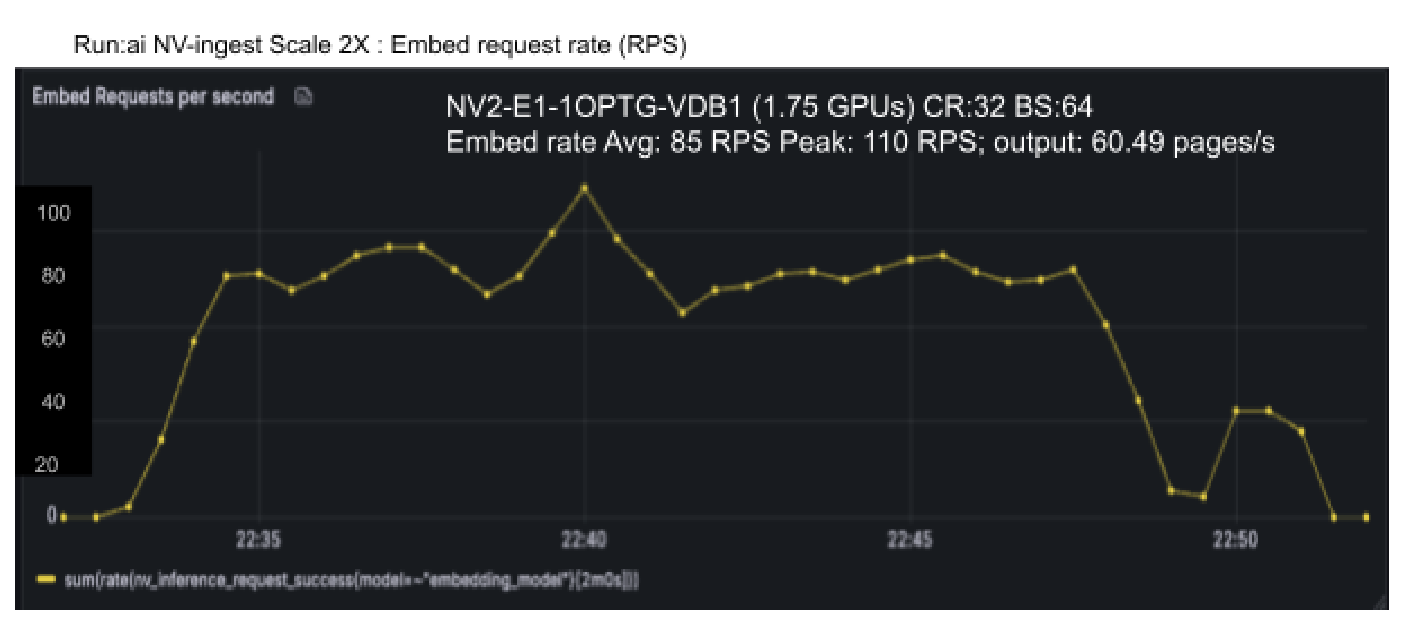
Figure 16 Embed requests rate (RPS) for NV-Ingest Scale 2X, 1 Embedding (0.5 GPU) and 1 OPTG Extraction NIM microservices (1 GPU). Embed request rate: 85 RPS with Peak: 110 RPS.#
Scale 2X output results:
E2E Embed time (including extraction):  904.78s => 15.08min
Vector DB ingest time: 105.92 => 1.77 min
E2E ingest times: 1010.7s => 16.85 min

Embed request rate: 85 RPS with Peak: 110 RPS
Embed rate: 60.49 PPS, 0.85 docs/s
E2E Ingest rate: 54.15 PPS, 0.76 docs/s
NV-Ingest Scale 4X#
Run:ai Scale 4X - 4 NV-Ingest with 2 GPUs allocated for NeMo Retriever Extraction NIM microservices:
2 X OPTG (2 GPU) [2 X OCR (40%), 2 X page-elements (30%), 2 X table-structure (20%), 2 X graphic-elements (10%)];
2 X Embed (50%) + 1 VDB Milvus (25%) Total: 3.25 GPU.
Test configuration: 2X NV-Ingest Workers: 32, Concurrency (CR): 32, Batch Size(BS): 64.
The chart below showcases higher GPU utilization for 8 Extraction NIM microservices.
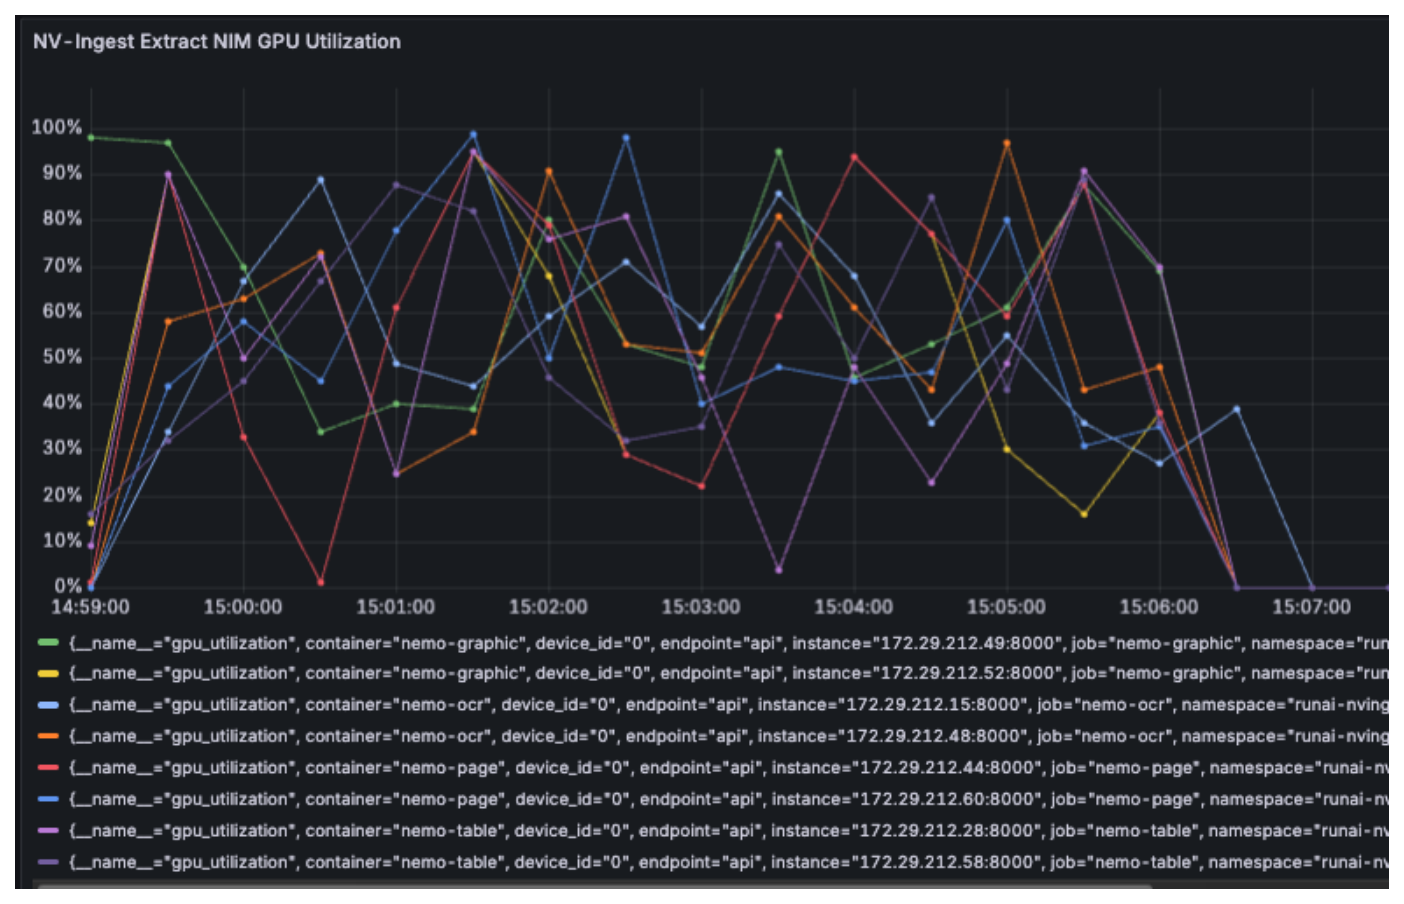
Figure 17 Run:ai GPU utilization for 8 Extraction NIM microservices at Scale 4X. At Scale 4X Run:ai GPU load shows high utilization, average GPU utilization for the test duration is 56% and peaks to 96%.#
Run:ai GPU utilization for 8 Extraction NIM microservices (2 GPUs): Mean:56% Peak:96%
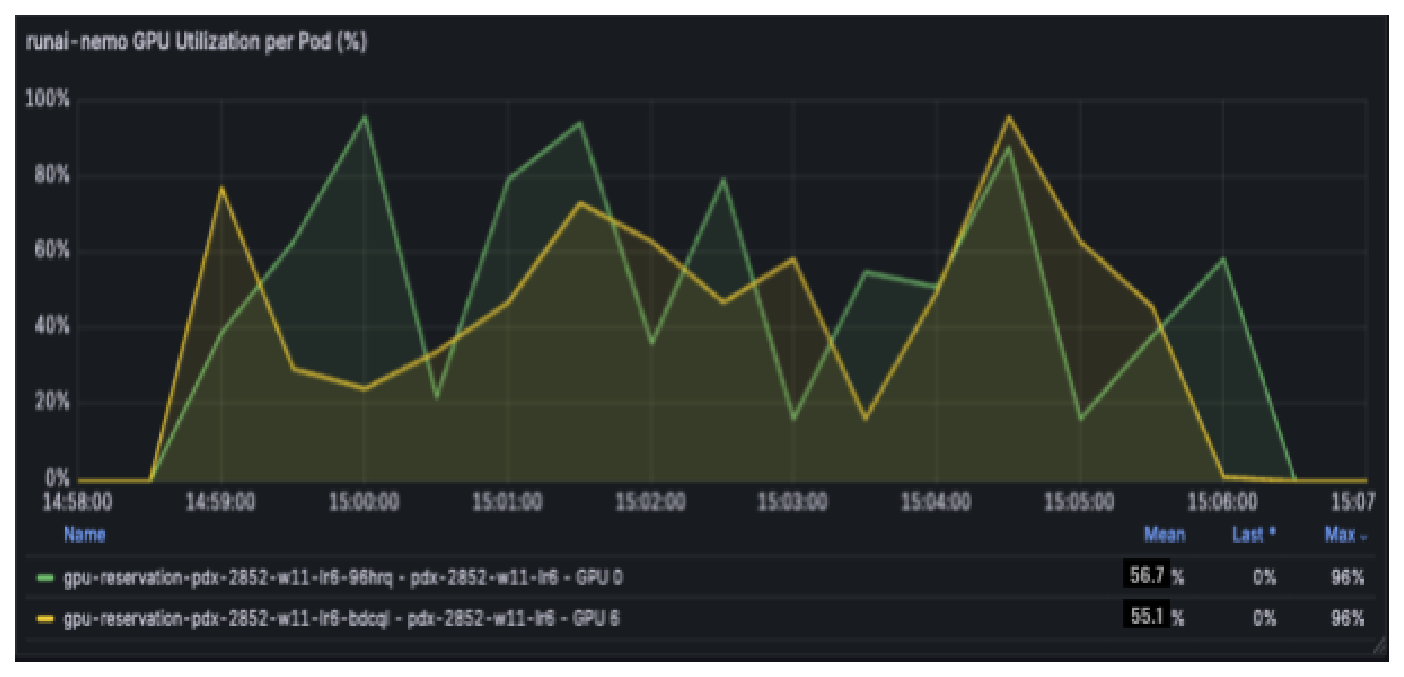
Figure 18 Run:ai GPU Utilization per Pod (%) for the 2 Embed NIM microservice pods at Scale 4X (NV4-E2-2OPTG-1VDB). Average GPU utilization ~56%.#
At Scale 4X the CPU utilization chart below shows the Extraction NIM microservices (OCR, page-elements, table-structure, graphic-elements) reaching peak CPU capacity.
Scale 4X Ingestion Results
The chart below shows Embed request rate (RPS) or embeddings per second (embed/s) for NV-ingest Scale 4X, 2 Embedding (1 GPU) and O2PTG Extraction NIM microservices (1 GPU) to extract and embed the bo767 dataset. This is followed by vector DB bulk upload of 77K embeddings to Milvus data node (0.25 GPU) for indexing, storing and loading vectors.
Test configuration: 2X NV-Ingest Workers: 32, Concurrency (CR): 32, Batch Size(BS): 64.
Dataset: bo767 => 767 PDFs; 77K embeddings (pages: 55K; tables: 23K; total_charts: 8K; elements: 86K).
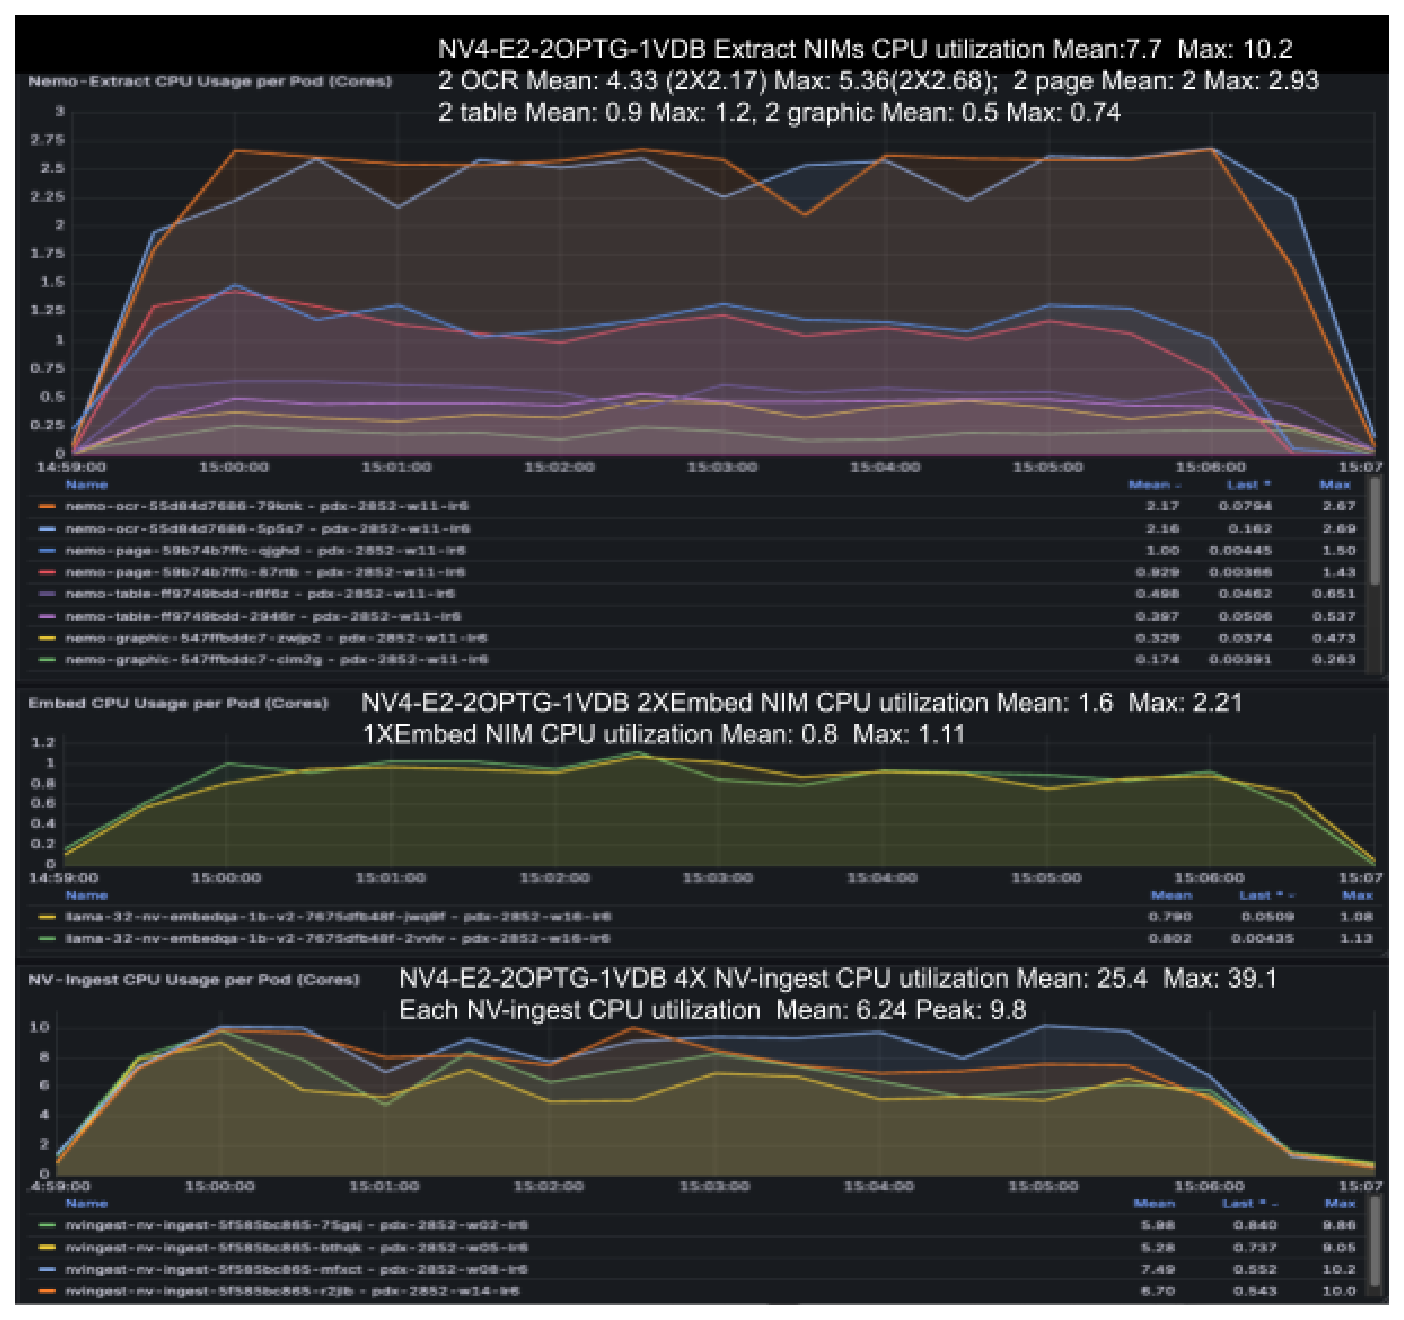
Figure 19 CPU utilization per pod for NV-Ingest Scale 4X (NV4-E2-2OPTG-1VDB): Extract NIMs, Embed NIM, and NV-Ingest CPU utilization showing Extraction NIM microservices reaching peak CPU capacity.#
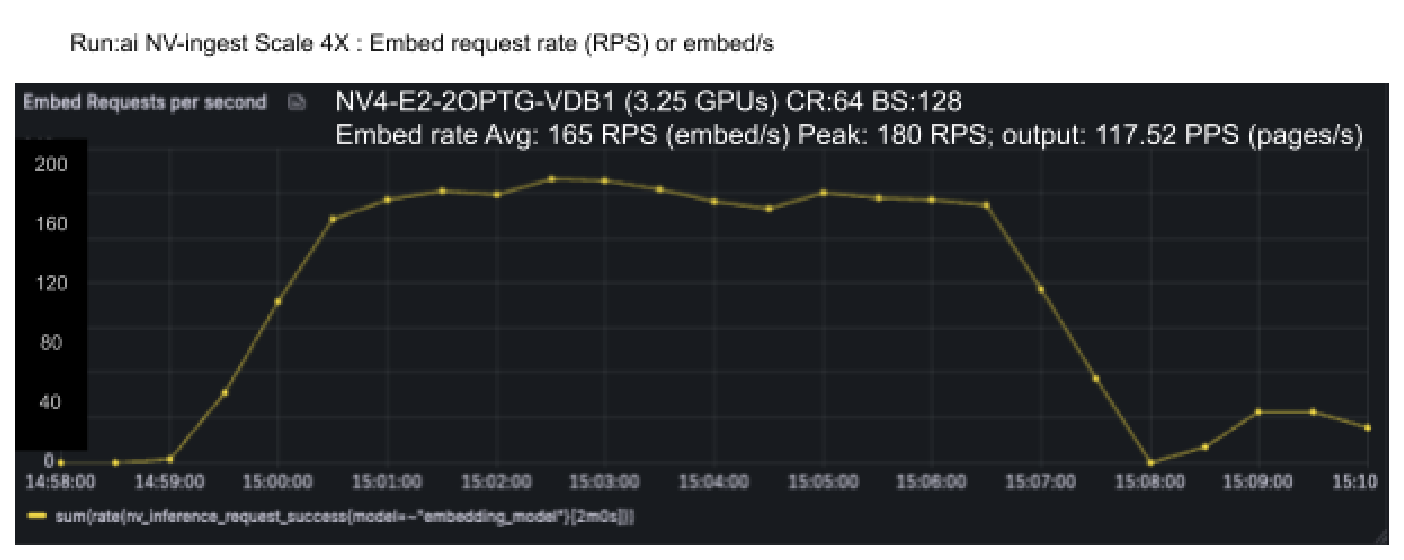
Figure 20 Embed request rate (RPS) for NV-Ingest Scale 4X, 2 Embedding (1 GPU) and O2PTG Extraction NIM microservices. Embed request rate: 165 RPS with Peak: 180 RPS.#
Scale 4X output results:
E2E Embed time (including extraction): 456.69s => 7.76min
Vector DB ingest time: 109.26 => 1.87 min
E2E ingest times: 577.9s => 9.63 min

Embed request rate: 165 RPS (embed/s) with Peak: 180 RPS
Embed rate: 117.52 PPS, 1.65 docs/s
E2E Ingest rate: 94.70 PPS, 1.33 docs/s
Linear Scaling for Ingestion - Strong vs Weak Scaling#
For linear scaling with NeMo Retriever (NV-Ingest) ingestion pipeline it is critical to find the right balance of CPU and GPU resources to allocate to NV-Ingest and Extraction NIM microservices so that when the NIM instances are scaled out the performance increases linearly and is relatively predictable. The performance gained from GPU acceleration must balance the cost (TCO) to provide reasonable performance per $(TCO).
The ingestion workload varies significantly e.g. digital corpora (bo767); has documents with varying sizes (1-300 pages, average 71 pages per document) and varying multimodal content (10-50 tables per document, 5-20 charts per document, 10-30 images per document). This makes it difficult to size NIM resources for the 4 extraction and embedding NIM to ensure predictable linear scaling.
If NIM microservices are oversubscribed, then the resources (GPU or CPU) allocated are insufficient and workload may not be able to run till resources are available, resulting in queueing, long tail latencies and unpredictable performance. With Extraction NIM microservices if there is insufficient GPU capacity then workload is partly pushed into the CPU. This increases NIM CPU utilization and can result in longer Embed times, poorer performance and reduced efficiency.
If the NIM microservices are undersubscribed, then the GPU resources are underutilized which results in poor efficiency and performance per $(TCO).
Strong Scaling refers to scaling up or down; adding resources (CPUs or Run:ai GPU fractions) to a NIM instance (pod) if it is undersubscribed or reducing resources if it is oversubscribed. Strong scaling with Run:ai GPU fractions provides fine grain control, better resource utilization, efficiency and performance per $(TCO). However in a Kubernetes cluster, this requires monitoring and right-sizing the NIM instance CPU resource allocation and the Run:ai fractional GPU allocation on the fly. This requires implementing a custom Vertical Pod Autoscalers (VPA, K8s add-on) for Run:ai GPU fractions and the real-time overhead of rollout/redeploy of NIM pods.
Weak Scaling refers to scaling out or in; adding or reducing NIM instances or replicas (pods). Kubernetes architecture inherently supports weak scaling with Horizontal Pod Autoscaler (HPA) to scale workload instances based on resource metrics e.g. GPU or CPU utilization. Weak scaling adds some overhead for load balancing between NIM replicas. Kubernetes supports L4 load balancing (kubeproxy uses IPVS hashing) that works well with short request calls. But ingestion workloads are not all equal, enterprise document sizes/content vary significantly; and in addition GPU workloads use batching for parallelism both of these can result in uneven distribution of load between NIM replicas causing some replicas to be oversubscribed (long tails, high latency) and some replicas are undersubscribed (unused capacity).
Given the variation in ingestion workload and complexity of allocating NIM resources (Run:ai GPU fractions or MIG); there is no easy formula for linear scaling of extraction NIM microservices. When scaling out the ingestion pipeline there will always be some NIM instances that are undersubscribed resulting in efficiency varying between 50-80% and performance per $(TCO) swinging between peaks and troughs as long as the average efficiency and performance-per-$ remains within a healthy threshold. Using MIG instead of Run:ai GPU fractions, results in less granular control and higher variation in efficiency range and wider performance per $(TCO) swing.
To maintain high efficiency (GPU utilization) of the ingestion pipeline implement the following:
Enable GPU sharing using Run:ai time slicing with GPU fractions, set the GPU fractions based on load and element type.
Use MIG GPU partitioning if strict isolation is required.
Increase concurrency or multiple documents being processed simultaneously.
Monitor GPU and CPU utilization metrics during test runs to find bottlenecks.
Allocate sufficient CPU to NV-Ingest and Extraction NIM microservices, and set the multithreading (
OMP_NUM_THREADS>1) appropriately.Use Strong scaling for static one-time deployments where the ingestion load, amount and type of data, is known ahead of time and NIM microservices can be manually preconfigured with the right size (GPU fractions).
Use Weak scaling for Kubernetes deployments with dynamic scaling where ingestion load and type of data is unknown ahead of time. Pre-allocate NIM microservices with smaller Run:ai GPU fractions and scale-out using HPA with GPU utilization metrics.
Use a combination of Strong and Weak scaling - use strong scaling to set the baseline GPU allocation for NIM microservices based on expected ingestion load and then use Weak scaling to dynamically scale out and scale in NIM microservices based on load and GPU utilization metrics.
Multimodal Ingestion Performance Results#
Minimum Baseline - Strong Scaling vs Weak Scaling#
Define the minimum baseline configuration with Run:ai using single GPU => Run:ai - Scale 1X (1 GPU) Baseline, as shown in table below. The Minimum Baseline configuration includes Embedding, Extraction and Vector DB Milvus (Datanode) on a single GPU. Efficiency measurements are made using this Run:ai Scale 1X (1 GPU) Minimum Baseline.
Scale 1X refers to 1 X NV-Ingest with Concurrency CR=16, size the NIM microservices with Run:ai GPU fractions to achieve the maximum throughput from single GPU. Then scale to Scale 2X with 2 X NV-Ingest Concurrency CR=32 and use Strong or Weak scaling to scale up or scale out the NIM microservices to achieve linear scaling, 2X embed/ingest rates and measure efficiency (%).
Run:ai - Scale 1X (1GPU) Minimum Baseline |
Run:ai - Scale 2X (1.75 GPU) Strong Scaling |
Run:ai - Scale 2X (1.75 GPU) Weak Scaling |
|---|---|---|
1NV-0.5E-0.5OPTG-1VDB |
2NV-1E-1OPTG-1VDB |
2NV-0.5E2-0.5O2P2T2G2-1VDB |
1 NV‑Ingest, 1 Embed (25%), 1 OPTG [0.5 OCR (20%), 1 page-elements (15%), 1 table-structure (10%), 1 graphic-elements (5%)] 1 VDB Milvus (25%) (1 Data Node) |
2 NV‑Ingest, 1 Embed (50%), 1 OPTG [1 OCR (40%), 1 page-elements (30%), 1 table-structure (20%), 1 graphic-elements (10%] 1 VDB Milvus (25%) (1 Data Node) |
2 NV‑Ingest, 2 Embed (25%), 2 OPTG [2 OCR (20%), 2 page-elements (15%), 2 table-structure (10%), 2 graphic-elements (5%)] 1 VDB Milvus (25%) (1 Data Node) |
Workers: 32, Concurrency(CR): 16, Batch Size (BS): 32 |
Workers: 64, Concurrency(CR): 32, Batch Size (BS): 64 |
Workers: 64, Concurrency(CR): 32, Batch Size (BS): 64 |
Strong Scaling shows 5-7% better performance for Embed and E2E Ingest rates and the Scaling Efficiency is 6% higher for Strong (95%) vs Weak(89%) Scaling. Weak Scaling carries the overhead of uneven distribution of load between NIM replicas that can increase latency.
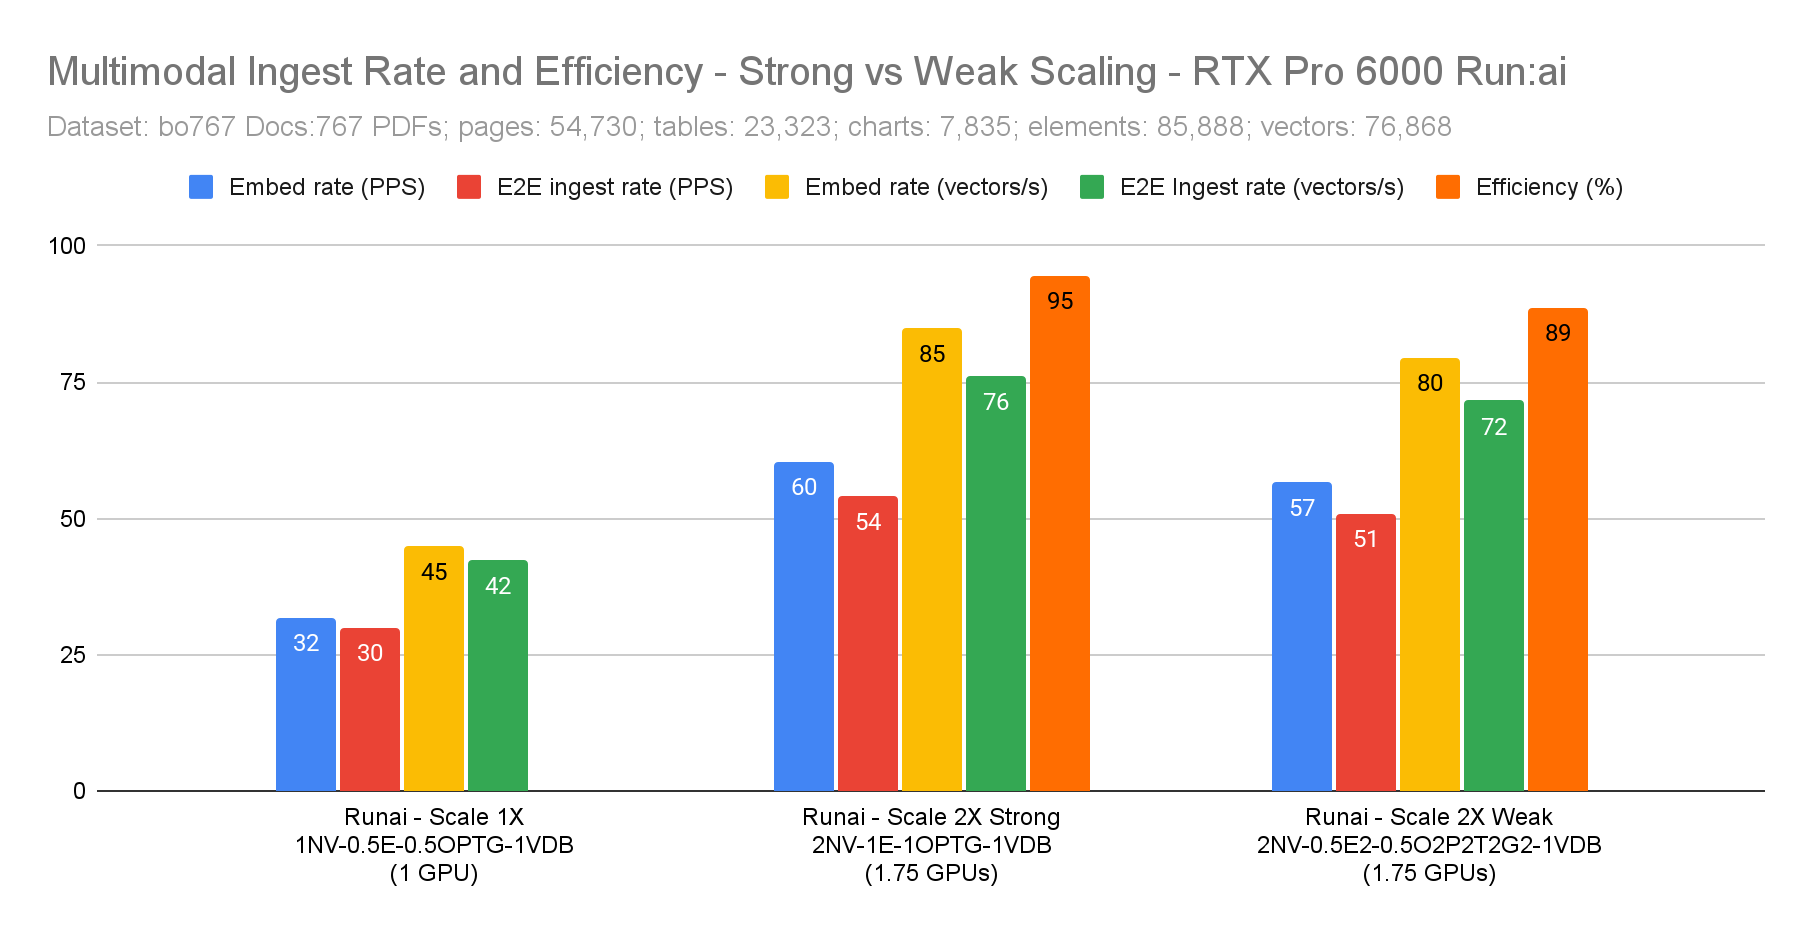
Figure 21 Multimodal Embed and E2E Ingest rate comparison for Strong vs Weak Scaling with Run:ai.#
Run:ai Ingestion Performance with RTX PRO 6000#
Run:ai Baseline - Scale1X (1.75 GPUs) configuration shown in the table below is used as the baseline for scaling the ingestion pipeline when using Run:ai with RTX PRO 6000. Scale 1X refers to 1 X NV-Ingest scale with baseline Concurrency CR=16.
The Run:ai Baseline - Scale1X (1.75 GPUs) configuration is sized for Scale 2X (scaled up with strong scaling) for optimal performance with Concurrency CR=32 and 2X NV-Ingest. Compared to Minimum Baseline defined in previous section, the Run:ai Baseline allocates 2X GPU fractions for NIM microservices: Embed (50% GPU), OCR (40% GPU), page-elements (30% GPU), table-structure (20% GPU), graphic-elements(10% GPU).
Run:ai Minimum Baseline (1 GPU) Strong Scaling |
Run:ai - Scale 1X (1.75 GPU) Baseline |
|---|---|
1NV-0.5E-0.5OPTG-1VDB |
1NV-1E-1OPTG-1VDB |
1 NV‑Ingest, 1 Embed (25%), 1 OPTG [0.5 OCR (20%), 1 page-elements (15%), 1 table-structure (10%), 1 graphic-elements (5%)] 1 VDB Milvus (25%) (1 Data Node) — Workers: 32, Concurrency(CR): 16, Batch Size (BS): 32 |
1 NV‑Ingest, 1 Embed (50%), 1 OPTG [1 OCR (40%), 1 page-elements (30%), 1 table-structure (20%), 1 graphic-elements (10%)] 1 VDB Milvus (25%) (1 Data Node) — Workers: 64, Concurrency(CR): 32, Batch Size (BS): 64 |
The intention is to start with a Strong Scaling 2X configuration and then use Weak scaling to scale out further (Scale 3X, 4X, 6X). This will reduce load balancing overhead and provide better overall performance and efficiency with scaling with fewer NIM fragmented instances. However the Run:ai Baseline config will have poor efficiency due to undersubscription for 1X NV-Ingest with Concurrency CR=16 but efficiency will improve as Concurrency is increased.
The chart below shows the Multimodal Embed and E2E Ingest rate for NV-Ingest Scale 1X- 6X. The Embed and Ingest rates are scaling linearly when Concurrency is increased CR= [16, 32, 48, 64, 92] as NV-Ingest and NIM microservices are scaled out.
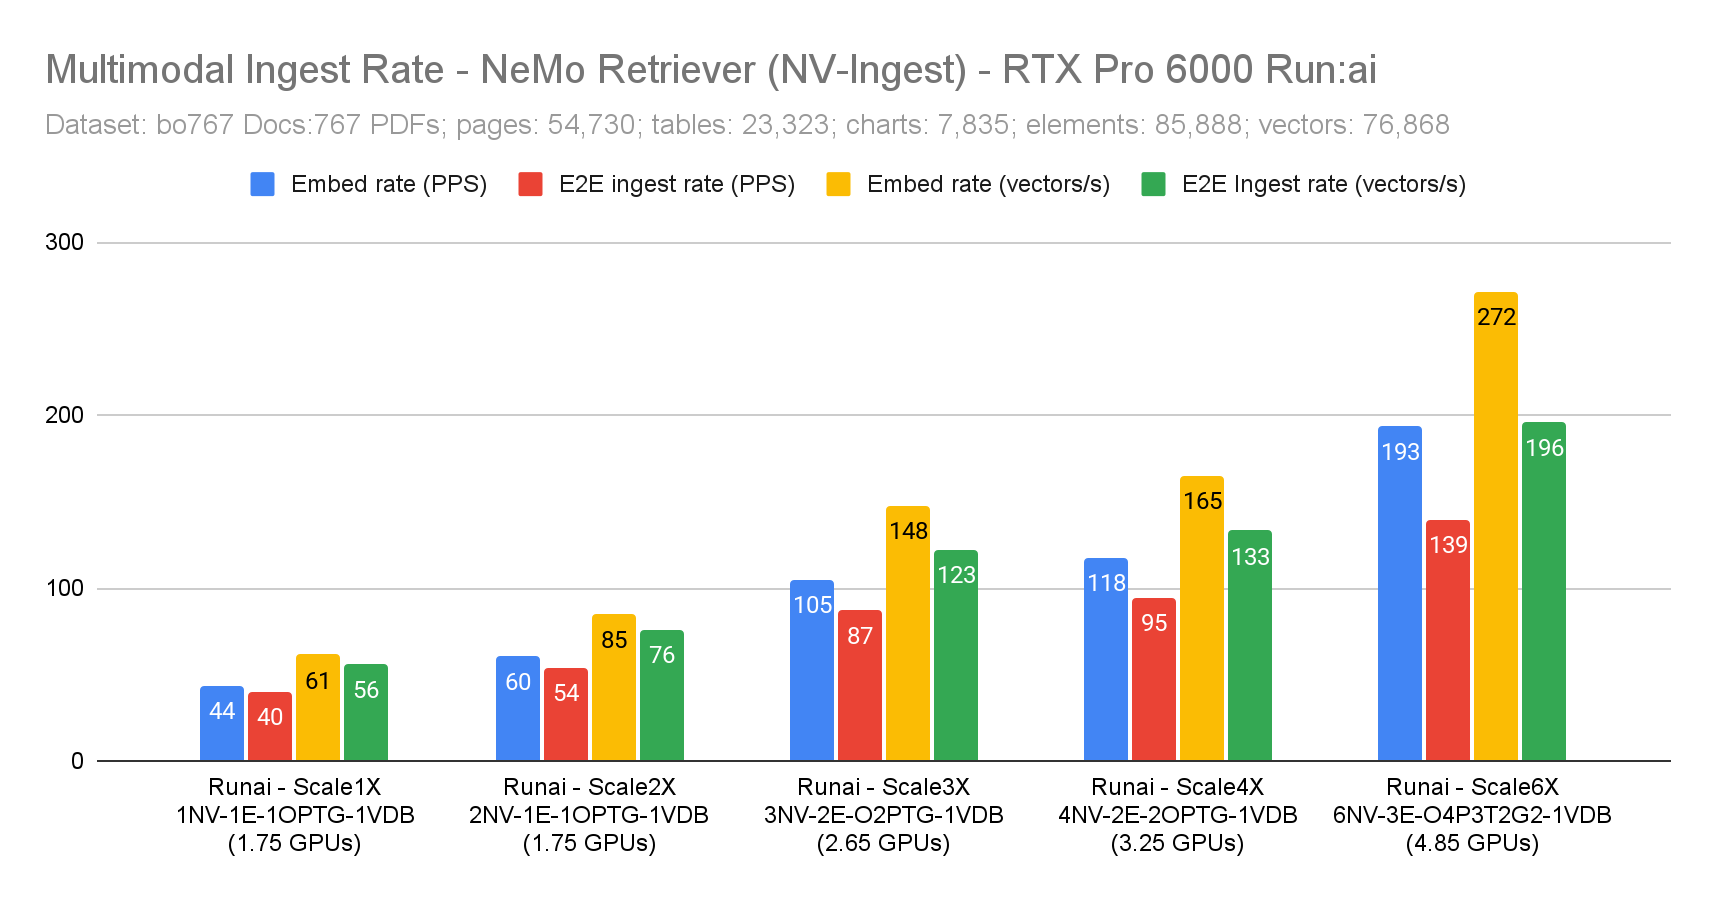
Figure 22 Multimodal Embed and E2E Ingest rate for NV-Ingest Scale 1X-6X with Run:ai. The Embed and Ingest rates scale linearly when Concurrency is increased CR=[16, 32, 48, 64, 92].#
The page rate measures the rate at which pages are embedded and ingested. The Vector rate is more than the page rate since it measures the rate at which vectors for all elements (text, tables, charts) are created and ingested.
With Scale 4X and Scale 6X, there are a number of NIM instance fragments as can be seen in the table breakdown below.
Scale 4X - 2 Embed, 2 OPTG [2 OCR, 2 page, 2 table, 2 graphic] => 10 NIM instances
Scale 6X - 3 Embed, O4P3T2G2 [4 OCR, 3 page, 2 table, 2 graphic] => 14 NIM instances
Run:ai Scale4X (3.25 GPUs) |
Run:ai - Scale6X (4.85 GPUs) |
|---|---|
4NV-2E-2OPTG-1VDB |
6NV-3E-O4P3T2G2-1VDB |
4 NV‑Ingest, 2 Embed, 2 OPTG [2 OCR, 2 page, 2 table, 2 graphic], 1 VDB Milvus — Workers: 128, Concurrency: 64, Batch Size: 128 |
6 NV‑Ingest, 3 Embed, O4P3T2G2 [4 OCR, 3 page, 2 table, 2 graphic], 1 VDB Milvus — Workers: 192, Concurrency: 96, Batch Size: 192 |
For scaling Scale 4X or higher, it is recommended to re-evaluate the Run:ai Baseline using strong scaling to consolidate to larger GPU fractions or full GPUs for NIM microservices. This would reduce the load balancing overhead and provide better scaling efficiency.
TCO - Multimodal NV-Ingest with Run:ai - Cost per 1 Million Vectors#
The chart below shows the TCO Cost to ingest 1 Million vectors with GPU acceleration for Data Extraction, Embedding and Milvus Vector DB (cuVS) Ingestion (CAGRA) using Run:ai GPU fractions for Extraction and Embedding NIM microservices and Milvus Data node. For the Run:ai Baseline - Scale1X with 1 NV-Ingest, Concurrency=16, the Efficiency is low at 69% since Embedding and Extraction NIM microservices are undersubscribed with 1.5 GPUs allocated. A scaled up baseline (Strong scaling) was selected to improve efficiency and reduce load balancing overhead with NIM fragmentation at higher scale 2X and beyond.
With Scale 2X or higher the TCO E2E Ingest Cost for 1 Million vectors improves and remains fairly stable ~$4.75 for Scale 2X, 3X, 4X and 6X. The E2E ingest TCO swings between $4.66 to $5.00 since there is slight undersubscription of GPU or CPU resources when scaling out the NIM microservices. This indicates fairly linear scaling of the Extraction and Embedding Ingestion pipeline from Scale 2X - 6X (1.5 to 4.6 GPUs) with Milvus vector DB static allocation of 1 Data node (0.25 GPU).
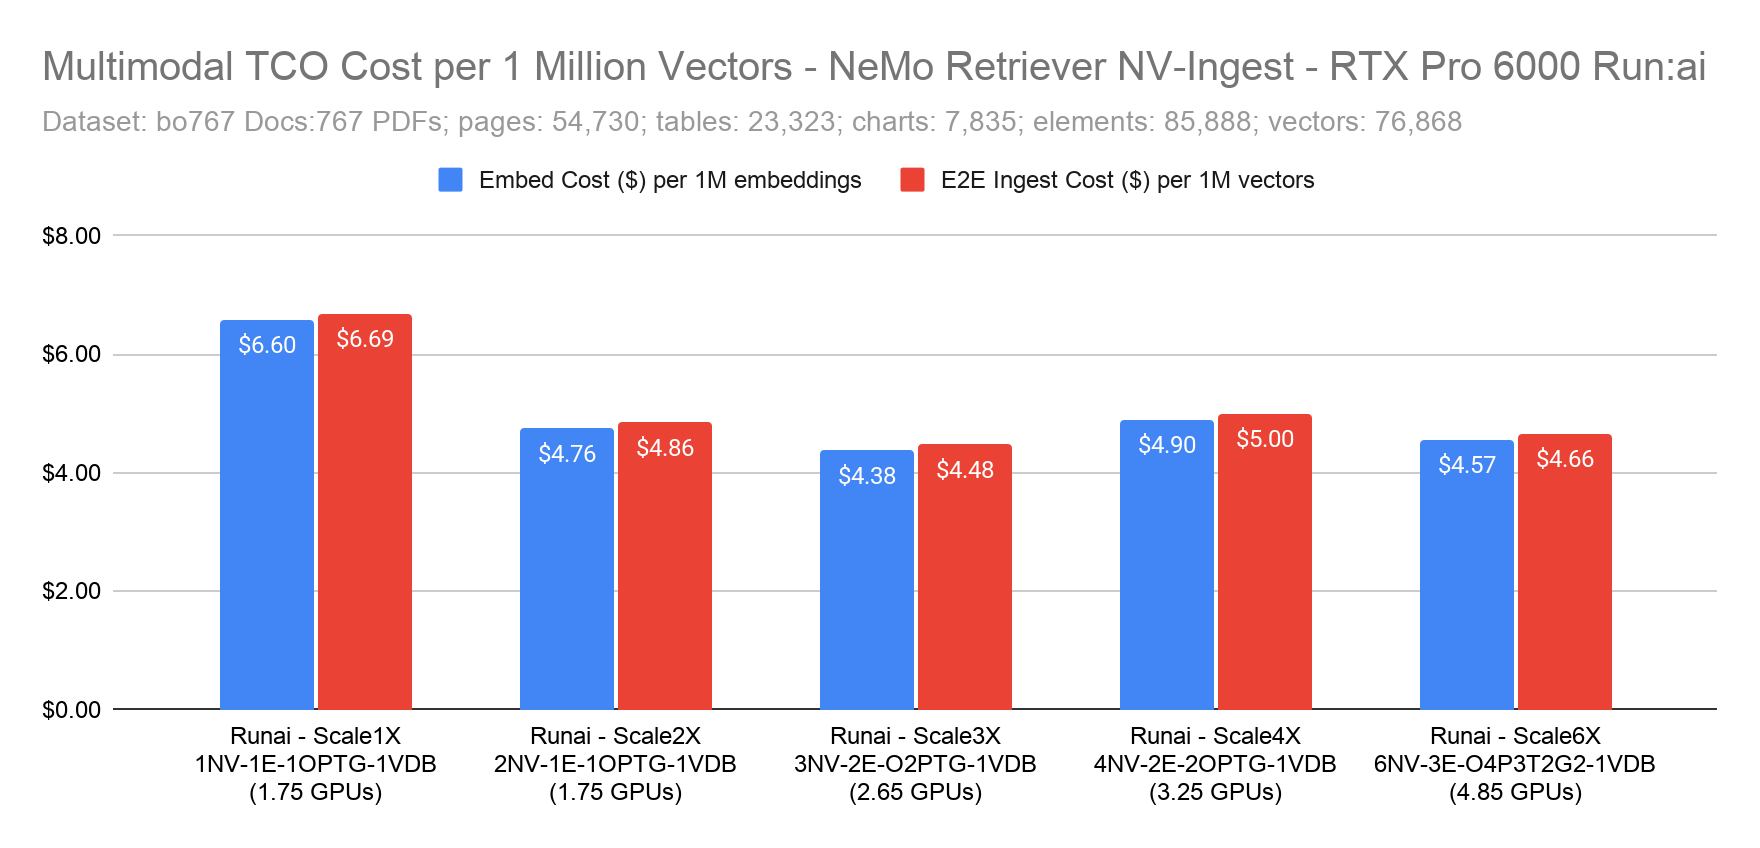
Figure 23 TCO Cost to ingest 1 Million vectors with GPU acceleration using Run:ai GPU fractions. TCO E2E Ingest Cost remains stable ~$4.75 for Scale 2X through 6X.#
For GPU accelerated Extraction, Embedding and Milvus VDB (cuVS), the Embed time and E2E Ingest time for 1 Million vectors decreases significantly when scaling from Scale 1X to Scale 6X, as seen in the chart below. For Scale 1X (1.75 GPU) the Embed time and E2E Ingest time are 4.56 hours and 4.96 hours respectively and for Scale 6X (4.85 GPU) the Embed / Ingest times are 1.02 hours/ 1.42 hours respectively.
For ingesting 1M vectors, when scaling Extraction and Embedding NIM microservices from Scale 1X to 6X there is a 4.5X reduction in Embed time (4.53 hours to 1.02 hours) with a 3X increase in the number of GPUs (1.5 GPU to 4.6 GPUs).
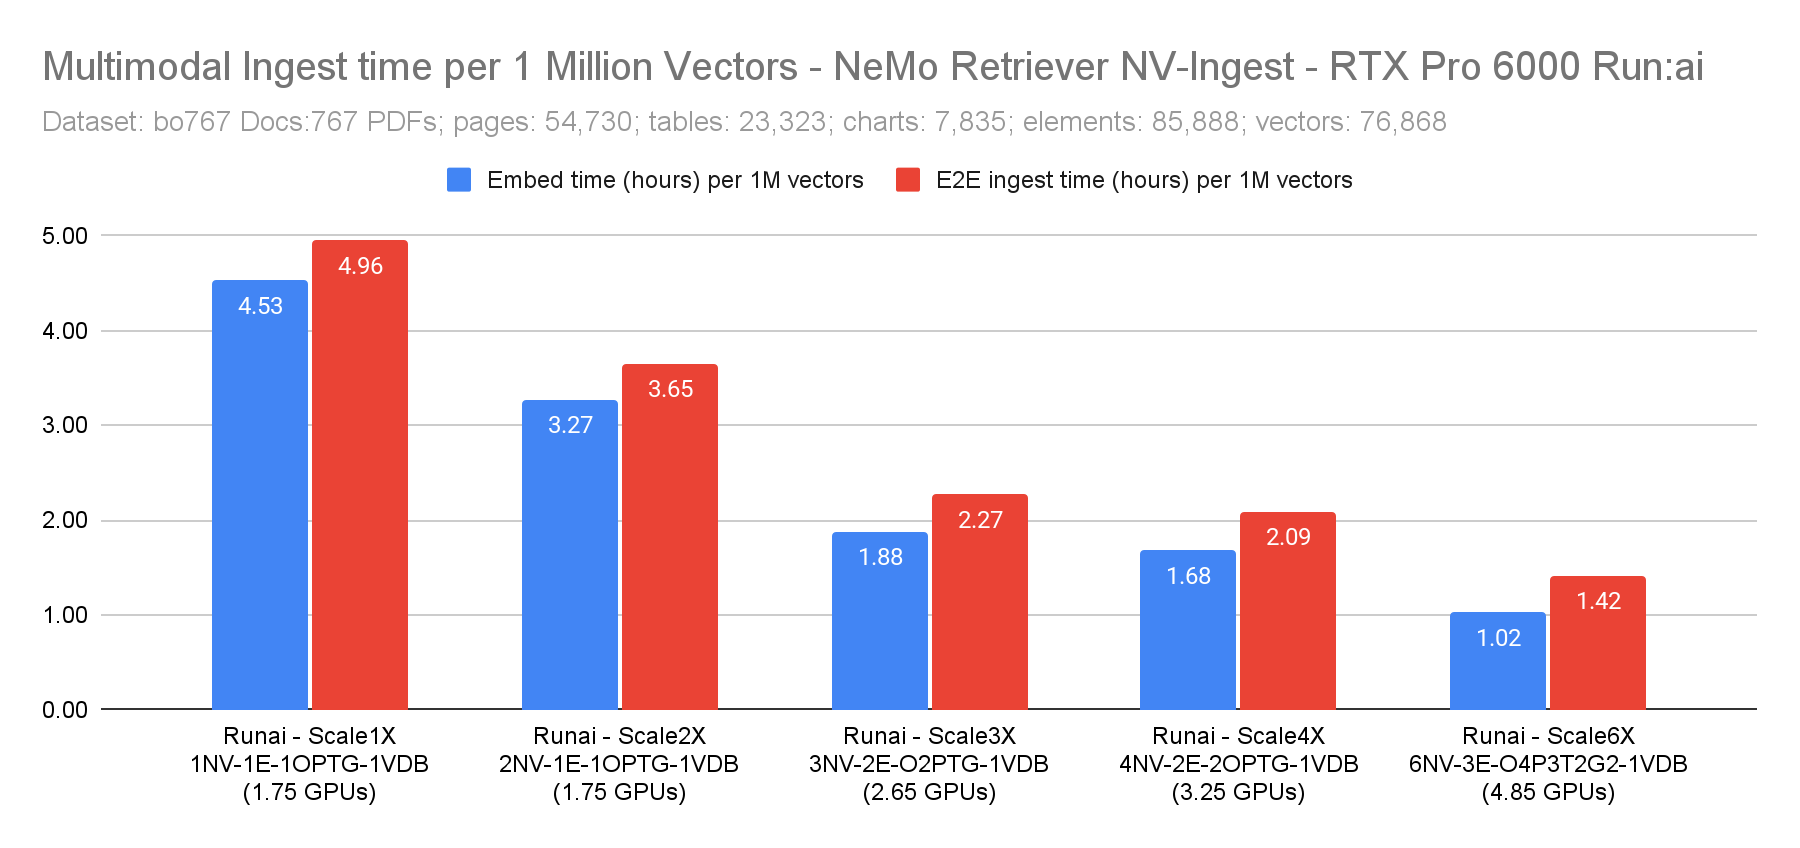
Figure 24 Embed time and E2E Ingest time for 1 Million vectors decreasing proportionally when scaling from Scale 1X to Scale 6X with Run:ai.#
MIG Ingestion Performance with RTX PRO 6000#
MIG Baseline - Scale1X (2 GPUs) configuration shown in the table below is used as the baseline for scaling the ingestion pipeline when using MIG with RTX PRO 6000. Scale 1X refers to 1 X NV-Ingest scale with Baseline Concurrency CR=16.
The MIG Baseline - Scale1X (2 GPUs) configuration is sized for Scale 2X (scaled up using strong scaling) for optimal performance with Concurrency CR=32 and 2X NV-Ingest. Compared to Minimum Baseline (1 GPU), the MIG Baseline (2 GPUs) allocates larger MIG profiles for Embed (mig-2g.48gb, 50% GPU), OCR (mig-2g.48gb, 50% GPU) and other NIM microservices (mig-1g.24gb, 25% GPU).
Run:ai Minimum Baseline (1 GPU) Strong Scaling |
MIG - Scale 1X (2 GPU) Baseline Strong Scaling |
|---|---|
1NV-0.5E-0.5OPTG-1VDB |
1NV-1E-1OPTG-1VDB |
1 NV‑Ingest, 1 Embed (25% GPU), 1 OPTG (50% GPU) [OCR (20% GPU), 1 page-elements (15% GPU), 1 table-structure (10% GPU), 1 graphic-elements (5% GPU)] 1 VDB Milvus (25% GPU) (1 Data Node) — Workers: 32, Concurrency(CR): 16, Batch Size (BS): 32 |
1 NV‑Ingest, 1 Embed (mig-2g.48gb), 1 OPTG [1 OCR (mig-2g.48gb), 1 page-elements (mig-1g.24gb), 1 table-structure (mig-1g.24gb), 1 graphic-elements (mig-1g.24gb)] 1 VDB Milvus (mig-1g.24gb) (1 Data Node) — Workers: 32, Concurrency (CR): 16, Batch Size (BS): 32 |
The intention is to start with a Strong Scaling 2X configuration and then use Weak scaling to scale out further (Scale 3X, 4X, 6X). This will reduce load balancing overhead and provide better overall performance and efficiency with scaling with fewer NIM fragmented instances. However the Run:ai Baseline config will have poor efficiency due to undersubscription for 1X NV-Ingest with Concurrency CR=16 but efficiency will improve as Concurrency is increased.
The chart below shows the Multimodal Embed and E2E Ingest rate for NV-Ingest Scale 1X- 6X. The Embed and Ingest rates are scaling linearly when Concurrency is increased CR= [16, 32, 48, 64, 92] as NV-Ingest and NIM microservices are scaled out.
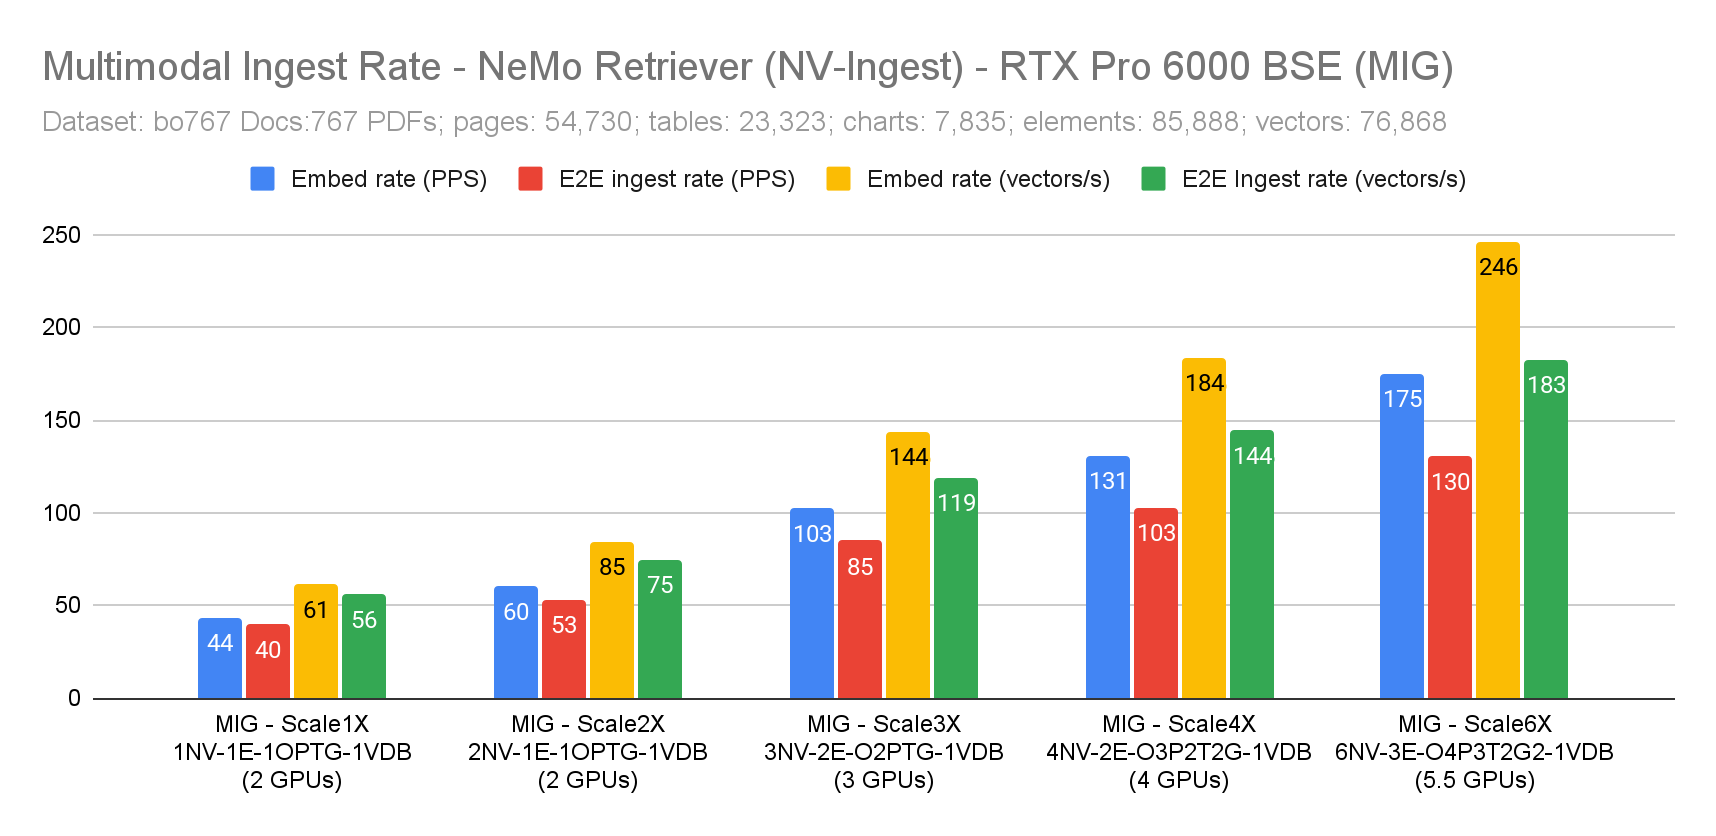
Figure 25 Multimodal Embed and E2E Ingest rate for NV-Ingest Scale 1X-6X with MIG. The Embed and Ingest rates scale linearly when Concurrency is increased.#
The chart above compares the Embed and E2E Ingest rate as NV-Ingest and NIM microservices are scaled out when Concurrency is increased.
The page rate measures the rate at which pages are embedded and ingested. The Vector rate measures the rate at which vectors for all elements (text, tables, charts) are created and ingested.
With Scale 4X and Scale 6X, there are a number of NIM instance fragments as can be seen in the table breakdown below.
Scale 4X - 2 Embed, O3P2T2G1 [3 OCR, 2 page, 2 table, 1 graphic] => 10 NIM instances
Scale 6X - 3 Embed, O4P3T2G2 [4 OCR, 3 page, 2 table, 2 graphic] => 14 NIM instances
MIG Scale 4X (4 GPUs) |
MIG - Scale 6X (5.5 GPUs) |
|---|---|
4NV-2E-O3P2T2G1-1VDB |
6NV-3E-O4P3T2G2-1VDB |
4 NV‑Ingest, 2 Embed, O3P2T2G1 [3 OCR, 2 page, 2 table, 1 graphic], 1 VDB Milvus — Workers: 128, Concurrency: 64, Batch Size: 128 |
6 NV‑Ingest, 3 Embed, O4P3T2G2 [4 OCR, 3 page, 2 table, 2 graphic], 1 VDB Milvus — Workers: 192, Concurrency: 96, Batch Size: 192 |
For scaling Scale 4X or higher, it is recommended to re-evaluate the MIG Baseline using strong scaling to consolidate to larger GPU profiles or full GPUs for NIM microservices. This would reduce the load balancing overhead and provide better scaling efficiency.
TCO - Multimodal NV-Ingest with MIG - Cost per 1 Million Vectors#
The chart below shows the TCO Cost to ingest 1 Million vectors with GPU acceleration for Extraction, Embedding and Milvus Vector DB (cuVS) Ingestion (CAGRA) using Run:ai GPU fractions for Extraction and Embedding NIM microservices and Milvus Data node. For the MIG Baseline - Scale1X with 1 NV-Ingest, Concurrency=16, the TCO Cost is high ($8.73) and Efficiency is low at 68% since Embedding and Extraction NIM microservices are undersubscribed with 1.75 GPUs allocated. A scaled up Baseline (strong scaling), allocates Embed (mig-2g.48gb), OCR (mig-2g.48gb) and other NIM microservices (mig-1g.24gb). It was selected to improve efficiency and reduce load balancing overhead with NIM fragmentation at higher scale 2X and beyond.
With Scale 2X or higher the TCO E2E Ingest Cost for 1 Million vectors improves and remains fairly stable ~$5.60 for Scale 2X, 3X, 4X and 6X. The TCO Ingest Cost swings between $5.24 to $5.85, since there is some undersubscription of GPU or CPU resources when scaling out the NIM microservices. MIG is not as efficient (compared to Run:ai), in allocating GPU partitions and this results in more NIM undersubscription with higher TCO Ingest costs, larger swings in TCO Cost and slightly lower Efficiency (%).
However the TCO E2E Ingest cost is still fairly stable and indicates linear scaling of the Extraction and Embedding Ingestion pipeline from Scale 2X - 6X (1.75 to 5.25 GPUs) with Milvus vector DB static allocation of 1 Data node (0.25 GPU).
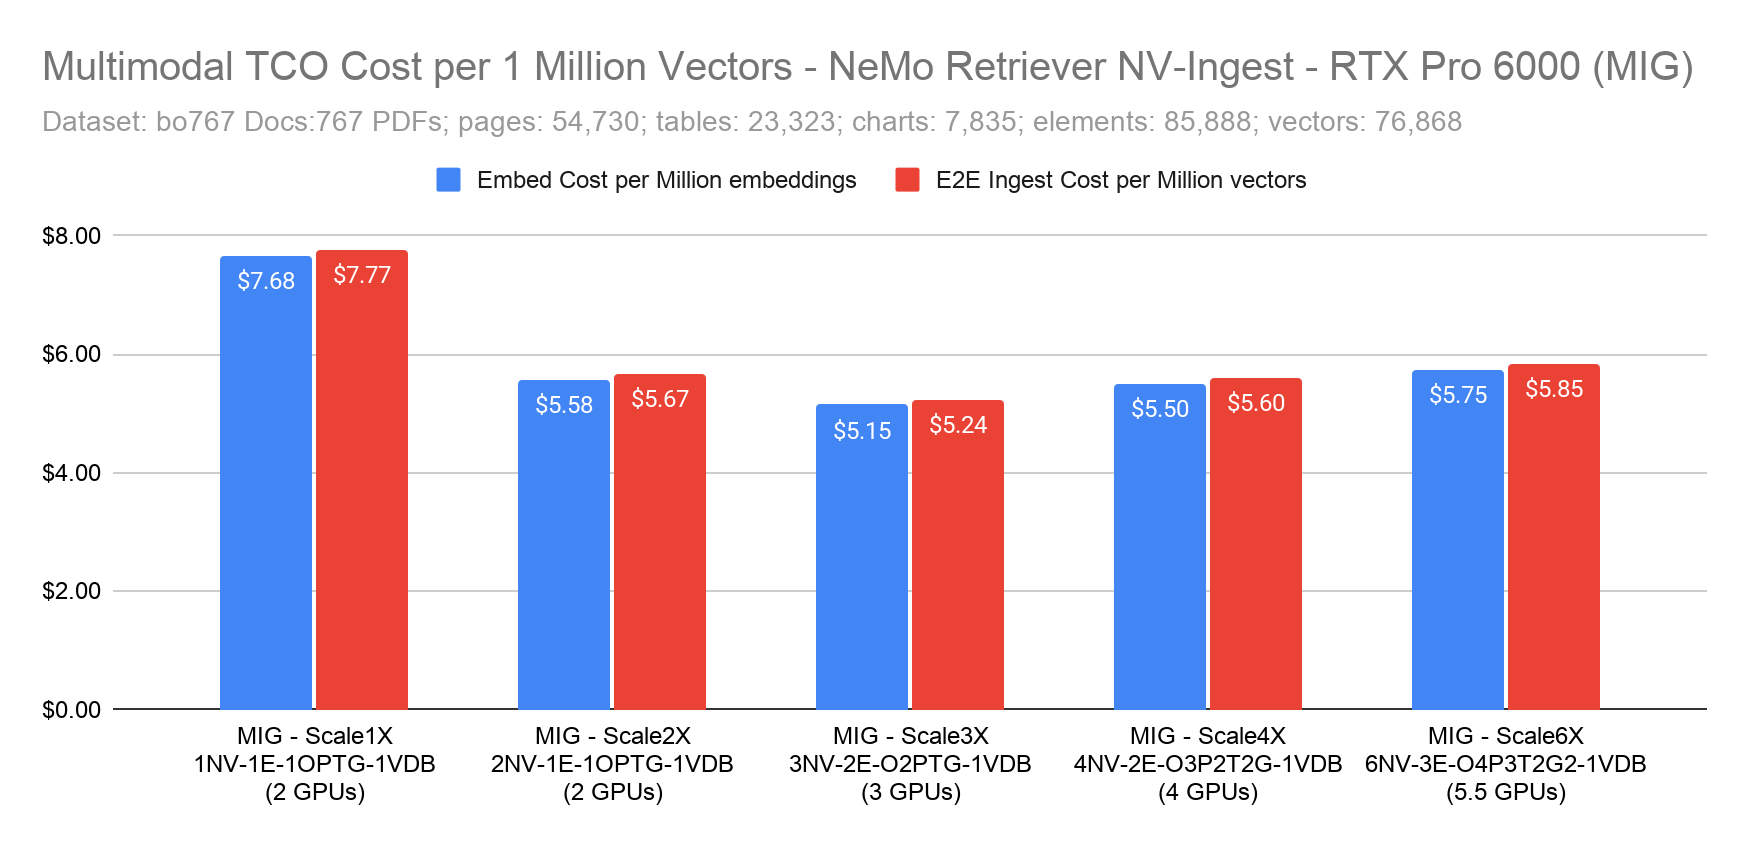
Figure 26 TCO Cost to ingest 1 Million vectors with GPU acceleration using MIG profiles. TCO E2E Ingest Cost remains stable ~$5.60 for Scale 2X through 6X.#
For GPU accelerated Extraction, Embedding and Milvus VDB (cuVS), the Embed time and E2E Ingest time for 1 Million vectors decreases proportionally when scaling from Scale 1X to Scale 6X, as seen in the chart below. For Scale 1X (2 GPUs) the Embed time and E2E Ingest time are 4.52 hours and 4.95 hours respectively and for Scale 6X (5.5 GPU) the Embed / Ingest times are 1.12 hours/ 1.52 hours respectively.
For ingesting 1M vectors, when scaling Extraction and Embedding NIM microservices from Scale 1X to 6X there is a ~4X reduction in Embed time (4.52 hours to 1.13 hours) with a 2.75X increase in the number of GPUs (2 GPU to 5.5 GPUs).
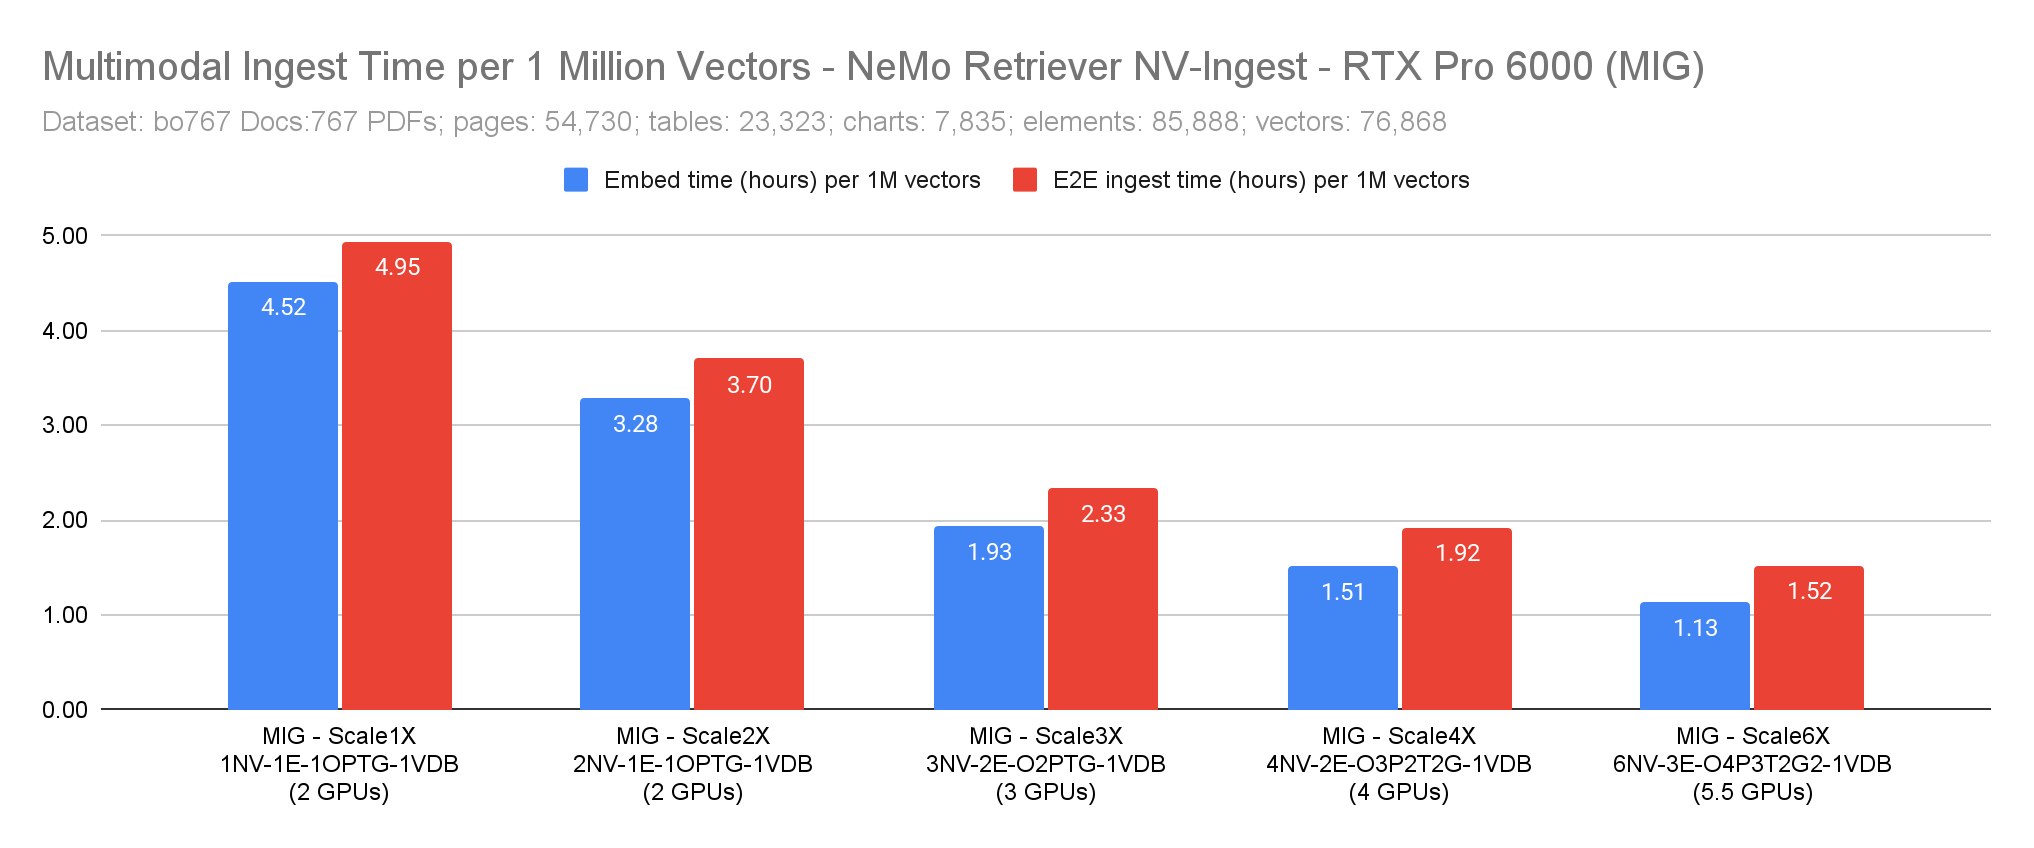
Figure 27 Embed time and E2E Ingest time for 1 Million vectors decreasing proportionally when scaling from Scale 1X to Scale 6X with MIG.#
Text-only - NeMo Retriever (NV-Ingest) Ingestion#
For performance benchmarking use the NV-Ingest client directly to connect to the NeMo Retriever (NV-Ingest) server in the Kubernetes cluster. The Embedding NIM, Extraction NIM microservices and Milvus data nodes can be deployed using either MIG profiles or Run:ai GPU fractions to enable efficient use of GPU resources.
The NV-Ingest client sends PDF documents from the document source path provided to the NV-Ingest server for text-only extraction. The documents are uploaded as requests (submit-v2 jobs) based on the specified concurrency and batch_size. The Embedding NIM and Milvus Data Nodes are used with Run:ai or MIG profiles for RTX PRO 6000 (or H200 NVL).
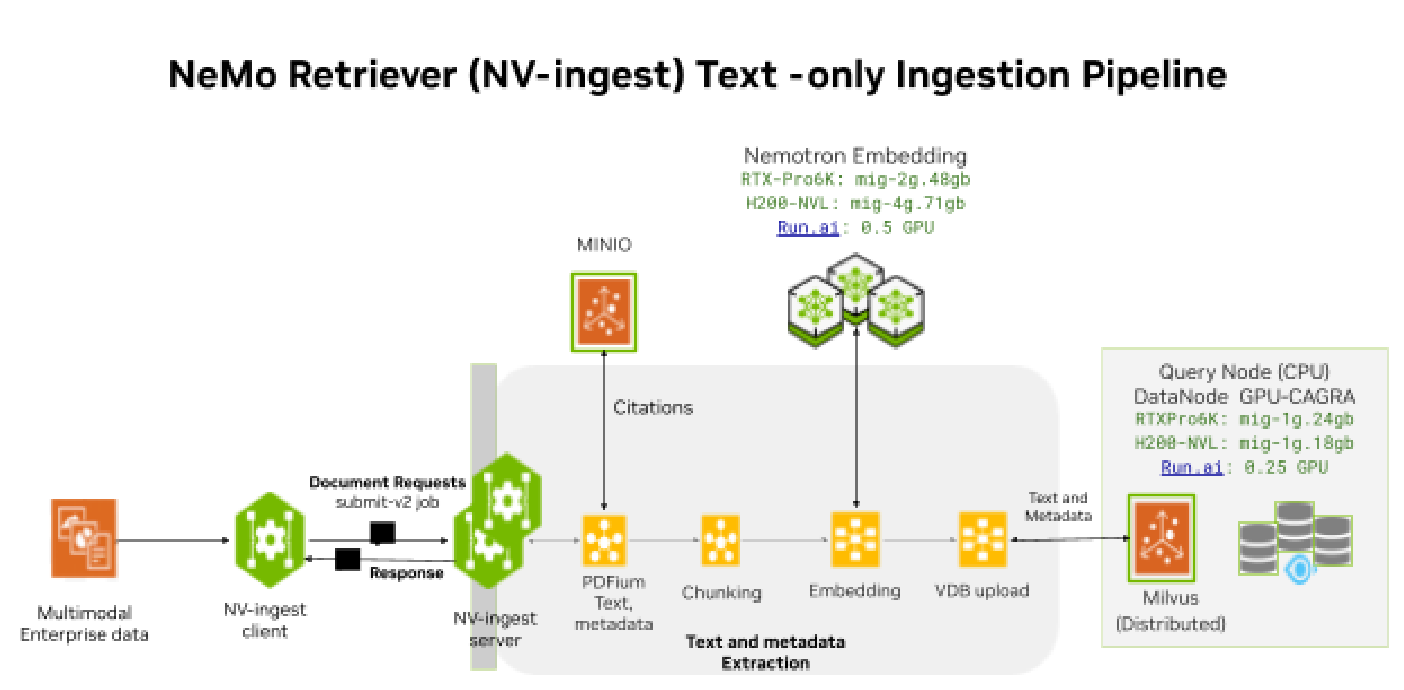
Figure 28 RAG Ingestion - NeMo Retriever (NV-Ingest) Text-only ingestion#
Dataset: digital corpora (download bo767 ids) => Docs: 767 PDFs; Pages/Text elements: 54,730, Milvus vector DB embeddings: 45,819.
NV-Ingest Text Baseline - Scale1X (0.75 GPU) configuration shown in the table below is used as the baseline for scaling the ingestion pipeline using Run:ai or MIG profiles. Scale 1X refers to 1X NV-Ingest and 1X Embed NIM scale with Baseline Concurrency CR=16.
NV-Ingest Text Baseline Scale1X (0.75 GPU) |
Run:ai GPU fraction |
MIG RTX PRO 6000 |
MIG H200 NVL |
CPU/Mem |
|---|---|---|---|---|
1 NV-Ingest - 32 Workers |
NA |
NA |
NA |
16 vCPU, 32 GiB |
1 Embed — llama-nemotron-embed-1b-v2 |
0.5 GPU |
mig-2g.48gb |
mig-4g.71gb |
1 vCPU, 8 GiB |
Milvus 1 Data node |
0.25 GPU |
mig-1g.24gb |
mig-1g.18gb |
16 vCPU, 32 GiB |
Milvus 1 Query node |
NA |
NA |
NA |
16 vCPU, 40 GiB |
Perform the benchmarking to validate Scale 1X to Scale 8X with scale out of NV-Ingest and Embedding NIM microservices with Concurrency CR = [16, 32, 48, 64, 96, 128,192, 256] and Batch Size = [32, 63, 96, 128, 192, 256, 192, 256] accordingly.
Use metrics to gauge NV-Ingest CPU and Embedding NIM GPU utilization. Scale out NV-Ingest and Embedding NIM when average CPU or GPU utilization >80%.
Performance Results - NV-Ingest Text#
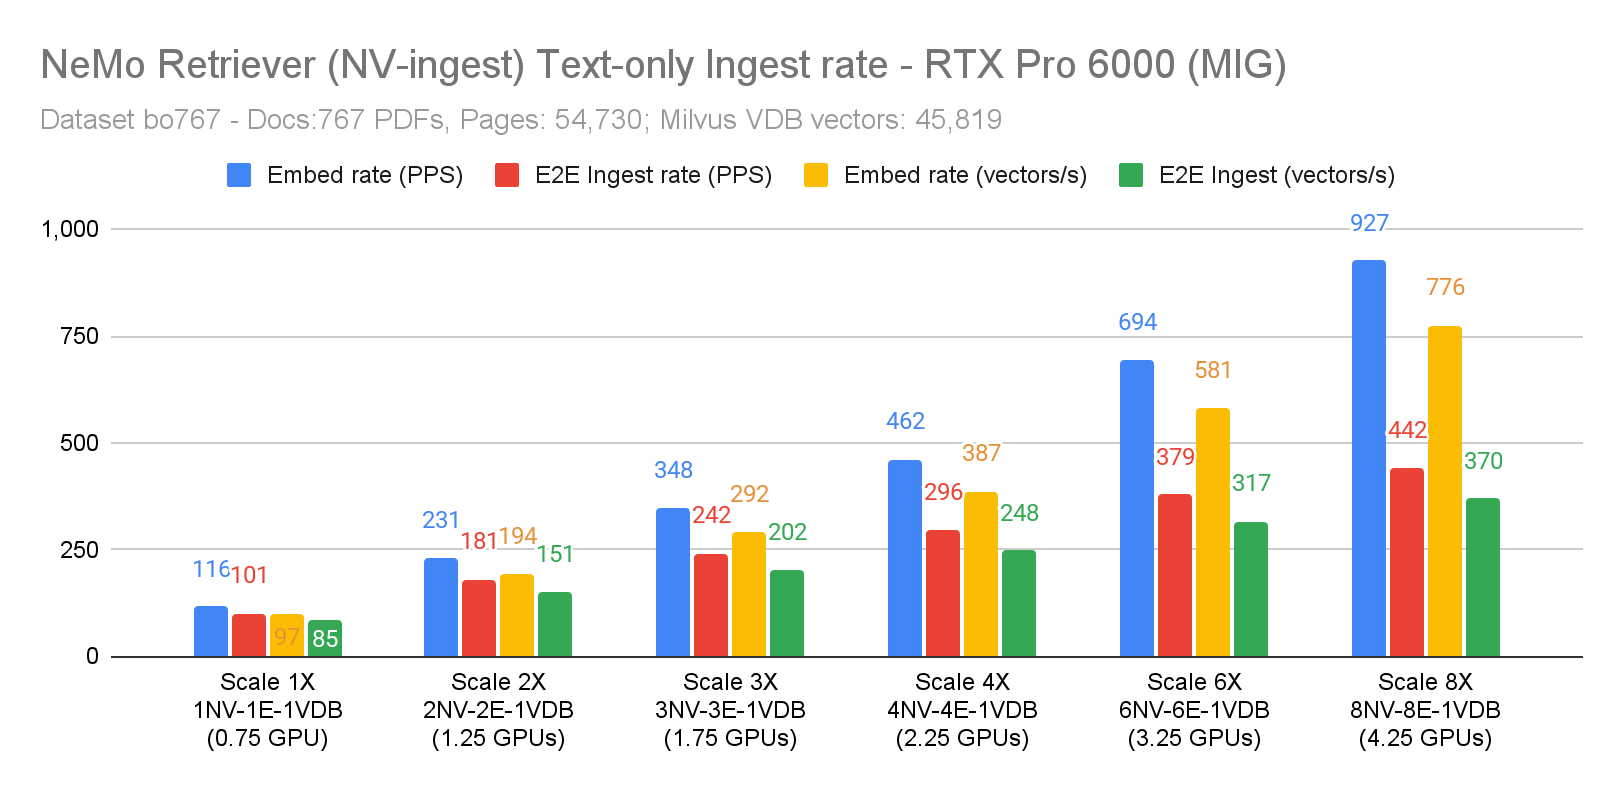
Figure 29 Embed and E2E Ingest rate for NV-Ingest Scale 1X-8X. The Embed and Ingest rates scale linearly as NV-Ingest and Embedding NIM are scaled out when Concurrency increases CR=[32,64,96,128,192,256].#
The page rate measures the rate at which pages are embedded and ingested. The Vector rate measures the rate at which vectors are created and ingested. The vector rate is less than the page rate since some pages are empty or have no readable content.
Table below shows summary of results for NV-Ingest Scale 1X - 8X with Concurrency CR= [32,64,96,128, 192,256]:
Scale Configuration |
Embed rate |
E2E Ingest rate |
Resources GPU/CPU |
|---|---|---|---|
Scale 1X - 1NV-1E-1VDB (0.75 GPU) — 1 NV‑Ingest, 1 Embed, 1 VDB Milvus (1 Data Node) — NV-Ingest Workers: 32, MAX_UTILS: 32 — Concurrency(CR): 32, Batch Size (BS): 64 |
97 embed/s — 116 PPS — 1.63 docs/s |
85 vectors/s — 101 PPS — 1.42 docs/s |
Total GPUs = 0.5 (Embed) + 0.25 (Milvus) = 0.75 GPUs — Total CPUs = 16 (NV-Ingest) + 1 (Embed) + 16 (Milvus) = 33 vCPUs |
Scale 2X - 2NV-2E-1VDB (1.25 GPU) — 2 NV‑Ingest, 2 Embed, 1 VDB Milvus — Concurrency: 64 BatchSize: 128 |
194 embed/s — 231 PPS — 3.24 docs/s |
151 vectors/s — 181 PPS — 2.54 docs/s |
GPU: 1.25 — CPU: 52 |
Scale 3X - 3NV-3E-1VDB (1.75 GPU) — 3 NV‑Ingest, 3 Embed, 1 VDB Milvus — Concurrency: 96 BatchSize: 192 |
292 embed/s — 348 PPS — 4.88 docs/s |
202 vectors/s — 242 PPS — 3.39 docs/s |
GPU: 1.75 — CPU: 70 |
Scale 4X - 4NV-4E-1VDB (2.25 GPU) — 4 NV‑Ingest, 4 Embed, 1 VDB Milvus — Concurrency: 128 BatchSize: 256 |
387 embed/s — 462 PPS — 6.47 docs/s |
248 vectors/s — 296 PPS — 4.15 docs/s |
GPU: 2.25 — CPU: 88 |
Scale 6X - 6NV-6E-1VDB (3.25 GPU) — 6 NV‑Ingest, 6 Embed, 1 VDB Milvus — Concurrency: 192 BatchSize: 192 |
581 embed/s — 694 PPS — 9.72 docs/s |
317 vectors/s — 379 PPS — 5.31 docs/s |
GPU: 3.25 — CPU: 124 |
Scale 8X - 8NV-8E-1VDB (4.25 GPU) — 8 NV‑Ingest, 8 Embed, 1 VDB Milvus — Concurrency: 256 BatchSize: 256 |
776 embed/s — 927 PPS — 12.99 docs/s |
370 vectors/s — 442 PPS — 6.19 docs/s |
GPU: 4.25 — CPU: 160 |
TCO - Text-only NV-Ingest - Cost per 10 Million Vectors#
The TCO Cost ($) for embedding and ingesting 10 Million Vectors with GPU accelerated Embedding and Milvus Vector DB (cuVS CAGRA index) remains fairly stable at $15.56 and $1.11 respectively when scaling Embedding NIM Scale from 1X (0.5 GPU) to 8X (4 GPUs) with Milvus VDB static allocation of 1 Data node (0.25 GPU). This indicates linear scaling for the Embedding NIM.
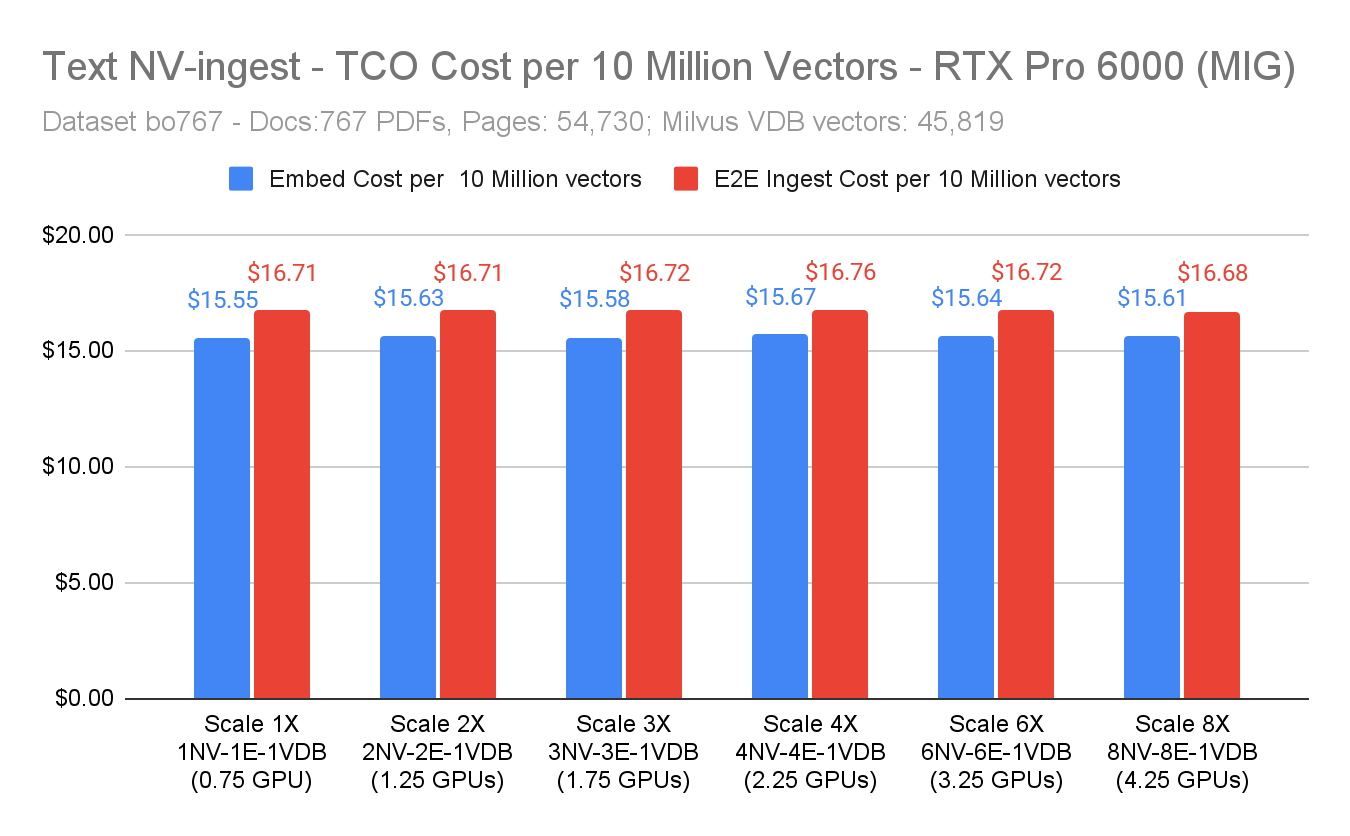
Figure 30 TCO Cost per 10 Million Vectors for Text-only NV-Ingest. Cost remains stable at ~$15.56 when scaling from Scale 1X to Scale 8X.#
For GPU accelerated Embedding and Milvus (cuVS), the Embed time and E2E ingest time for 10 Million vectors decreases proportionally when scaling from Scale 1X to Scale 8X, as seen in the chart below. For Scale 1X (0.75 GPU) the Embed time and E2E Ingest time are 28.5 hours and 33 hours respectively and for Scale 8X (4.25 GPU) the Embed / Ingest times are 3.6 hours / 7.5 hours respectively. For GPU accelerated ingestion of 10M vectors, when scaling Embedding NIM from Scale 1X to 8X there is a 8X reduction in Embed time (28.5 hours to 3.6 hours) with a 5.7X increase in number of GPUs (0.75 GPU to 4.25 GPUs).
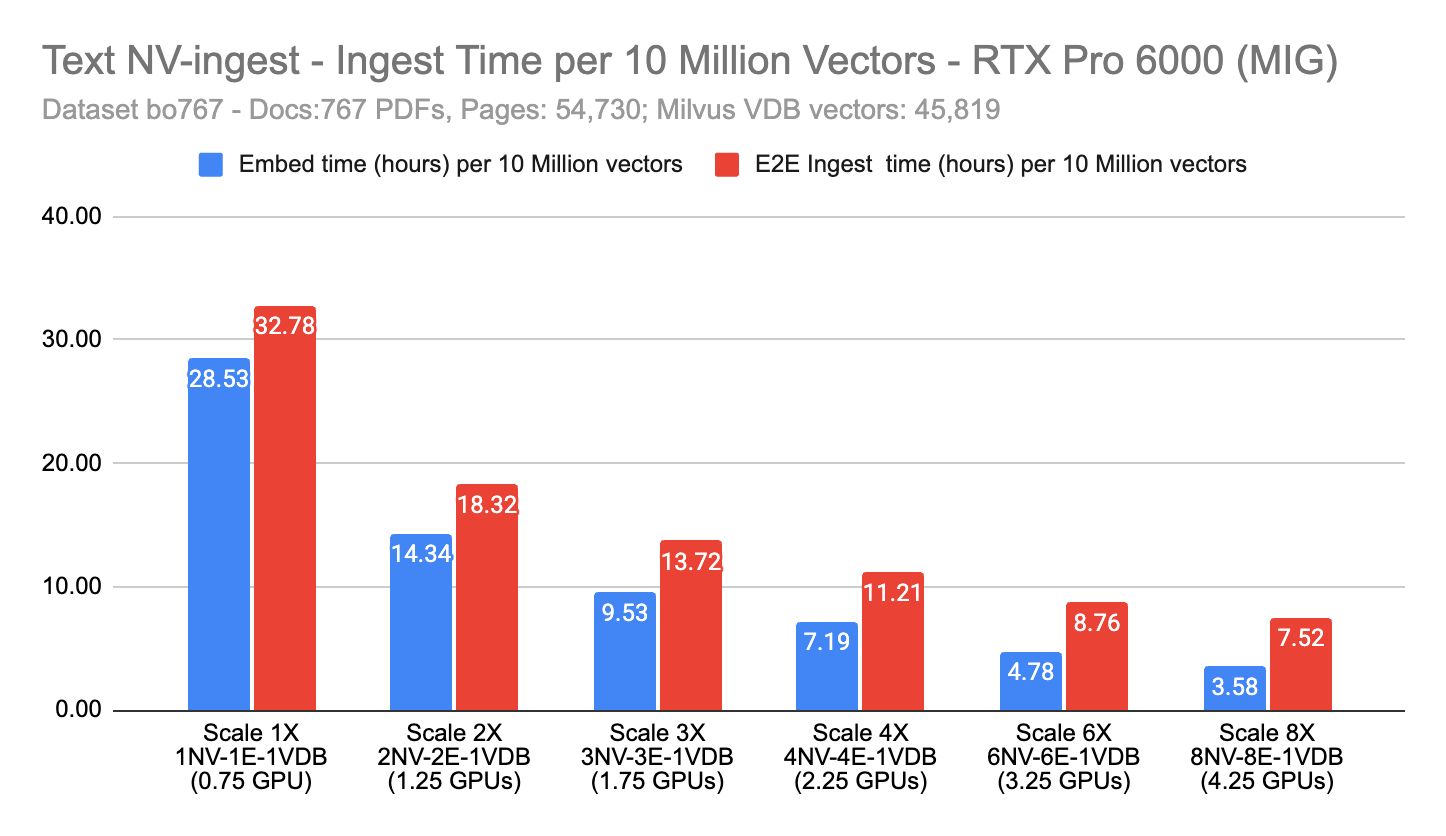
Figure 31 Embed time and E2E Ingest time for 10 Million vectors with Text-only NV-Ingest, decreasing proportionally from Scale 1X to Scale 8X.#
Wiki Text Bulk Ingest - Parquet Text-only Data#
When ingesting large amounts of S3 bucket parquet files with text-only data, use Vector DB Bulk Ingest (Python) directly outside the RAG ingestion pipeline. Using Python script to first parse parquet files in batches, then split text documents, tokenize, chunk then embed into batches. Store embeddings in MinIO object store bucket and then bulk ingest in 1GB segments (~100K embeddings) directly into Milvus Vector DB.
Dataset: Wikipedia dataset (parquet files) => 2.3 M documents, 10M vector embeddings (chunk size 256/50, 2048 dim X FP32).
Wiki Text Bulk Ingest uses Python scripts to achieve high performance ingestion for text-only data. Increase document concurrency with multiple concurrent batches(threads) of 1K documents each.
The python scripts provide more granular control to batch and parallelize each task (parsing, tokenizing, chunking, embedding, and Milvus ingest), preprocess data and store for later processing and bulk ingestion into Milvus Vector DB (CPU-only).
CPU: Wiki Text Bulk Ingest#
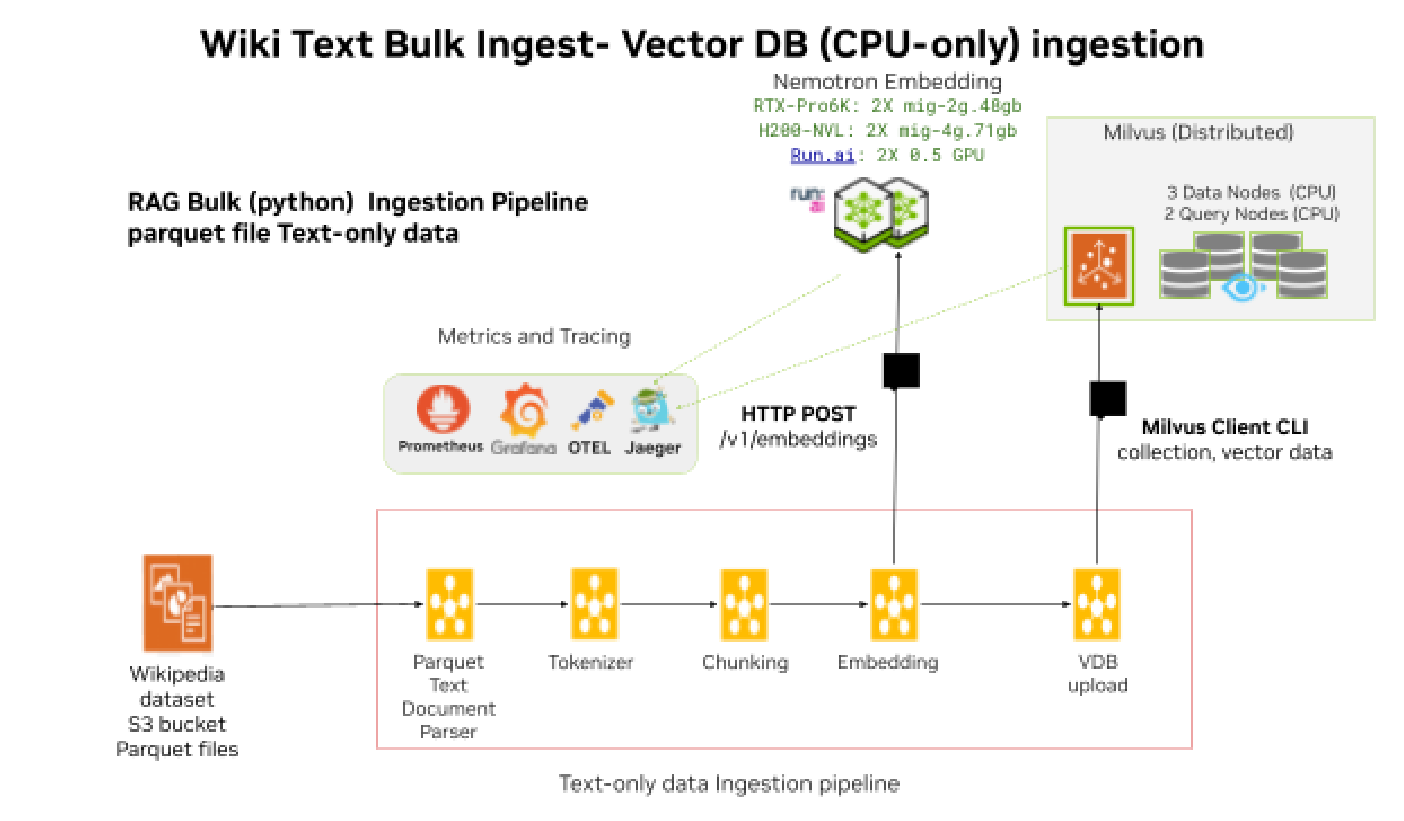
Figure 32 CPU only Wiki Text Bulk Ingest#
Use MIG profiles for Embedding NIM or time slicing with Run:ai GPU fractions to optimize GPU utilization and scale out Embedding NIM to achieve high document embedding rates.
Traditional Milvus Vector DB Ingestion using CPU-only:
NIM or service |
MIG RTX PRO 6K |
MIG H200 NVL |
Run:ai GPU fraction |
CPU/Mem |
|---|---|---|---|---|
llama-nemotron-embed-1b-v2 |
mig-2g.48gb |
mig-4g.71gb |
0.5 GPU |
1 vCPU, 8 GiB |
Milvus 2 X Data node |
NA |
NA |
NA |
2 X [16 vCPU, 32 GiB] |
Milvus 2 X Query node |
NA |
NA |
NA |
2 X [16 vCPU, 40 GiB] |
Ingestion includes 3 tasks with latency distribution as shown below:
Data Extraction [3% of time] - Parsing the documents in batches and extracting the text followed by Tokenization; converting the text data to tokens and lastly splitting the data into chunks based on selected Chunk Size.
Embedding [56% of time] - send multiple batches of chunked data to Embedding NIM service to create vector embedding on specified dimensions.
Vector DB ingestion [41% of time] - send multiple batches of embeddings to Vector DB for ingestion which includes index building, ingesting data and storing data in object store MinIO or writing to disk.
The first 2 tasks, Text Data Extraction and Embedding typically account for ~50% of the end-to-end data ingestion time. It is recommended to preprocess the data ahead of time, ideally as soon as the data is created. Perform Data Extraction (Parse, Tokenize, Chunk) and Embedding ahead of time and store the vector embeddings as NumPy files for later ingestion into Milvus Vector DB directly. This can save ~30-40% of end-to-end data ingestion time.
Vector DB ingestion using CPU accounts for ~40% of the end-to-end ingestion time and can be reduced significantly (~85%) by using GPU accelerated ingestion. Index building typically accounts for the majority (60%) of the Vector DB ingestion time. Using Milvus with GPU CAGRA (cuVS) for indexing can speed up index build time by 8X-10X and overall end-to-end (e2e) ingestion time by 4X-8X based on the amount of data ingested and the recall percentage (95%).
GPU: Wiki Text Bulk Ingest#
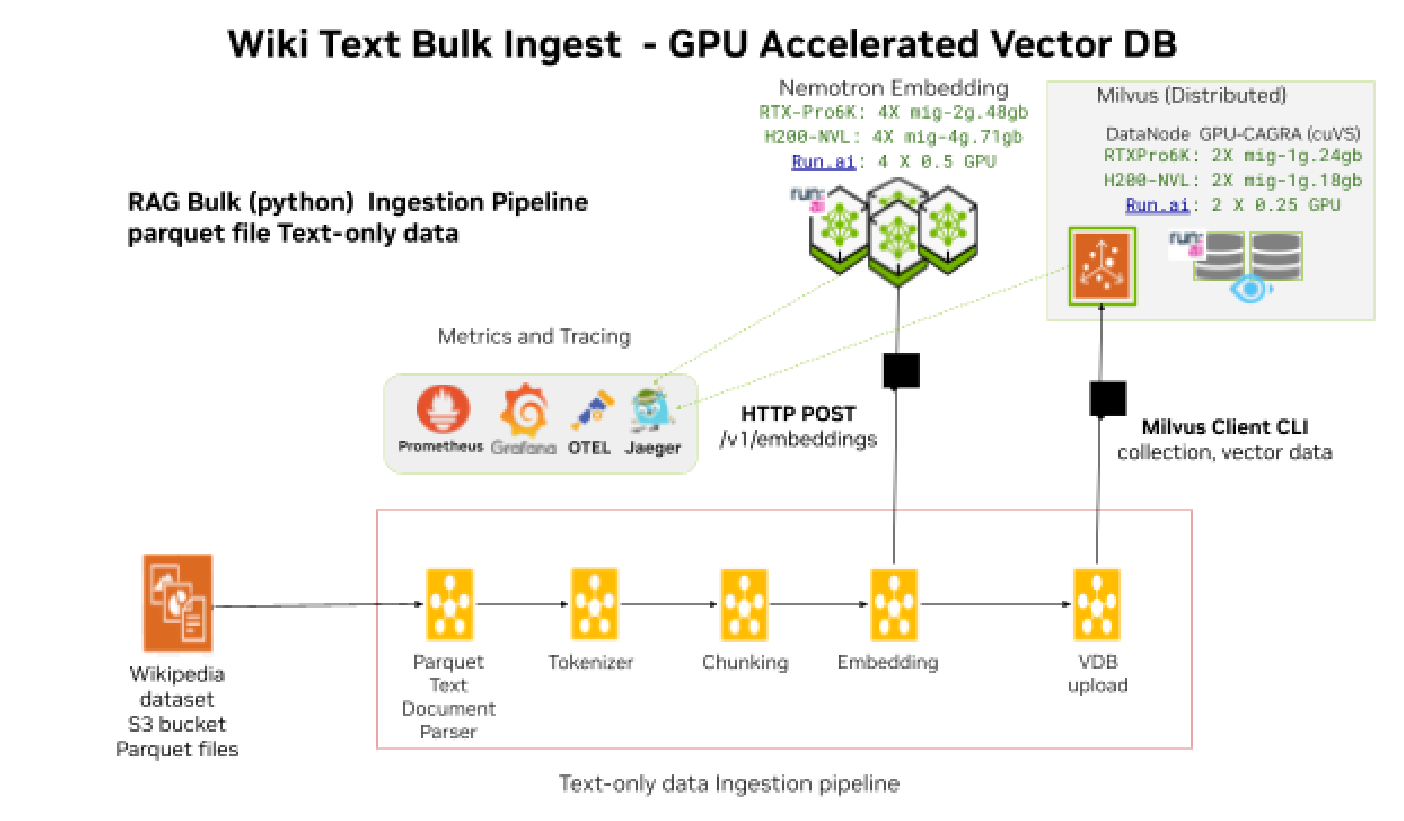
Figure 33 GPU-CAGRA Wiki Text Bulk Ingest#
Use MIG profiles for Embedding NIM and Milvus DataNode or enable Run:ai time slicing with fractional GPUs to optimize GPU utilization and scale out Embedding NIM and DataNode to achieve high document ingestion rates.
Wiki Text Scale 1X (0.75 GPU) - Baseline |
MIG RTX PRO 6K |
MIG H200 NVL |
Run:ai GPU fraction |
CPU/Mem |
|---|---|---|---|---|
1 Embedding NIM — llama-nemotron-embed-1b-v2 |
mig-2g.48gb |
mig-4g.71gb |
0.5 GPU |
1 vCPU, 8 GiB |
Milvus 1 X Data node |
mig-1g.24gb |
mig-1g.18gb |
0.25 GPU |
16 vCPU, 32 GiB |
Milvus 2 X Query node |
NA |
NA |
NA |
2 X [16 vCPU, 40 GiB] |
Table 10. Wiki Text Bulk Ingest Time Distribution: CPU vs GPU
Wiki Text Bulk Ingestion with cuVS (GPU CAGRA) speeds up VDB ingestion time by 6X and reduces end-to-end E2E ingestion time by ~35% as shown below:
Data Extraction [5% of time] - Parse Text, Tokenize and Chunk
Embedding [85% of time] - create vector embeddings
Vector DB ingestion [10% of time] - Build Index, Ingest and Store (Write)
% of Time distribution |
CPU based Ingestion |
GPU based Ingestion |
|---|---|---|
Data Extraction |
3% (0.21 hours) |
4% (0.2 hours) |
Embedding |
56% (4.56 hours) |
86% (4.53 hours) |
Vector DB ingestion |
41% (3.31 hours) |
10% (0.51 hours) => 6X faster |
End-to-End Ingestion time |
8.08 hours |
5.24 hours => ~35% reduction |
Let’s take a deeper dive into Wiki Text Bulk Ingest comparing GPU CAGRA with CPU HNSW when ingesting large amount of text data.
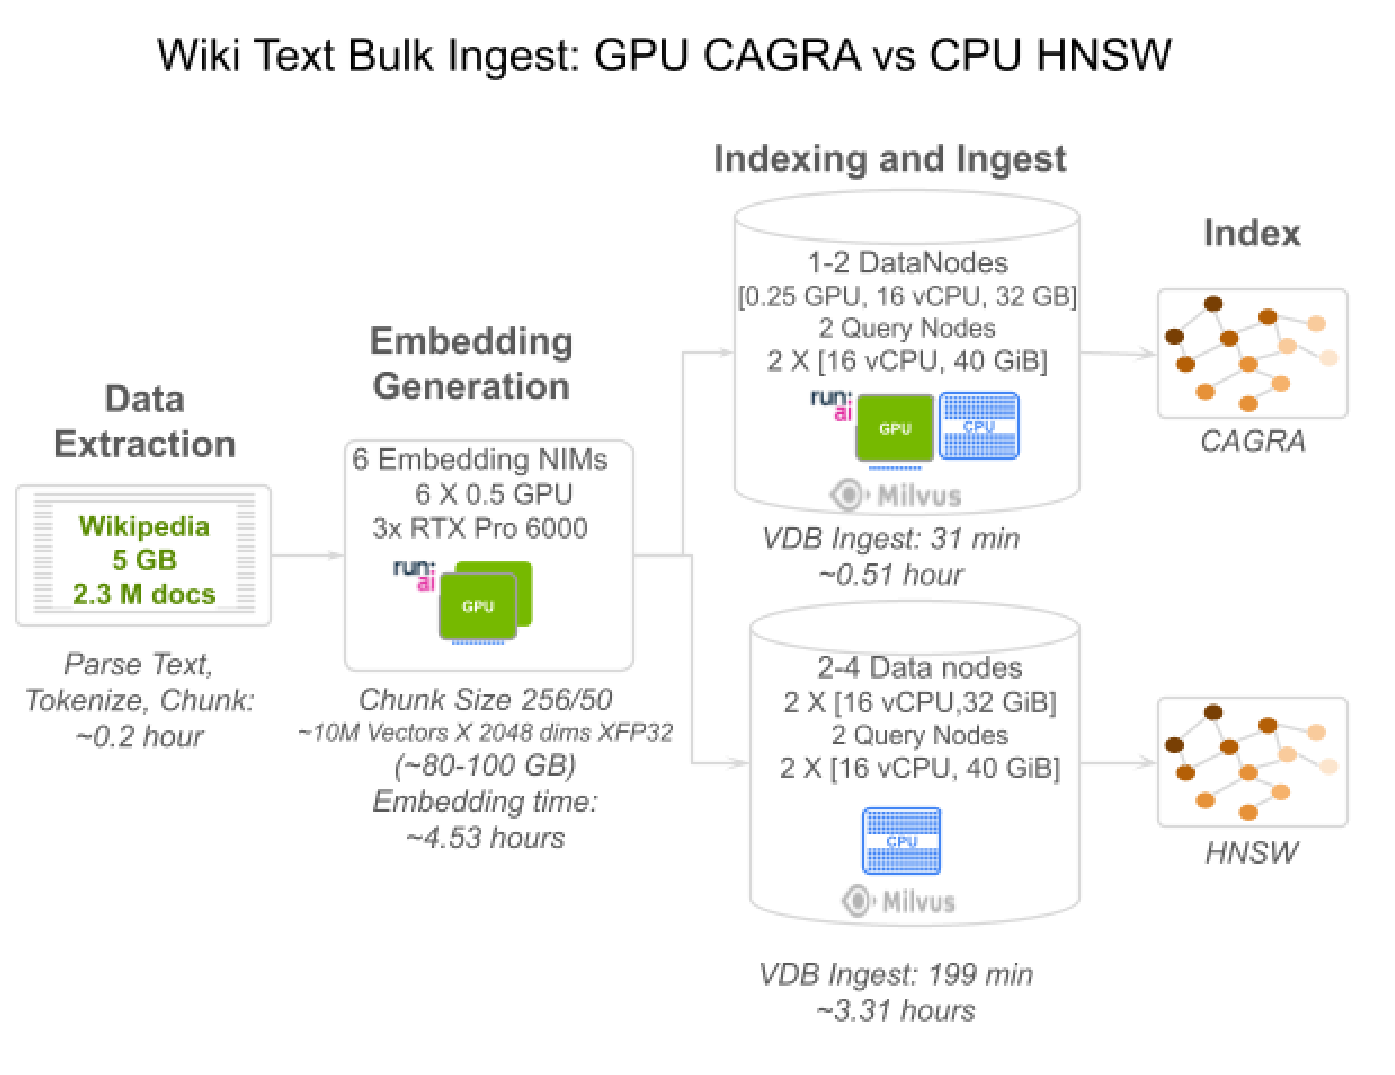
Figure 34 Wiki Text Bulk Ingest: GPU CAGRA vs CPU HNSW#
In the test above, the goal is to ingest partial Wikipedia (2.3 M documents, 5 GB raw data) into Milvus. After parsing and processing the data, it is sent to Embedding NIM service and vector embeddings are stored to disk as NumPy files for later ingestion into Milvus vector DB.
Vector DB ingest time for 10M embeddings for CPU HNSW Vector DB ingestion takes ~6X times longer than GPU CAGRA based Vector DB ingestions. This can have a much larger impact when ingesting >20 GB raw data or > 40M embeddings where ingestion takes days with CPU and only a few hours with GPU CAGRA.
Wiki Text - Ingestion Performance Tests and Results#
The chart below shows the Embed rates and E2E Ingest rates are scaling linearly from Scale 1X to Scale 6X (Concurrency=[8,16,32,48]).
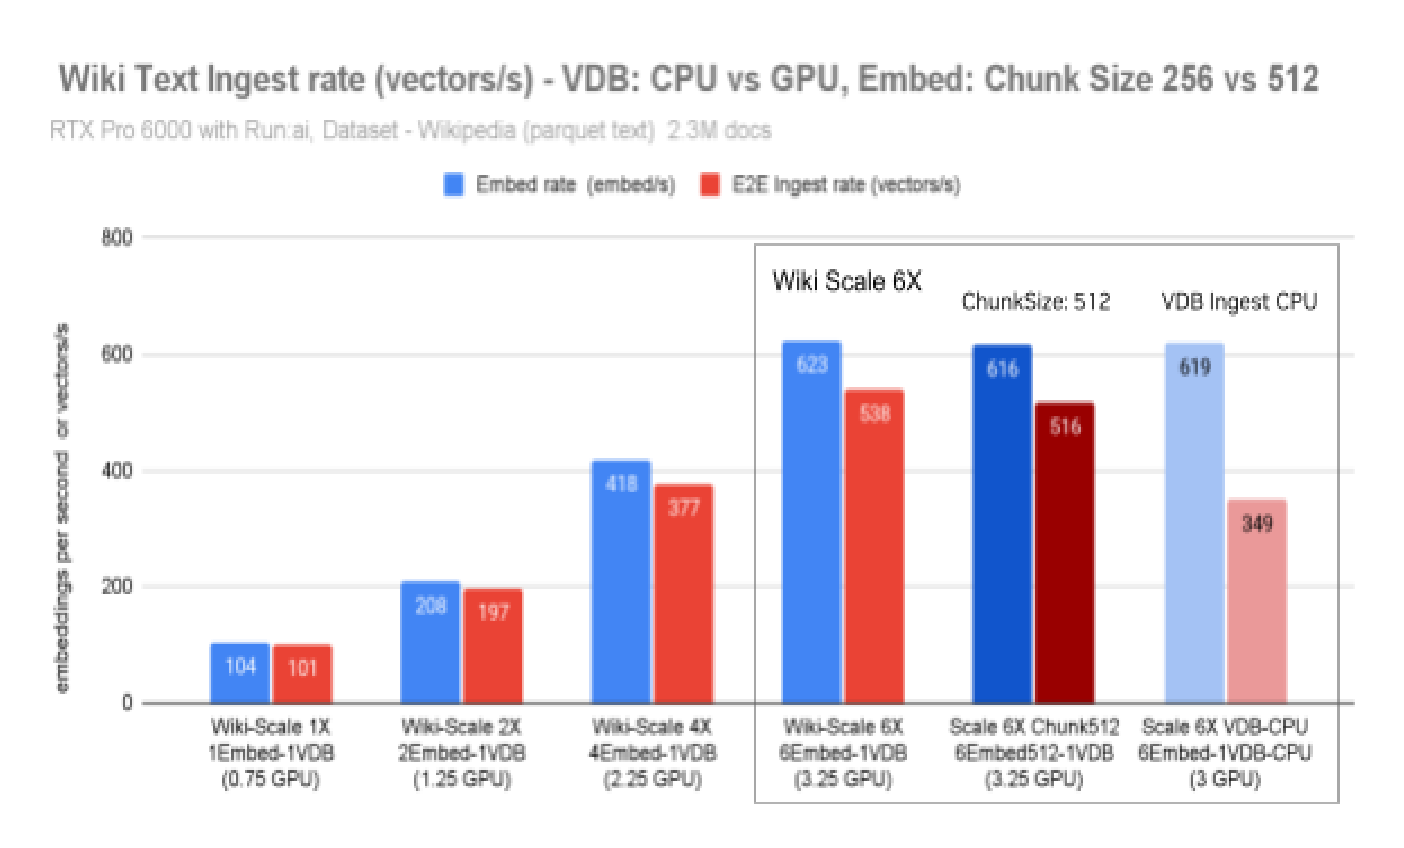
Figure 35 Wiki Text Embed rates and E2E Ingest rates scaling linearly from Scale 1X to Scale 6X (Concurrency=[8,16,32,48]).#
The chart below shows, for Chunk size 512/150, document Ingest rate increases by ~2X and for Milvus CPU ingestion, document Ingest rate drops by ⅓.
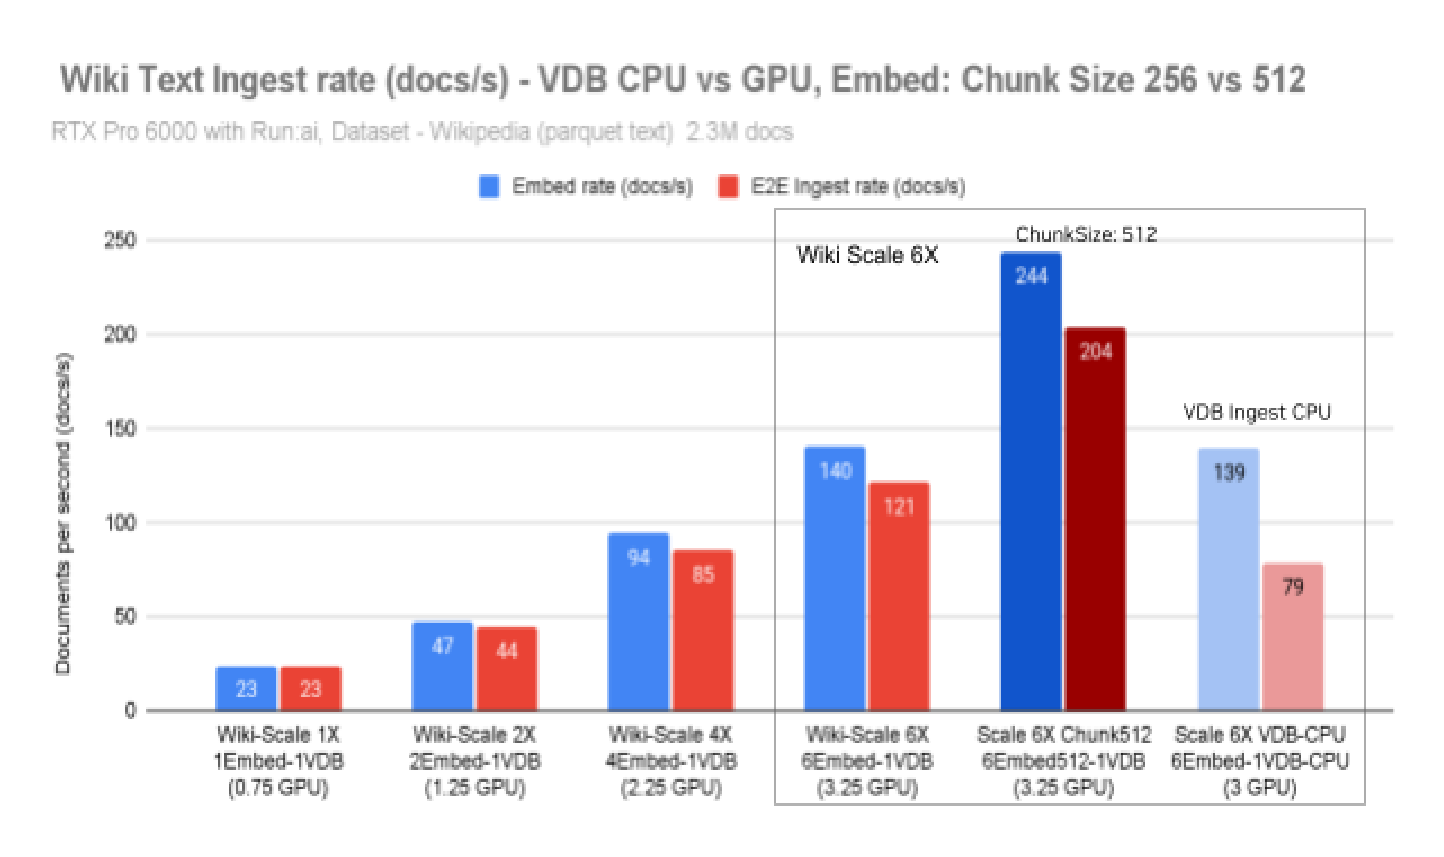
Figure 36 Wiki Text document Ingest rate comparison: Chunk size 512/150 increases ingest rate by ~2X; Milvus CPU ingestion reduces ingest rate by ⅓.#
Table below shows summary of results for Wiki Text Scale 1X - 6X with Concurrency CR= [8, 16, 32, 48]:
Label |
Configuration |
Ingestion rates |
Resources |
|---|---|---|---|
Wiki Scale 1X — 1Embed-1VDB cuVS — CR: 8, CS:256/50 — GPU: 0.75, CPU:17 |
1 Embed, 1 Milvus (1 Data Node) — Chunk Size (CS): 256/50 — Concurrency(CR): 8, Batch Size: 200 docs |
Embed: 104 vectors/s — Embed: 23 docs/s — E2E Ingest: 23 doc/s |
GPU=0.5 (Embed) + 0.25 (Milvus) = 0.75 GPUs — CPU= 1 (Embed) + 16 (Milvus) = 17 vCPUs |
Wiki Scale 2X — 2Embed-1VDB cuVS — CR:16, CS:256/50 — GPU: 1.25, CPU:18 |
2 Embed, 1 Milvus (1 Data Node) — Chunk Size (CS): 256/50 — Concurrency(CR): 16, Batch Size: 200 docs |
Embed: 208 vectors/s — Embed: 47 docs/s — E2E Ingest: 44 doc/s |
GPU: 1.25 — CPU: 18 |
Wiki Scale 4X — 4Embed-1VDB cuVS — CR:32, CS: 256/50 — GPU: 2.25, CPU:20 |
4 Embed, 1 Milvus (1 Data Node) — Chunk Size (CS): 256/50 — Concurrency(CR): 32, Batch Size: 200 docs |
Embed: 418 vectors/s — Embed: 94 docs/s — E2E Ingest: 85 doc/s |
GPU: 2.25 — CPU: 20 |
Wiki Scale 6X — 6Embed-1VDB cuVS — CR:48, CS:256/50 — GPU: 3.25, CPU:22 |
6 Embed, 1 Milvus (1 Data Node) — Chunk Size (CS): 256/50 — Concurrency(CR): 48, Batch Size: 200 docs |
Embed: 623 vectors/s — Embed: 140 docs/s — E2E Ingest: 121 doc/s |
GPU: 3.25 — CPU: 22 |
Wiki Scale 6X — 6Embed512-1VDB cuVS — CR:48, CS:512/150 — GPU: 3.25, CPU:22 |
6 Embed, 1 Milvus (1 Data Node) — Chunk Size (CS): 512/150 — Concurrency(CR): 48, Batch Size: 400 docs |
Embed: 616 vectors/s — Embed: 244 docs/s — E2E Ingest: 204 doc/s |
GPU: 3.25 — CPU: 22 |
Wiki Scale 6X — 6Embed-1VDB CPU — CR:48, CS:256/50 — GPU: 3, CPU:30 |
6 Embed, 1 Milvus (1 Data Node) — Chunk Size (CS): 256/50 — Concurrency(CR): 48, Batch Size: 200 docs |
Embed: 619 vectors/s — Embed: 139 docs/s — E2E Ingest: 79 doc/s |
GPU: 3 (Embed only) — CPU: 30 |
TCO - Wiki Text Ingest - Cost Per 10 Million Vectors#
The TCO Cost ($) for ingesting 10 Million Vectors with GPU acceleration for Embedding and Milvus Vector DB with cuVS (CAGRA index) remains fairly stable at $14.60 and $1.11 respectively when scaling Embedding NIM Scale from 1X (0.5 GPU) to 6X (3 GPUs) with Milvus VDB static allocation of 1 Data node (0.25 GPU). This indicates linear scaling for the Embedding NIM.
For Milvus Ingest of 10M vectors using CPU-only (no GPU acceleration), the Vector DB Index/Ingest Cost ($) increases by 6X from $0.98 to $6.06. The TCO E2E ingest Cost($) for 10 Million vectors increases by 40% (~$5), jumps to $19.12.
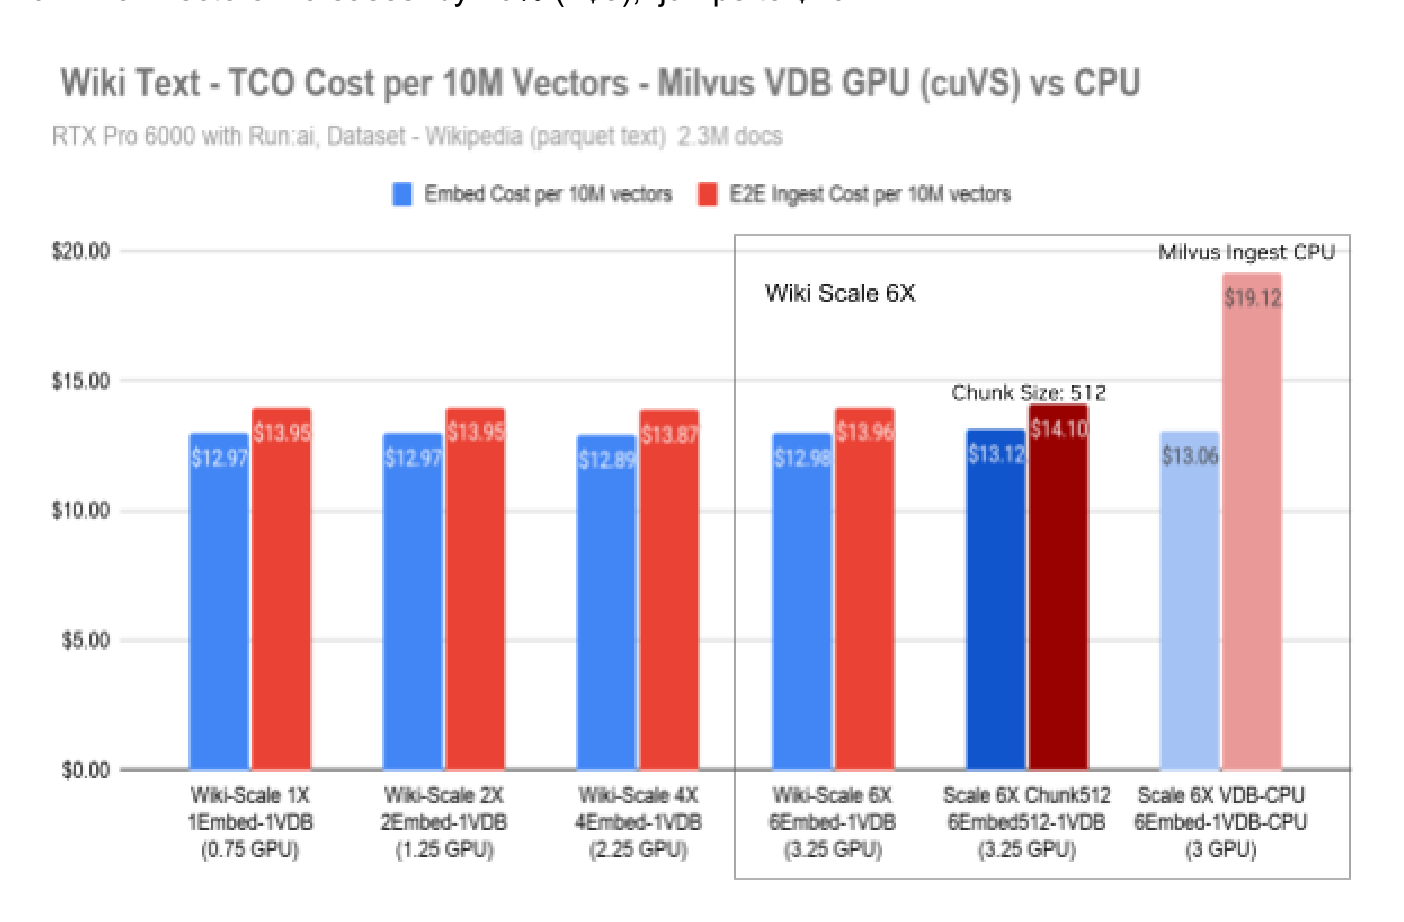
Figure 37 TCO Cost per 10 Million Vectors for Wiki Text Ingest. Cost remains stable at ~$14.60 when scaling with GPU acceleration; CPU-only raises TCO by ~40% to $19.12.#
For GPU accelerated Embedding and Milvus (cuVS), the Embed time and E2E ingest time for 10 Million vectors decreases proportionally when scaling from Scale 1X to Scale 6X, as seen in the chart below. For Scale 1X (0.75 GPU) the Embed time and E2E Ingest time are 27 hours and 31 hours respectively and for Scale 6X (3.25 GPU) Embed / Ingest times are 4.5 hours / 8.5 hours respectively. For GPU accelerated ingestion of 10M vectors, when scaling Embedding NIM from Scale 1X to 6X there is a 6X reduction in Embed time (27 hours to 4.5 hours) with a 4X increase in number of GPUs (0.75 GPU to 3.25 GPUs).
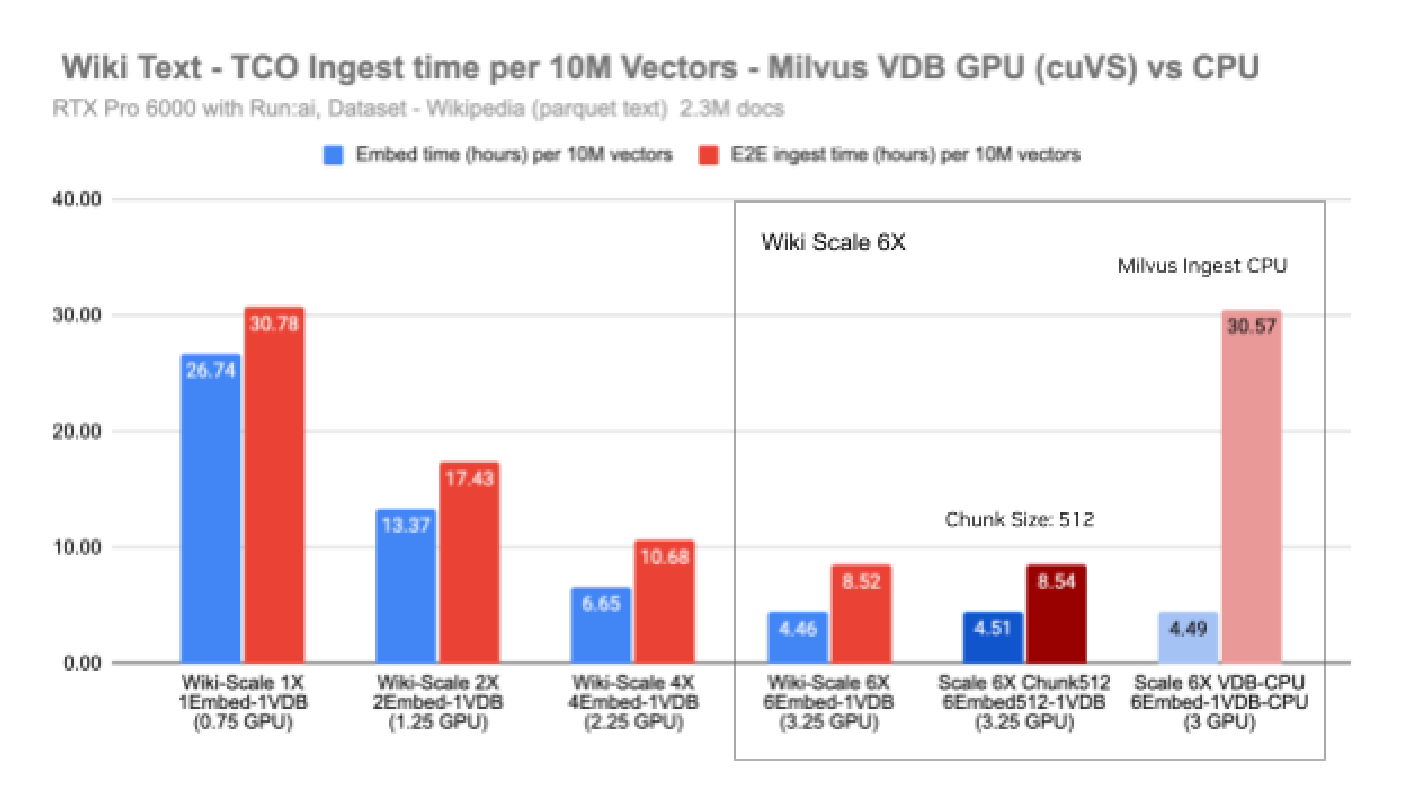
Figure 38 Embed time and E2E Ingest time for 10 Million vectors with Wiki Text Ingest, decreasing proportionally from Scale 1X to Scale 6X.#
For Milvus Ingest using CPU only (no GPU acceleration), not only does the Vector DB Index/Ingest Cost ($) increase by 5.5X but also the E2E Ingest time increases by 3.6X from 8.54 hours to 30.57 hours.
Optimizing Wiki Text Bulk Ingestion#
Wiki Text Bulk Ingestion with cuVS (CPU CAGRA) speeds up the ingestion and drastically reduces end-to-end (e2e) ingestion time by ~35% (6X improvement) as shown below:
Data Extraction [4% of time] - Parse Text, Tokenize and Chunk
Embedding [86% of time] - create vector embeddings
Vector DB ingestion [10% of time] - Build Index, Ingest and Store (Write)
Improve the embedding time, by scaling out (weak scaling) or scaling up (strong scaling) the embedding NIM (2-4 GPUs). In addition, increase batch concurrency (CR); concurrent active documents being uploaded CR: 8,16,32,48,64 etc. This resolves the compute bottleneck in the ingestion pipeline.
Increasing Embed batch concurrency (using multiple async threads), parallelizes the ingestion tasks and increases the throughput up to saturation point after which the Embedding NIM needs to be scaled out.
To improve data extraction efficiency, preprocess data at source when created and save as Markdown format. To speed up tokenization, pre-download the right tokenizer to reduce network IO calls to HuggingFace.
Store vector embeddings in object store (MinIO S3 bucket) for later bulk ingestion into vector DB can save 70-90% of VDB ingestion time. Stored vector embeddings can be bulk ingested into Milvus Vector DB in batches during off-peak hours with GPU acceleration (GPU CAGRA).
All the 3 tasks listed above are parallelized using batches with batch sizes as specified below:
Enable concurrency (async threads) with simulating multiple active users with concurrent document requests CR: 8,16,32,48,64 etc.
Data extraction batch size 200-400 documents (parse text, tokenize and chunk).
Embedding batch size 1000 chunks (create vector embeddings).
Vector DB bulk upload using 1GB segment of ~100K embeddings.
Reducing the embedding dimensions from 2048 to 1024 or reducing quantization from FP32 to FP8 or binary can speed up ingestion by 4X but sacrifices Search Recall by a 3%-7% and Retrieval Accuracy.