

RAG Ingestion Pipeline Workflow#
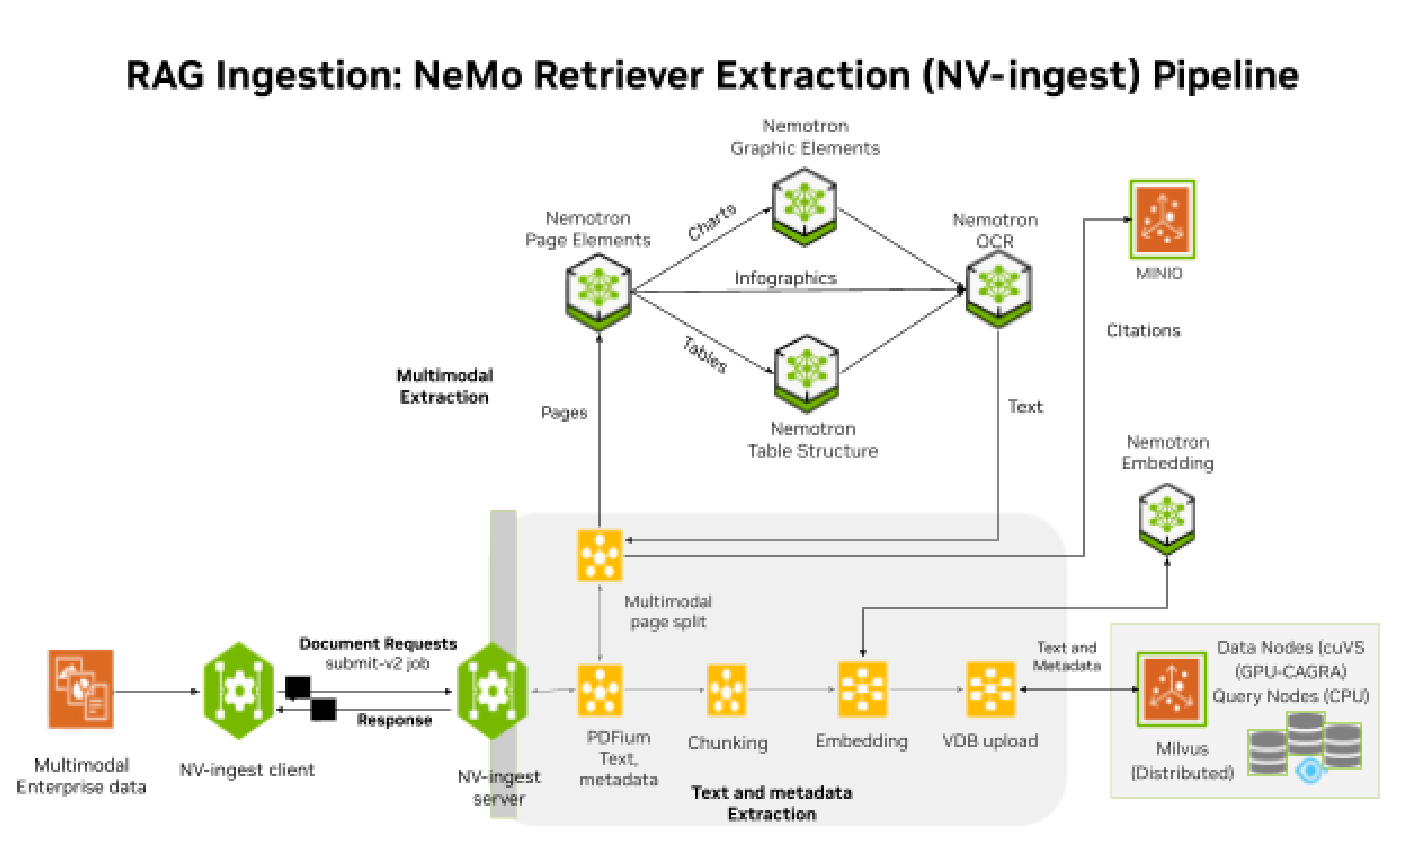
Figure 1 RAG Ingestion - NeMo Retriever Extraction (NV-Ingest) pipeline#
For performance benchmarking the RAG ingestion pipeline use the NV-Ingest client directly from the NeMo Retriever extraction library. Install the NeMo Retriever extraction (NV-Ingest) application for enterprise data ingestion including: NV-Ingest server, Redis message broker, extraction NIM, Embedding NIM and Milvus Vector DB in the Kubernetes cluster using instructions provided in the Enterprise RAG Deployment Guide.
NV-Ingest Client Workflow#
The NV-Ingest client sends PDF documents from the document source path provided to the NV-Ingest server for multimodal data extraction. The documents are uploaded as requests (submit-v2 jobs) based on the specified concurrency and batch_size.
Client Side Concurrency#
The concurrency defines the number of concurrent document requests. It defines the number of client threads, where each client handles one document (one “job”) at a time (files per client=1) and waits (blocks) for results. It sends a http-submit-v2-job request to the NV-Ingest server (Redis queue) for processing. Once the document is processed and results are received, the client picks the next document in the queue.
Example: concurrency=96 implies there can be 96 document requests to the NV-Ingest server. It does not imply 96 documents are actively being processed, this depends on server side concurrency (server side workers).
When using high concurrency of 64 or higher ensure that the NV-Ingest client benchmarking server has sufficient CPU capacity to run 64 or higher client worker threads.
Client Side Batching#
The batch_size is how many documents the client treats as one “batch” for scheduling. The maximum number of outstanding documents that can be sent to the server for processing at any given time. The NV-Ingest client main thread feeds the queue in chunks of documents or “batches” and clients keep taking jobs from the queue. Once all documents in the batch have been sent to the server and received by server (but may not be processed as yet), the main client thread adds the next batch-size of files to the client queue.
Example: batch_size=192, client feeds a batch of 192 documents to the queue. For the dataset bo767 dataset with 767 pdfs, it will take 4 batches (767 → 4 batches: 192, 192, 192, 191) to process all documents. For concurrency=96, each of 96 workers will send ~2 document requests per batch.
When using large batch_size of 192 or higher allocate sufficient memory for the Redis (12 GiB) during NV-Ingest Helm deployment; to hold additional documents during extraction to avoid getting Kubernetes OOM-kill.
It is important to select the client concurrency and batch_size to maximize document ingestion performance and achieve the optimal page throughput.
NV-Ingest Server Workflow#
On the server side, the NV-Ingest server acts as the data orchestrator for multimodal data ingestion. As document requests are received from the client they are put into the Redis message broker queue. The server-side workers process documents in 32-page-chunks at a time, extracting text, metadata, tables, charts and images using extraction NIM microservices. The extracted text data is tokenized, chunked (if needed) and sent to embedding NIM to create embeddings stored in MINIO bucket. The vector embeddings are bulk ingested into Milvus vector DB and data is now ready for retrieval. As documents are processed, embedded and ingested, server workers send results, metrics and trace data to prometheus and open telemetry collectors (jaeger or zipkin).
Server Side Concurrency#
Server side workers start processing document requests or jobs from the Redis queue. The
number of concurrent documents that can be processed at a time depends on the workers
configured at Helm deployment, MAX_INGEST_PROCESS_WORKERS (and
NV_INGEST_MAX_UTIL) and the number of page-chunks per document.
MAX_INGEST_PROCESS_WORKERS: Ingestion pipeline concurrency or number of workers that run the ingestion pipeline. It defines the number of 32-page-chunks that are simultaneously being processed in the pipeline. The pages per chunk is defined by
PDF_SPLIT_PAGE_COUNT(default: 32 pages). Each worker processes up to 32 pages simultaneously across 4 pipelines of 8 pages each. If each document has on average 32 pages, then each worker processes ~1 document at a time.NV_INGEST_MAX_UTIL: A cap on concurrency; Limits how many threads/tasks the service can create in total for ingestion. So it’s a ceiling above which the engine won’t add more work, even if the client sends more.
Note
Allocate sufficient CPU and memory (RAM) capacity to NV-Ingest for workers at Helm deployment.
For NV-Ingest MAX_INGEST_PROCESS_WORKERS=32 set resources requests 16 vCPU, 32 GiB RAM.
Scale NV-Ingest workers inline with the document concurrency required, so that the document requests are being processed as soon as they are created.
Document Concurrency Example#
NV-Ingest server side concurrency defined by available workers needs to scale in sync with the Client side document requests. Each worker processes a block of 32 pages at a time (default pages per chunk =32 pages) at a time. Document Concurrency (CR) is determined by the number of workers and average number of page-chunks per document.
Consider an example using dataset digital corpora - bo767 with NV-Ingest Workers=32:
Dataset: digital corpora - bo767 => 767 PDFs; pages: 54,730; tables: 23,323; total_charts: 7835; elements: 85,888; embeddings: 76,868.
Average page per document = 71
Given:
NV-Ingest Workers = 32 (MAX_INGEST_PROCESS_WORKERS)
pages_per_chunk = 4 pipelines × 8 pages = 32 pages (PDF_SPLIT_PAGE_COUNT)
bo767 avg_pages_per_doc = 71
Number of page-chunks per document:
page_chunks_per_doc = avg_pages_per_doc / pages_per_chunk
                    = 71/32
                    = 2.22
Effective document concurrency:
Concurrency CR = Workers / page_chunks_per_doc = 32 / 2.22 ≈ 14.4
Actual Concurrent documents → ~14–15 documents
Document Concurrency formula:
On the NV-Ingest client set Concurrency=16 for Baseline Scale 1X => 1 NV-Ingest instance (replica) with Workers=32:
Concurrency (CR) = NVingest_replicas x Workers x
                   (pages_per_chunk) / avg_pages_per_doc
                 = 1 x 32 × 32 / 71
                 = 1,024 / 71
                 ≈ 14-15 documents
To increase document concurrency=32, scale out the NV-Ingest service to Scale-2X => 2X NV-Ingest instances (replicas), with Workers = 2 x 32 = 64.
Total NV-Ingest Workers = 2 X 32 Workers per pod = 64.
Batch Size = 64, is the maximum number of documents that can be uploaded to the Redis server at any given time. Redis must have sufficient cache memory resources to hold documents before they can be processed by NV-Ingest workers.
Batch Size >= Concurrency so that NV-Ingest clients can achieve the document concurrency requested.
Scaling Recommendation:
Document Concurrency (CR) = NVingest_replicas x Workers x
                            pages_per_chunk / avg_pages_doc
Batch Size (BS) = 2 X Concurrency (CR)
For the bo767 dataset with 767 PDF files; scale NV-Ingest workers along with the document concurrency (CR):
NV-Ingest Scale |
Workers |
Document Concurrency (CR) |
Client Batch Size (BS) |
Effective Concurrency (server) |
# of Batches 767/BS |
|---|---|---|---|---|---|
Scale 1X — 1 NV-Ingest |
32 |
16 |
32 |
14.4 |
24 |
Scale 2X — 2 NV-Ingest |
64 |
32 |
64 |
28.9 |
12 |
Scale 3X — 3 NV-Ingest |
96 |
48 |
96 |
43.3 |
8 |
Scale 4X — 4 NV-Ingest |
128 |
64 |
128 |
57.7 |
6 |
Scale 6X — 6 NV-Ingest |
192 |
96 |
192 |
86.5 |
4 |
Text and Metadata Extraction#
Each server worker processes one job or document request at a time. For PDF documents PDFium is used to parse text and metadata — it runs extract with 4 pipelines and packs 32 pages into a submit-v2 call with 4 pipelines: 0–3, 8 pages each.
For text-only data extraction, you can set text_depth to document or use page (default) to
extract the text content and then later perform more chunking. For retrieval and evaluation
page depth is recommended.
Once text data on a page or document is parsed, it is tokenized using a pre-downloaded tokenizer. More chunking can be performed where data is split into smaller chunks based on Chunk Size defined as tokens (128/256/512 tokens) before it is sent for embedding.
Multimodal Data Extraction#
For multi-modal data extraction, a chunk of pages is sent to page elements NIM for object detection to determine if tables, charts or images are present on the page.
If tables are detected, then the relevant content is sent to the Nemotron table-structure NIM, to extract, rows, columns and cell data and convert to Markdown format.
If charts are detected, then content is sent to Nemotron graphic-elements to extract titles, legends, axes, and numerical values.
If images are detected, image content is sent to Nemotron OCR NIM to perform image captioning (if enabled).
Vector DB Bulk Upload#
Once all multimodal data on the page is converted to Text, it is sent to the embedding NIM for
creating vectors. One embedding vector is created for each table, chart or image detected.
Embeddings are temporarily stored in MINIO buckets and can be bulk uploaded to the
Vector database in 1GB segment size batches using the Ingestor.vdb_upload API.
Formula: Segment Size 1GB equates to ~100K embeddings (~1000 multimodal docs)
Segment Size (1GB) =
      100K embeddings X 2048dim X 4B(FP32) + 20% metadata-overhead
Evaluate Accuracy#
Once the data has been uploaded, indexed and ingested or loaded in the vector DB it is available for search and retrieval. Evaluate the retrieval recall accuracy for the dataset.
Performance Metrics and Tracing#
Enable telemetry metrics (prometheus and grafana) and tracing (OpenTelemetry Jaeger or zipkin) for NV-Ingest server side elements at helm deployment, including NV-Ingest service and extraction NIM microservices.
Use tracing data to determine data extraction time distribution for each service and scale out those NIM microservices. Using metrics on resource (GPU/CPU/Memory) consumption, enable Kubernetes autoscaling using HPA based on metrics e.g. KV-cache or GPU utilization metric.
NV-Ingest benchmarking needs to aggregate metrics and trace data from every document request to create batch traces that record the total latency distribution for all services in the pipeline to process all documents in the dataset.
Key Ingestion Performance Metrics#
Ingestion Metrics |
Description |
|---|---|
Extraction phase, Embed time and rate |
For text-only data, this is the time taken to parse the document, extract text and metadata. For multimodal data, this is the time taken to extract the text, tables, charts and image captions and convert to text format. It involves calling one or more extraction NIM microservices based on multimodal content found in the document. After extraction, documents are now available as text and may be stored in markdown format in the object store for further processing at a later point. Measured in terms of documents per second (dps) or pages per second (pps).
\[\text{Extraction rate} = \frac{\text{total pages in the dataset}}{\text{Extraction time}} \;\text{pages/second}\]
|
E2E Embed rate or time — Embed phase, Embed time or rate |
After the extraction phase, the converted text document is tokenized, chunked based on configured chunk size (256/50) and then sent to Embedding NIM to vectorize and create embeddings based on configured quantization (2048 dim. X FP32). Embedding time is the time taken to tokenize, chunk, and create embeddings for the extracted document text. Embeddings are stored in the MinIO object store bucket, ready to be ingested into the vector DB. For NV-Ingest benchmarking, the E2E Embed Phase/Time refers to the end-to-end time including extraction and embedding. The E2E Embed time varies as concurrency (CR) is increased and NV-Ingest instance, Embedding NIM microservices and Extraction NIM microservices are scaled out.
\[\text{Embed rate} = \frac{\text{total pages in the dataset}}{\text{Embed time}} \;\text{pages/second}
= \frac{\text{total documents in the dataset}}{\text{Embed time}} \;\text{docs/second}
= \frac{\text{total embeddings created}}{\text{Embed time}} \;\text{embed/second}
= \frac{\text{total embed requests received}}{\text{Embed time}} \;\text{requests/second}\]
|
Vector DB ingestion, upload, index or load time |
Time taken to upload the embeddings, using either streaming or bulk upload, to the vector database, followed by building the indexes, writing to disk and loading indexes for search. For NV-Ingest benchmarking use vector DB bulk upload where all embeddings from the dataset are uploaded in a batch of up to 1GB segments, up to ~100K embeddings or ~1000 multimodal documents. The Vector DB ingestion time includes time to upload, index build, store and load indexes ready for search and RAG retrieval. With NV-Ingest benchmarking for a specific dataset digital corpora-bo767, Vector DB ingestion time for one or more 1GB segments (up to ~100k embeddings) remains relatively unchanged as long as Milvus vector DB dataNode resources are not updated. |
E2E Ingestion time, rate |
End-to-end ingestion time includes time for data extraction, embedding and ingestion into the vector DB. E2E ingestion rate is measured in terms of documents per second (dps) or pages per second (pps), vectors per second (vectors/s).
\[\text{Ingestion rate} = \frac{\text{total pages in the dataset}}{\text{E2E Ingestion time}} \;\text{pages/second}
= \frac{\text{total documents in the dataset}}{\text{E2E Ingestion time}} \;\text{docs/second}
= \frac{\text{total vectors created}}{\text{Embed time}} \;\text{vectors/second}\]
|
Scaling Efficiency (%) |
With linear scaling, the RAG Ingestion performance needs to scale as the pipeline elements (NV-Ingest, NIM microservices, Vector DB) are scaled out. NV-Ingest Scale 2X implies the document ingestion performance in terms of Embed rate and document concurrency should double. Target Scaling Efficiency E (%) > 80%.
\[E(\%) = \frac{\text{Target (T) / Baseline(B)}}{\text{SpeedUp (S)}} \times 100\]
|
Ingestion Performance per $ (TCO) |
Performance per Total Cost of Ownership (TCO) dollar, or performance-per-$ measures the RAG ingestion compute (CPU/GPU) efficiency, or throughput achieved relative to the full investment cost. Embed Cost includes Extraction and Embedding cost. E2E Ingest Cost includes Extraction, Embedding and Vector DB ingest cost.
\[\text{Embed Cost per Million vectors (\$)} = \frac{\text{Embed GPUs} \times \text{GPU hourly cost}}{\text{Embed rate (vectors/s)} \times 3600} \times 1{,}000{,}000\]
\[\text{VDB Ingest Cost per Million vectors (\$)} = \frac{\text{VDB GPUs} \times \text{GPU hourly cost}}{\text{VDB ingest rate (vectors/s)} \times 3600} \times 1{,}000{,}000\]
|
NV-Ingest Extraction Document Trace#
Here is an example of NV-Ingest extraction document trace (Jaeger) for the Dataset: digital corpora bo767 with NV-Ingest 1X scale on Run:ai RTX PRO 6000 deployment.
NV-Ingest trace for a large document with 222 pages with 222/32 => 7 traces (32 page chunk). Majority of the time is at pdf_extractor_channel_in (7.24s) queue wait time for pdfium and page-elements NIM; followed by actual PDF Extraction (6.39s) performed by NV-ingest microservice.
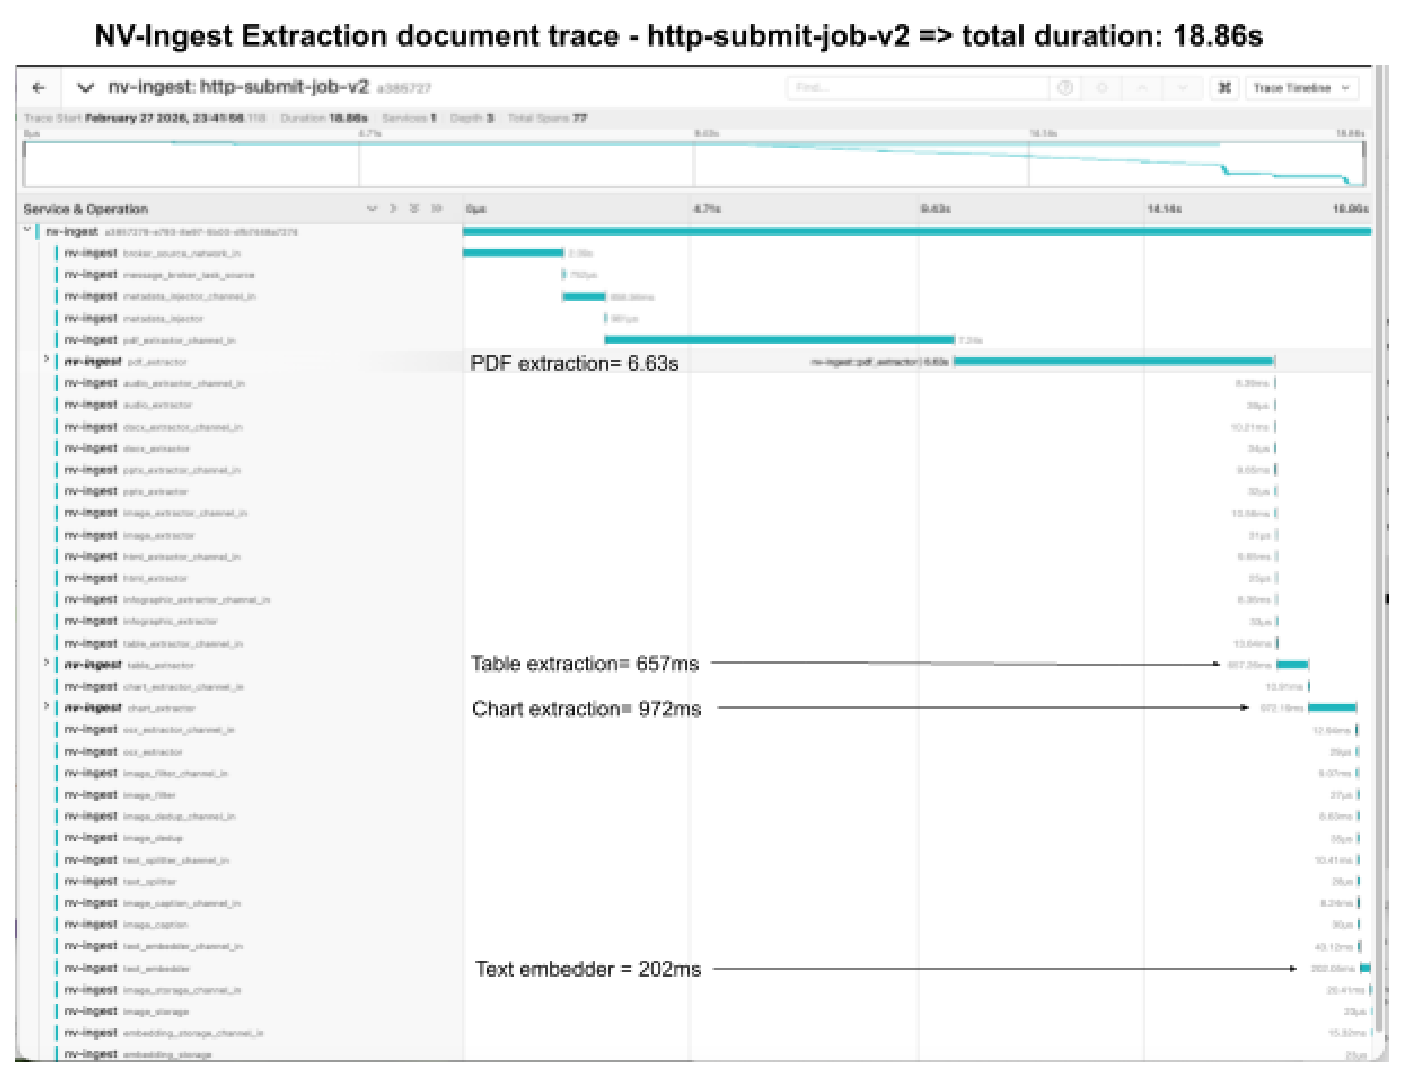
Figure 2 NV-Ingest extraction document trace (Jaeger) for dataset digital corpora bo767 with NV-Ingest 1X scale on Run:ai RTX PRO 6000 deployment.#
NV-Ingest Latency and Queue Charts#
Here is a batch trace summary of latency distribution for NV-Ingest benchmark run for Dataset: digital corpora - bo767 (767 PDFs) with NV-Ingest 1X scale on Run:ai RTX PRO 6000 deployment.
For the data ingestion latency distribution chart below, the majority ~60% of the end-to-end E2E ingestion time is spent on data extraction; with PDF render (61% NV-Ingest CPU bound), table text extraction (14% nemotron-ocr) and PDF pipeline (12.3% page_elements NIM) accounting for most of the extraction latency. Of the remaining 40% in E2E ingestion time, 33% is spent on Text Embedding and 7% on Vector DB Bulk ingestion (upload, index and store vectors).
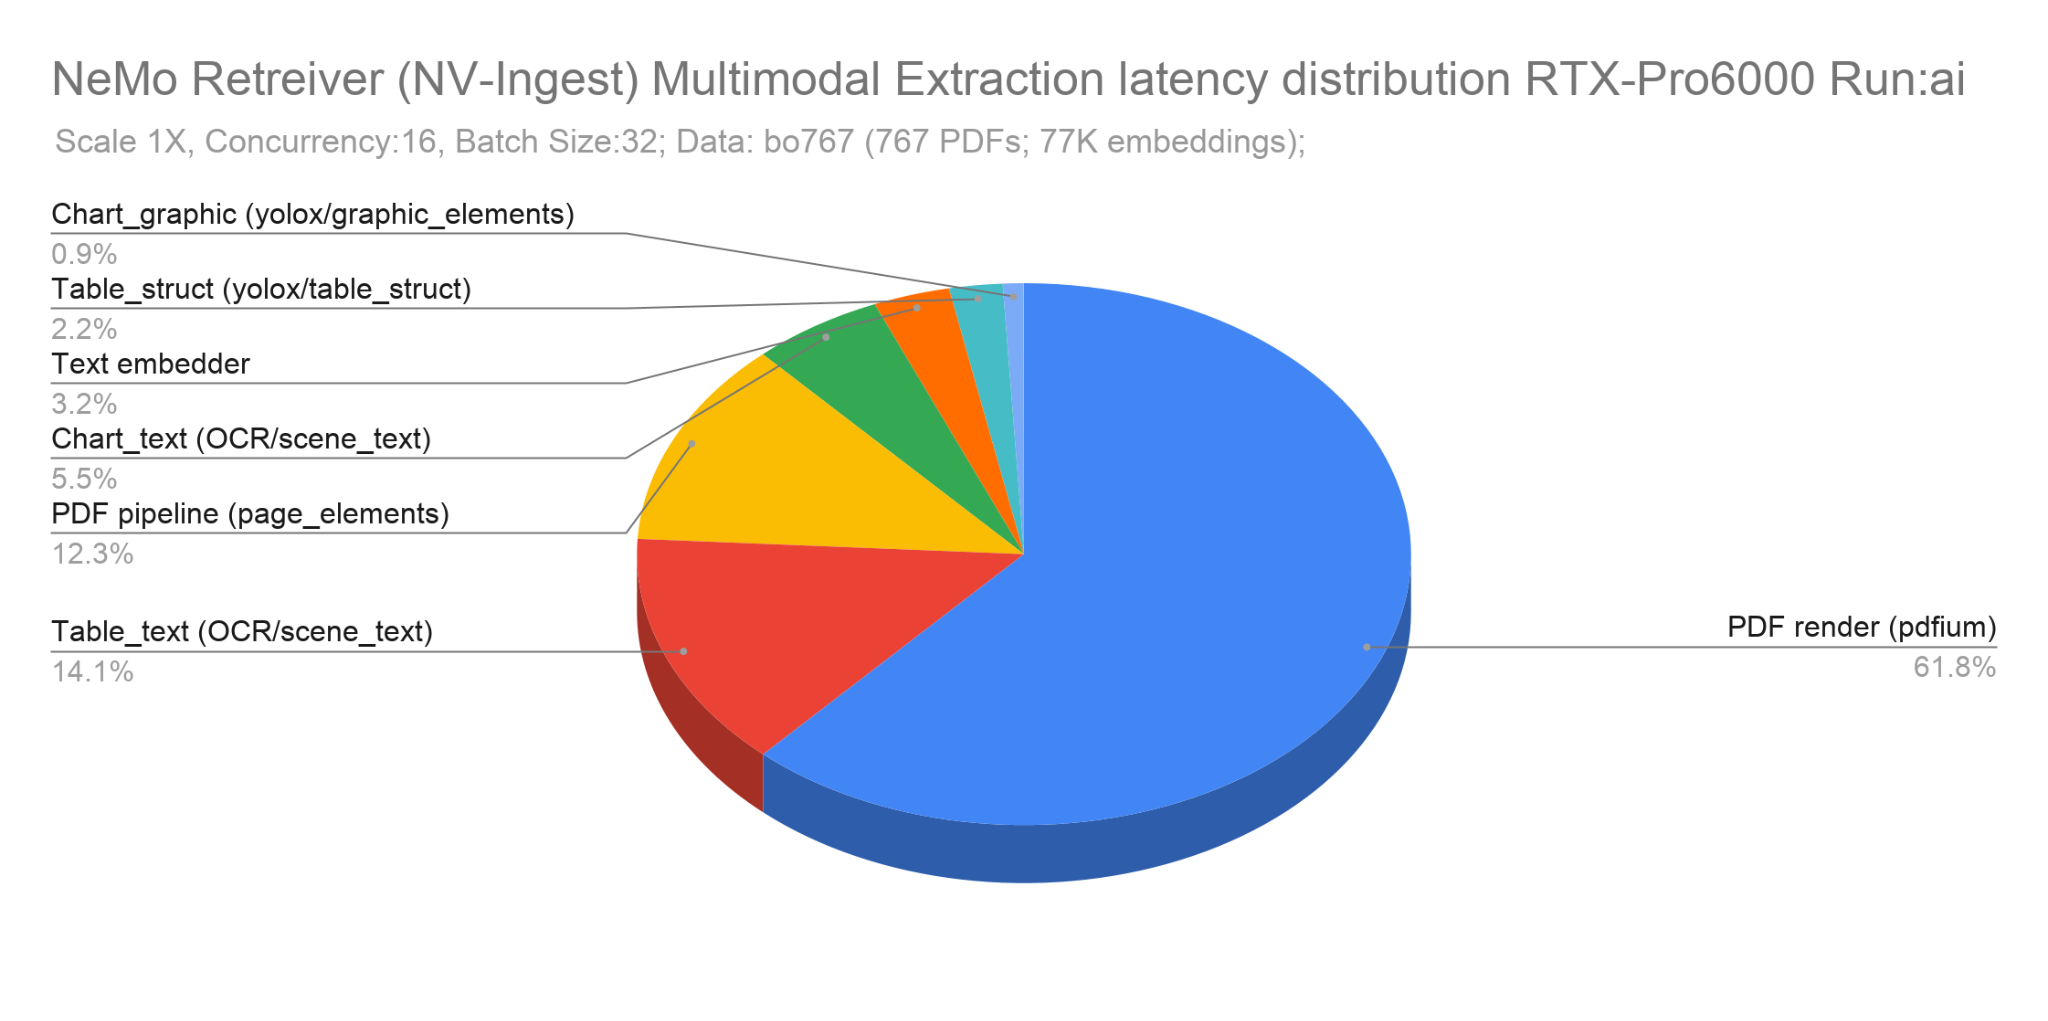
Figure 3 NV-Ingest data ingestion latency distribution chart for dataset digital corpora bo767 (767 PDFs) with NV-Ingest 1X scale on Run:ai RTX PRO 6000 deployment.#
The NV-Ingest PDF extraction includes 2 tasks:
PDFium (CPU) to render pages to images
page-elements NIM (GPU) to detect tables, charts, and images on the rendered page images
Here is a batch trace summary of queue latency or wait times for NV-Ingest benchmark run for dataset: digital corpora - bo767 (767 PDFs) with NV-Ingest 1X scale on Run:ai RTX PRO 6000 deployment.
For the data ingestion queue time distribution chart below, the majority of the queueing latency is with PDF extractor (52%); which includes wait time for PDFium (CPU) render and page-elements (GPU) NIM. This is followed by wait times for Metadata Injector (29% CPU), Table extraction (11%, nemotron-ocr + table-structure NIM microservices), Infographic chart extraction (4%, nemotron-ocr + graphic-elements NIM microservices) and Text Embedder (1.4% Embedding NIM).
Given the latency distribution data, scale out the NV-Ingest and nemotron-ocr and page-elements NIM microservices.
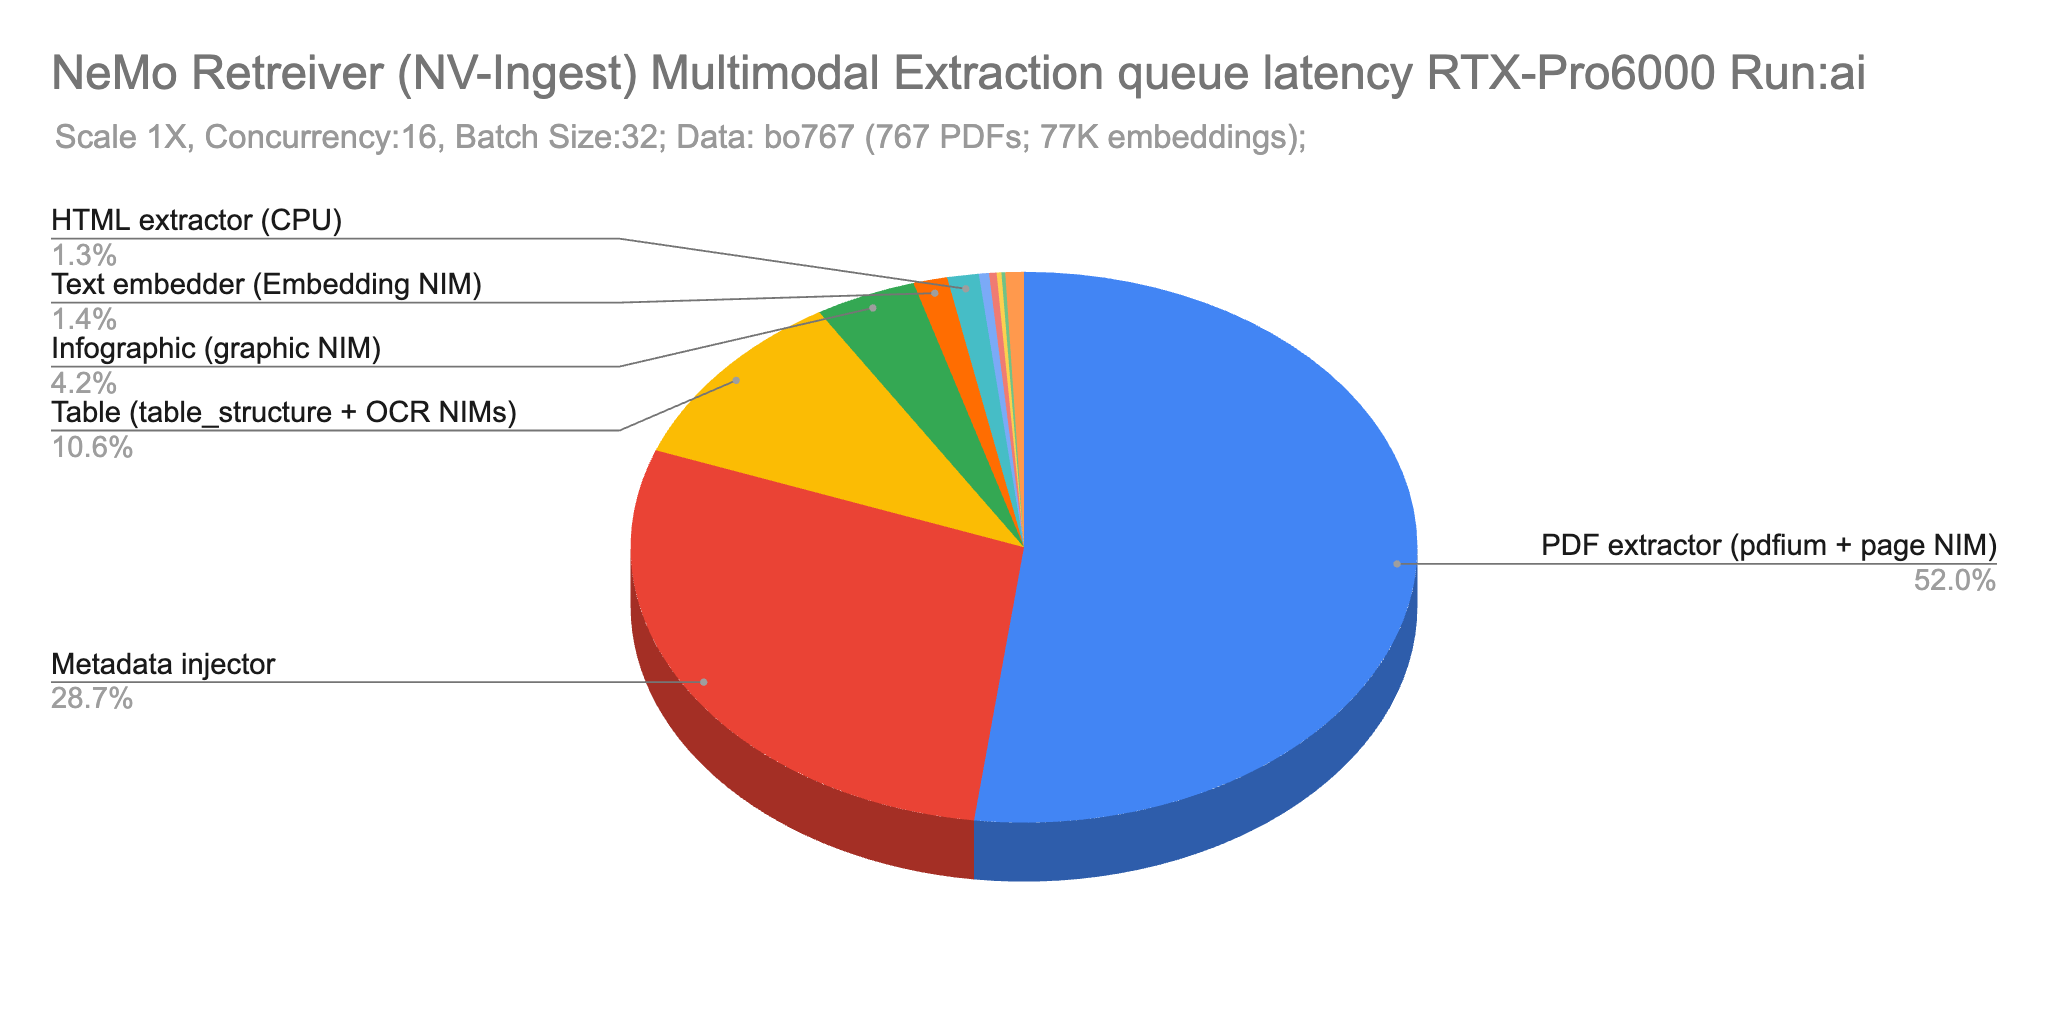
Figure 4 NV-Ingest data ingestion queue time distribution chart for dataset digital corpora bo767 (767 PDFs) with NV-Ingest 1X scale on Run:ai RTX PRO 6000 deployment.#
For multimodal data, given that the majority (93%) of the ingestion time is spent on data extraction (60%) followed by embedding (33%), it is critical that the data is preprocessed ahead of time at the data source preferably as soon as the data is created. Perform Data Extraction: PDF extraction of text, image, chart, table, as well as Tokenization and Chunking ahead of time. This should be followed by creating the vector embeddings and then store the vector embeddings in the MinIO S3 bucket for later bulk ingestion into Milvus Vector DB directly. This can save ~93% of end-to-end data ingestion time. Preprocessed vector embeddings can be bulk ingested into Milvus Vector DB in batches during off-peak hours with GPU acceleration (GPU CAGRA).
NV-Ingest Metrics Monitoring: Request Rates, Resource GPU/CPU Utilization#
Here is an example of metrics for ingestion benchmarking test run with Milvus and Embed request rates, GPU and CPU/Memory utilization for NV-Ingest, Extraction and Embedding NIM microservices.
Multimodal ingestion: Run:ai Scale1X
Text Configuration: NV-Ingest: Workers:32, Concurrency(CR)=32, BatchSize (BS)=64, Dataset: digital corpora (bo767), 767 pdfs, 55K pages, 86K elements, 77K vectors.
Run:ai Scale 1X => 1 X NV-Ingest + 1 X OPTG (1 GPU) [1 X OCR (40%), 1 X page-elements (30%), 1 X table-structure (20%), 1 X graphic-elements (10%)] + 1 X Embedding (50%) + 1X VDB-DataNode (25%); Total GPUs: 1.75
Embed rate: 61.43 RPS, Embed page rate: 43.74 pages/s (PPS), E2E Ingest rate: 40 PPS (includes Vector DB ingest time)
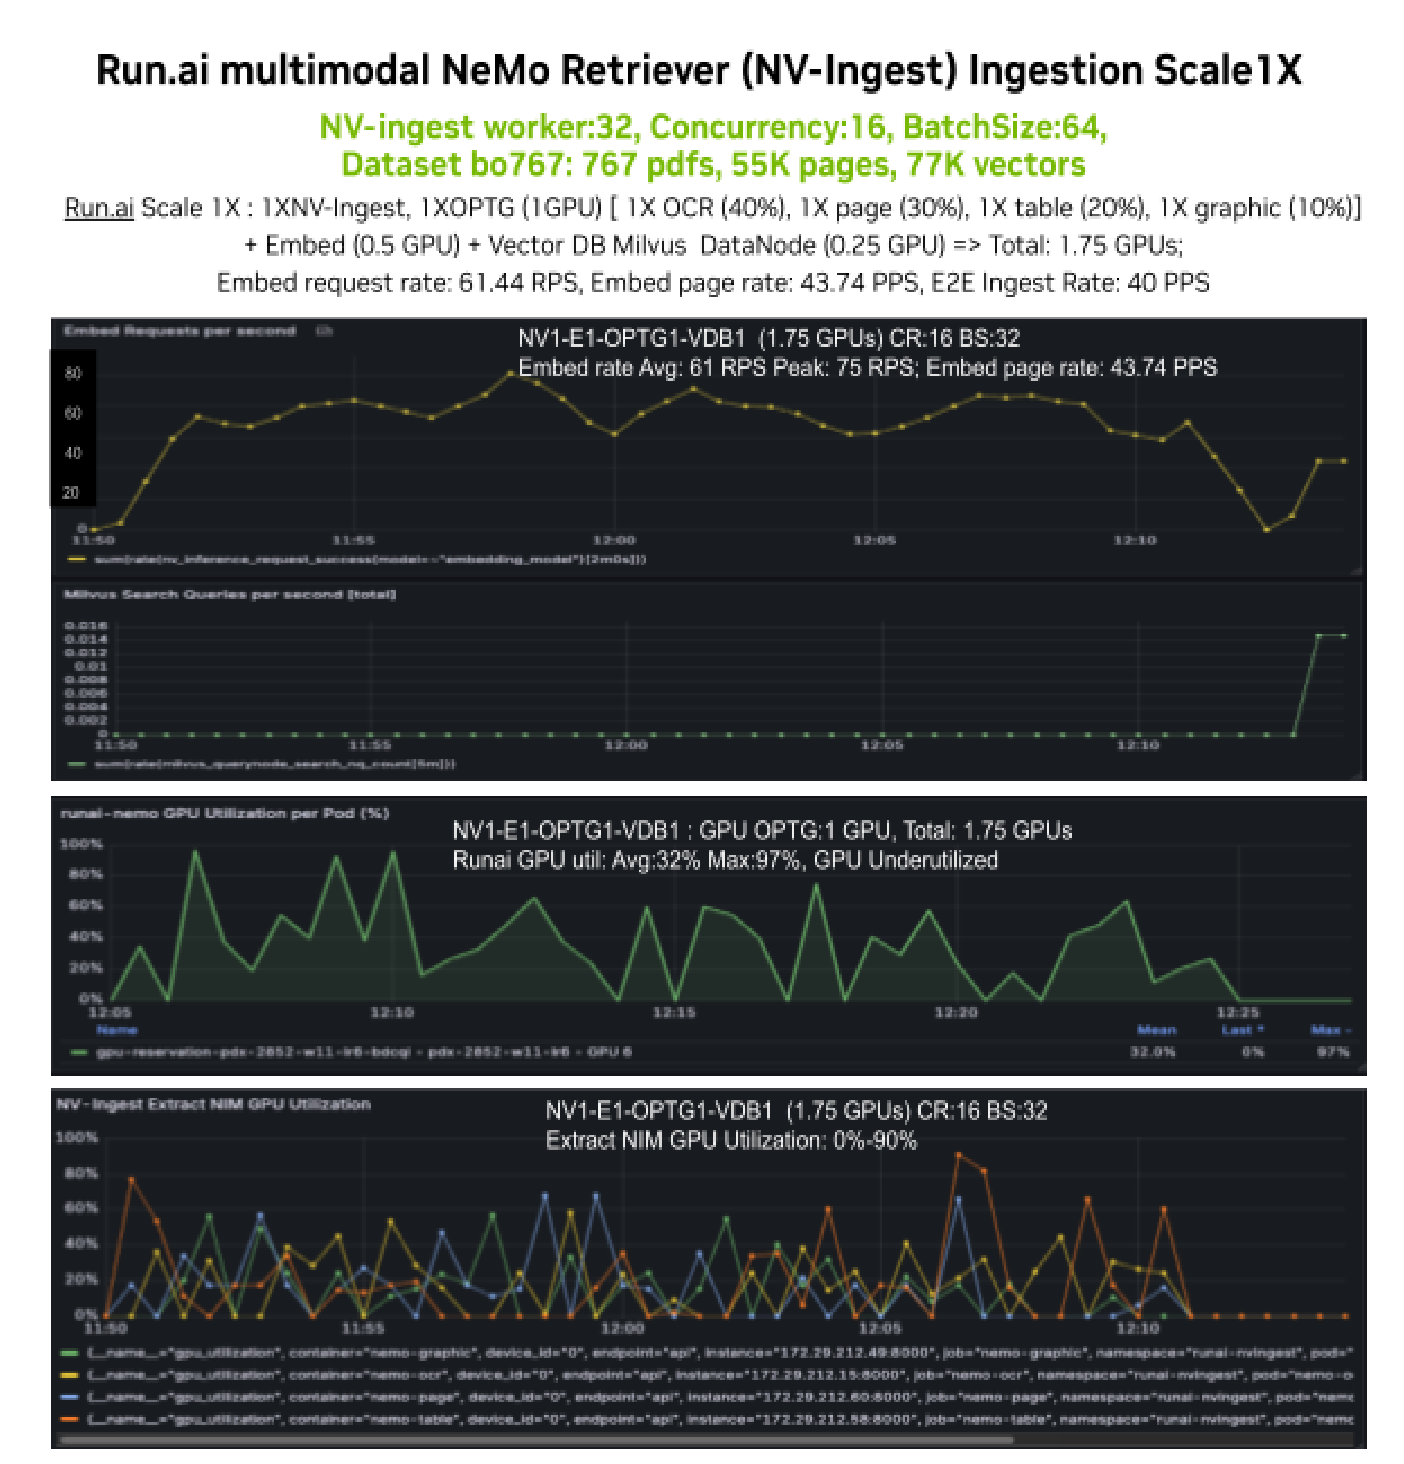
Figure 5 NV-Ingest metrics monitoring: Embed request rate (RPS) for Run:ai Scale 1X deployment.#
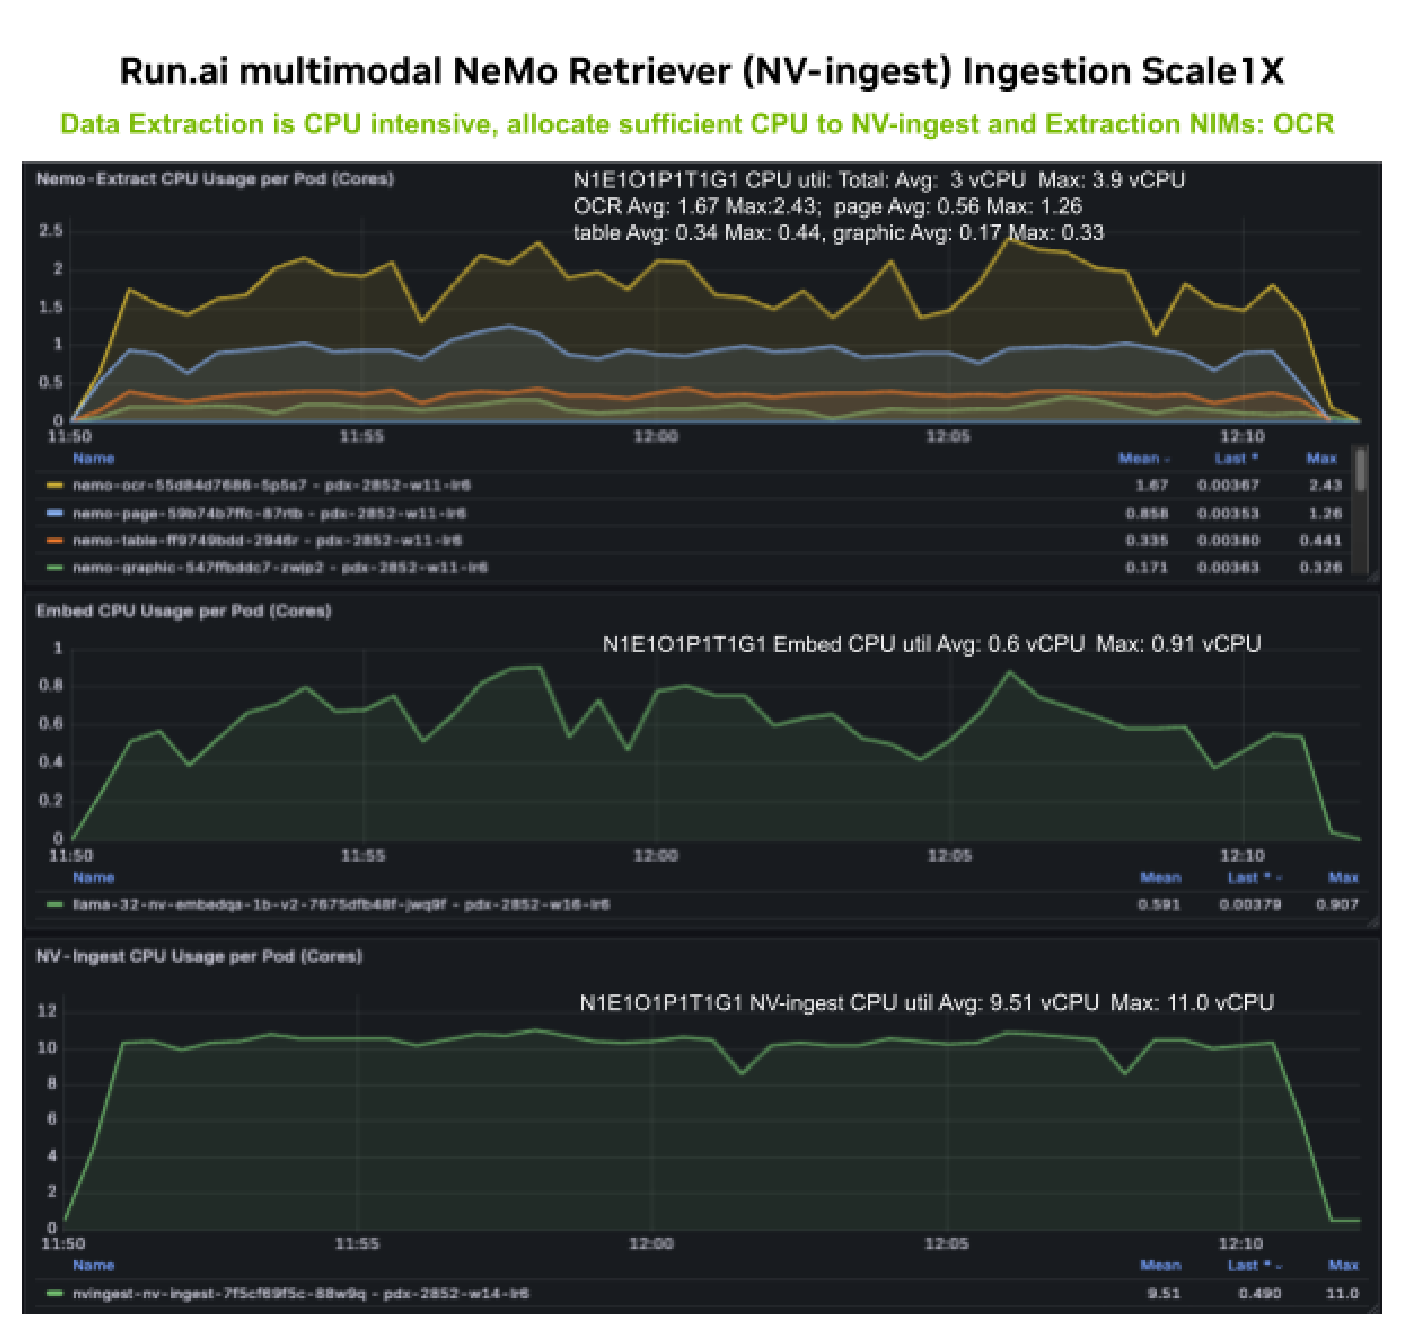
Figure 6 NV-Ingest metrics monitoring: GPU/CPU utilization for Run:ai Scale 1X deployment.#