
Summary - Ingestion Best Practices#
This guide details scaling best practices for the Enterprise RAG ingestion pipeline across three ingestion paths: Multimodal NV-Ingest (PDF documents with tables, charts and images), Text-only NV-Ingest, and Wiki Text Bulk Ingest (large parquet datasets).
The guidance applies to Kubernetes-based deployments on the NVIDIA Enterprise Reference Architecture ERA 2-8-5-200 platform with NVIDIA RTX PRO 6000 and NVIDIA H200 NVL systems.
At enterprise scale, especially for 100K+ multimodal documents, RAG ingestion is CPU intensive, but targeted GPU acceleration can reduce ingestion time from days to a few hours. For efficient GPU utilization, use Run:ai time slicing to allocate fractional GPU resources across extraction NIM microservices, embedding NIM microservices, and Milvus vector DB GPU indexing/data nodes. Size those GPU fractions based on data volume, required ingest rate, and content complexity. When strict workload isolation or hardware-level partitioning is required, deploy the NIM microservices and Milvus data nodes using Multi-Instance GPU (MIG) partitions.
Ingestion Pipeline - Time Distribution#
Understanding time distribution across the pipeline is essential for right-sizing GPU and CPU resources. For Multimodal data, extraction takes the majority 60% of the time as compared to text-only workloads where Embedding takes the most time.
For multimodal data, preprocessing ahead of time (extracting text, tables, charts and storing as Markdown + pre-computing embeddings and store as S3/parquet in MinIO) can save up to 93% of E2E ingestion time. For Data extraction use NeMo Retriever (NV-Ingest) with GPU accelerated GPU Extraction and Embedding to reduce ingest time from days (using CPU) to hours or minutes. Bulk ingest pre-computed embeddings during off-peak hours using GPU accelerated (cuVS) indexing GPU CAGRA.
Phase |
Multimodal Nemo Retriever |
Text-only Nemo Retriever |
Wiki Text Bulk Ingest (CPU) |
Wiki Text Bulk Ingest (GPU) |
|---|---|---|---|---|
Data Extraction (parse, extract tables, chart, text, metadata) |
60% - CPU + 1 GPU (pdfium + extraction NIM microservices) - 12 mins |
10% - CPU only (pdfium text extraction) - 30-45s |
3% - CPU only (parquet parse + chunk) |
4% - CPU only (parquet parse + chunk) |
Embedding (tokenize, embed, write) |
33% - 1 GPU - 7-8 mins |
80% - 1 GPU - 4 mins |
56% - 3 GPUs - 4.53 hours |
86% - 3 GPUs - 4.56 hours |
Vector DB Ingest (upload + index + store + load) |
7% - 0.25 GPU CAGRA (cuVS) ~110-120s for 77K vectors |
10% - 0.25 GPU CAGRA (cuVS) ~60-70s for 45K vectors |
41% - CPU HNSW - 3.31 hours for 10M vectors |
10% - 0.25 GPU CAGRA (cuVS) 31 mins for 10M vectors |
Text Chunking Strategy#
The Chunk size is selected at ingestion time and cannot be changed after vectors are loaded into the Vector DB. It directly affects both retrieval accuracy and LLM context overhead. Large chunk sizes 512 or above benefits ingestion (increase document ingestion rate by 1.75X) and increases accuracy (2%-5%) to a point of diminishing returns. However large chunk sizes significantly impact RAG Retrieval performance particularly TTFT Latency, Throughput and TCO cost per million tokens, making the solution highly inefficient. Ingestion is done once but Retrieval is a regular event.
Wiki Bulk Text-only - Uses Chunk Size 256/50 (256 tokens, 50 overlap) which is ideal for RAG Chat(128/128) use cases with small ISL/OSL with context overhead of ~1,000 tokens (TopK=4). Balances accuracy and retrieval performance.
Nemo Retriever (NV-Ingest) - uses pdfium with paged chunking (TEXTDEPTH: page), which for bo767 dataset results in an average chunk size of 625 tokens. This adds ~1,500 tokens of context overhead per request (compared to ChunkSize=256, TopK=4), reducing LLM output throughput by 50%.
Chunk Size should be driven by the RAG Retrieval application/usecase:
Chat (128/128) - short requests and short responses (ISL=128, OSL=128), with Low Latency SLAs (TTFT <3s) should use smaller Chunk Sizes 128-256 tokens.
Summarization (1024/512) - require more context (larger ISL=1024 and OSL=512) can have larger Chunk sizes of 256 to 512 tokens. The latency SLAs are not as stringent.
Generation (128/2048) - require significantly higher output context (OSL >1024) with reasoning/thinking tokens; can have a much larger Chunk size of 1024 tokens and even pull the full document for context. Latency is not a priority but details and accuracy are crucial.
Embedding and VDB Best Practices#
Embedding Dimension and quantization trade-offs - Reducing dimensions from 2048 to 1024 cuts Vector DB size by 50% and speeds up ingestion by ~2X but sacrifices search 90% recall by 2-5%. Reducing quantization from BF16 to INT8 or binary speeds up ingestion by 4X at a 3-7% accuracy cost.
Bulk Upload for Large Datasets - For datasets > 100K vectors, use Vector DB Bulk Upload (instead of continuous HTTP streaming) e.g. Milvus Remote Bulk Writer. Write embeddings to MinIO in 1 GB segments, then trigger bulk write to Milvus. Bulk ingestion at 1 GB segments is 10-12x faster than HTTP streaming.
Segment Size Formula - 1 GB Segment approx 100K embeddings x 2048 dim x 4B (FP32)
20% overhead (indexing + metadata). Size segments to 1 GB for optimal ingestion throughput.
Collection Load Strategy - Collections do not need to be loaded in memory simultaneously. Load on-demand to save GPU/CPU memory. Be aware of a 10x latency penalty for the first search after loading a collection from disk.
Observability and Monitoring#
Enable full telemetry before running ingestion benchmarks. Tracing data reveals which pipeline stage is the bottleneck and guides NIM scaling decisions.
Prometheus + Grafana - Monitor Embed request rate (RPS), gpu_utilization, gpu_cache_usage_perc, and CPU/memory per pod. Scale out a NIM when average GPU utilization exceeds 70-80%.
OpenTelemetry tracing (Jaeger or Zipkin) - Use batch trace summaries to see latency distribution across all pipeline stages. For bo767, 93% of time is data extraction: PDF render (61% CPU), table extraction (14% nemotron-ocr), page elements (12.3% nemotron-page-elements-v3).
Queue wait times - Monitor pdf_extractor_channel_in queue latency. High queue wait (>52% of total) indicates NV-Ingest workers are backlogged. Scale out NV-Ingest replicas and ensure Redis has at least 12 GiB memory for large batch sizes (BS>=192).
Autoscaling with HPA - Enable Kubernetes HPA for scaling RAG services: Embedding and Extraction NIM microservices using GPU utilization metrics (e.g. gpu_utilization or gpu_cache_usage_perc).
Multimodal Ingestion Best Practices#
For multimodal data ingestion with NV-Ingest, over 90% of e2e ingestion time is spent on Data Extraction (60%) followed by Embedding (33%).
Time distribution (multimodal vs text) |
NeMo Retriever (NV-Ingest) |
|---|---|
Data Extraction - extract tables, charts, images, text, inject metadata |
60% |
Embedding (tokenize, chunk, embed) |
33% |
Vector DB ingestion (Bulk ingest) |
less than 7% |
Total Ingestion time - Increase in time compared to text-only ingestion |
10X increase |
Data extraction is still very CPU intensive even with table and chart detection offloaded to the GPU. CPU based PDF render accounts for the majority (62%) of latency distribution followed by table text extraction (OCR NIM) 14%.
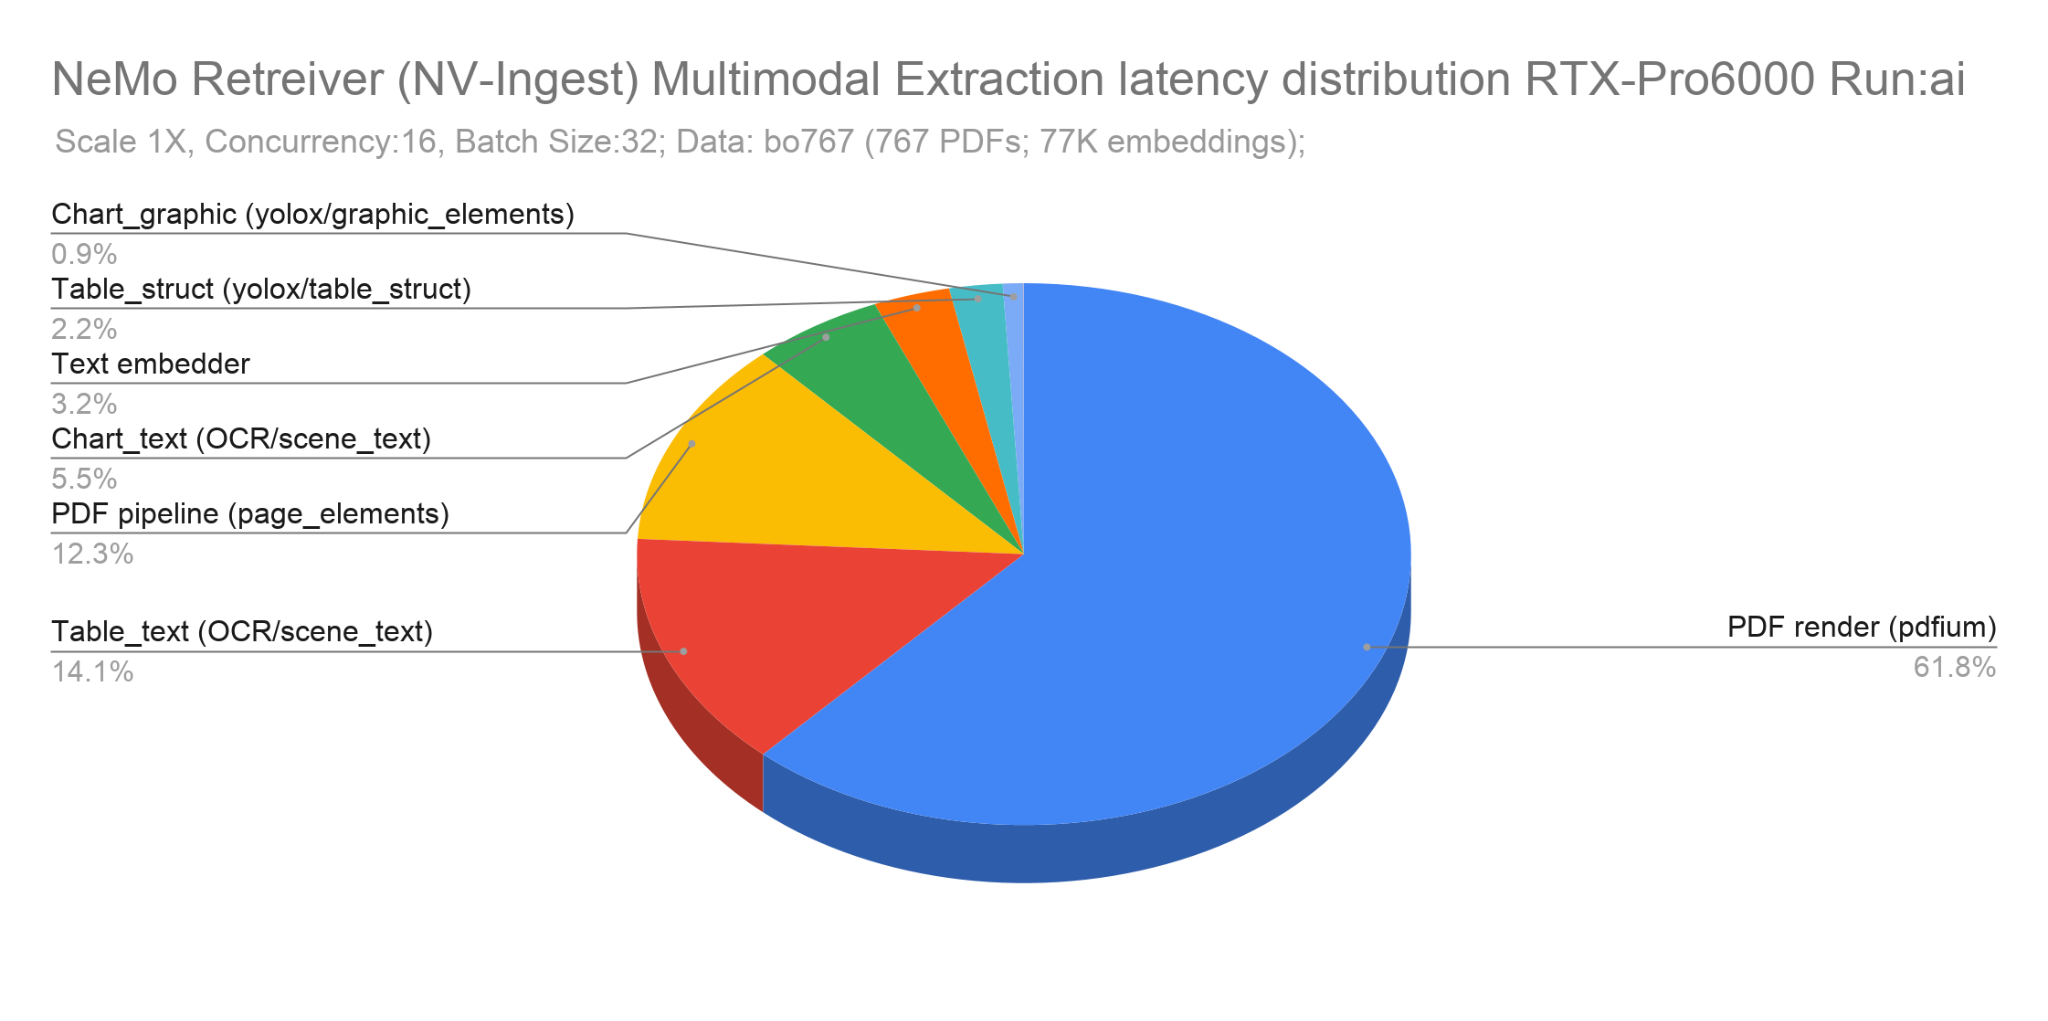
Figure 39 Multimodal ingestion latency distribution showing CPU-intensive PDF rendering (62%) as the primary bottleneck, followed by table text extraction via OCR NIM (14%).#
GPU Sharing - Run:ai or MIG#
Multimodal data extraction is spiky (based on load) and CPU intensive, making it ideal for GPU sharing using Run:ai or MIG. To improve GPU utilization efficiency, enable GPU sharing using Run:ai time slicing with GPU fractions or MIG with strict hardware partitioning.
Run:ai reduces GPU requirements from 6 full GPUs to 1.75 GPUs. MIG reduces to 2 GPUs but with less granular control and lower efficiency, resulting in higher TCO Cost per Million vectors: MIG TCO: $5.60 vs Run:ai TCO: $4.75.
Multimodal Baseline |
Run:ai GPU fraction |
MIG RTX PRO 6000 |
CPU/Memory |
|---|---|---|---|
1 NV-Ingest - 32 Workers |
NA |
NA |
16 vCPU, 32 GiB |
1 Embed - llama-nemotron-embed-1b-v2 |
0.5 (50%) GPU |
mig-2g.48gb |
1 vCPU, 8 GiB |
1 OCR - nemotorn-ocr-v1 |
0.4 (40%) GPU |
mig-2g.48gb |
3 vCPU, 4 GiB |
1 page-elements - nemotron-page-elements-v3 |
0.3 (30%) GPU |
mig-1g.24gb |
1 vCPU, 2 GiB |
1 table-structure - nemotron-table-structure-v1 |
0.2 (20%) GPU |
mig-1g.24gb |
0.5 vCPU, 3.5 GiB |
1 graphic-elements - nemotron-graphic-elements-v1 |
0.1 (10%) GPU |
mig-1g.24gb |
0.25 vCPU, 3 GiB |
Milvus 1 Data node |
0.25 (25%) GPU |
mig-1g.24gb |
16 vCPU, 32 GiB |
Milvus 1 Query node |
NA |
NA |
16 vCPU, 40 GiB |
Total GPU resources (instead of 6 full GPUs) |
1.75 GPUs |
2 GPUs |
64 vCPU, 128 GiB |
Scaling NV-Ingest and NIM Microservices#
Data extraction is CPU intensive and the bottleneck could be CPU and not GPU related. Allocate sufficient CPU to NV-Ingest and Extraction NIM microservices, and set the multithreading (OMP_NUM_THREADS>1) appropriately.
Target Scaling Efficiency > 80% - For linear scaling (Efficiency >80%), when document concurrency increases by 2X (Scale 2X), then the NV-Ingest workers need to double and NIM replicas need to be scaled out so that the Embed rate and E2E ingestion rate double.
Observability Metrics and Tracing - Monitor GPU and CPU utilization metrics and trace data during benchmarking using Prometheus Open Telemetry to find latency bottlenecks and scale out bottlenecks.
Addressing NV-Ingest gRPC Long-lived Connection limitation (Critical): When scaling out Embedding or Extraction NIM replicas, restart all NV-Ingest pods (kubectl rollout restart) to reset gRPC connections. NV-Ingest will otherwise continue routing to the original NIM instances, leaving new replicas idle.
Right Sizing NIM Fractions - Strong vs Weak Scaling#
For predictable linear scaling, use strong scaling to set the initial baseline and weak scaling to scale out and scale in from the baseline as data load varies.
Strong Scaling (scale up/down) - Add or remove GPU resources or Scale up/down NIM pods based on data load. Reduces overhead from load balancing to multiple NIM fragments. Provides better scaling efficiency 5-7%. Best for known workloads. Dynamic right sizing requires a custom Vertical Pod Autoscaler (VPA) for GPU.
Weak Scaling (scale out/in) - Scale in/out NIM replicas (pods). Provides dynamic scaling with Kubernetes HPA with GPU utilization metrics. Adds load-balancing overhead (~6% efficiency loss vs strong scaling). Best for dynamic workloads.
Hybrid recommendation - Set the baseline GPU allocation using strong scaling for the expected load profile, then use dynamic HPA weak scaling to handle demand spikes.
Concurrency - Document (client) vs Worker (server)#
Scale out NV-Ingest workers in sync with client-side document concurrency.
Concurrency (CR) = NVingest_replicas x Workers x pages_per_chunk / average_pages_per_document. For NV-Ingest with 32 Workers, 32 page chunks, dataset bo767 (avg 71 pages/doc): Scale-1X Concurrency CR = 1 X 32 X 32/71 = 14.4 => 14-15 documents. Configure (client side) document Concurrency CR = 16 (>= 14.4).
Batch Size (BS) = 2 x Concurrency (CR). Redis must have sufficient cache memory (12 GiB) to hold the batch before workers pick up jobs.
Workers - For NV-Ingest with MAX_INGEST_PROCESS_WORKERS=32 allocate 16 vCPU and 32 GiB RAM and enable multithreading (OMP_NUM_THREADS >= 1).
NV-Ingest Scale |
Workers |
Concurrency (CR) |
Effective Concurrency |
Batch Size (BS) |
GPUs (Run:ai) |
|---|---|---|---|---|---|
Scale 1X |
32 |
16 |
14.4 |
32 |
1.75 |
Scale 2X |
64 |
32 |
28.9 |
64 |
1.75 |
Scale 3X |
96 |
48 |
43.3 |
96 |
2.65 |
Scale 4X |
128 |
64 |
57.7 |
128 |
3.25 |
Scale 6X |
192 |
96 |
86.5 |
192 |
4.85 |
Data Preprocessing - Reduce E2E Ingestion Time#
For multimodal data, Data extraction (60%) + Embedding (33%) accounts for 93% of E2E ingestion time. Preprocessing data at the source eliminates this bottleneck.
Extract ahead of time - Run PDF extraction (pdfium + extraction NIM microservices) as soon as documents are created or received. Store output as Markdown format.
Pre-compute embeddings - Tokenize, chunk and embed the extracted text ahead of time. Store vector embeddings in MinIO object store.
Bulk ingest during off-peak - Load pre-computed embeddings directly into Milvus Vector DB in 1GB segments (~100K embeddings) using GPU accelerated (cuVS) indexing (GPU CAGRA) during off-peak hours.
Text-only NV-Ingest Best Practices#
For text-only PDF ingestion, NV-Ingest uses pdfium without extraction NIM microservices, making it much lighter on GPU resources.
Scale |
NV Ingest |
Embed NIM |
GPUs |
Concurrency |
Embed Rate |
E2E ingest Rate |
|---|---|---|---|---|---|---|
Scale 1X |
1 |
1 (0.5 GPU) |
0.75 |
32 |
97 vectors/s - 116 PPS |
85 vectors/s - 101 PPS |
Scale 2X |
2 |
2 (1 GPU) |
1.25 |
64 |
194 vectors/s - 231 PPS |
151 vectors/s - 181 PPS |
Scale 4X |
4 |
4 (2 GPU) |
2.25 |
128 |
387 vectors/s - 462 PPS |
248 vectors/s - 296 PPS |
Scale 6X |
6 |
6 (3 GPU) |
3.25 |
192 |
581 vectors/s - 694 PPS |
317 vectors/s - 379 PPS |
Scale 8X |
8 |
8 (4 GPU) |
4.25 |
256 |
776 vectors/s - 927 PPS |
370 vectors/s - 442 PPS |
Text-only NV-Ingest scales linearly - 8X scale delivers ~8X embed throughput (776 embed/s vs 97 embed/s at Scale 1X). TCO (Cost per 10M vectors) stays flat at ~$15.56.
Scale NV-Ingest and Embedding NIM microservices together - Always scale both in tandem. NV-Ingest is CPU bound at high concurrency; Embedding NIM is GPU bound.
Monitor utilization - Scale out when average CPU or GPU utilization exceeds 80%.
Wiki Text Bulk Ingest Best Practices#
For large-scale pre-processed parquet datasets, use the Wiki Text Bulk Ingest methodology. This uses python libraries to parse parquet files and provides fine-grained control and speed to batch and parallelize parsing, embedding, and vector DB upload/ingest independently.
Note
Nemo Retriever (NV-Ingest) Library parquet file limitation - does not currently support parsing S3 parquet files. This is planned for a future release.
Vector DB: GPU (cuVS) vs CPU Bulk Ingestion#
GPU CAGRA (cuVS) speeds up VDB index build by 8-10X and reduces E2E ingestion time by ~35%.
Phase |
VDB CPU Ingestion (10M vectors) |
VDB GPU Ingestion (10M vectors) |
|---|---|---|
Data Extraction |
3% (0.21 hours) |
4% (0.20 hours) |
Embedding |
56% (4.56 h) - 3 GPUs |
86% (4.53 h) - 3 GPUs |
Vector DB Ingest |
41% (3.31 h) - CPU HNSW |
10% (0.51 h) - cuVS GPU-CAGRA (6X faster) |
E2E Ingestion Time |
8.08 hours |
5.24 hours (~35% reduction) |
Parallelization and Batch Sizing#
Batch concurrency (CR) - Scale CR=[8, 16, 32, 48, 64]. Each Embedding NIM instance saturates at approximately CR=8 concurrent threads.
Data extraction batch size - 200-400 documents per batch.
Embedding batch size - 1,000 chunks per Embedding NIM request.
VDB bulk upload segment - 1GB segment = ~100K embeddings x 2048 dim x 4B (FP32)
20% metadata overhead.
Wiki Text Scaling Performance#
Scale |
Embed NIM + VDB |
GPUs |
Concurrency (CR) |
Embed Rate |
E2E ingest Rate |
TCO |
|---|---|---|---|---|---|---|
Scale 1X |
1 Embed + 1 VDB (cuVS) |
0.75 |
8 |
104 vector/s - 23 docs/s |
101 vector/s - 23 docs/s |
~$15.71 |
Scale 2X |
2 Embed + 1 VDB (cuVS) |
1.25 |
16 |
208 vector/s - 47 docs/s |
197 vector/s - 44 docs/s |
~$15.56 |
Scale 4X |
4 Embed + 1 VDB (cuVS) |
2.25 |
32 |
418 vector/s - 94 docs/s |
377 vector/s - 85 docs/s |
~$15.56 |
Scale 6X |
6 Embed + 1 VDB (cuVS) |
3.25 |
48 |
623 vector/s - 140 docs/s |
538 vector/s - 121 docs/s |
~$14.60 |
Scale 6X |
6 Embed + 1 VDB (CPU) |
3 |
48 |
619 vector/s - 139 docs/s |
349 vector/s - 79 docs/s |
~$19.12 |
Additional best practices:
Pre-download tokenizer - Download the nvidia/Llama-3_3-Nemotron-Super-49B-v1 tokenizer locally before running ingestion to eliminate HuggingFace network latency.
Store embeddings first - Store vector embeddings in MinIO, then bulk ingest into Milvus using 1GB segments. Saves 70-90% of VDB ingest time.
Chunk size 512/150 vs 256/50 - Doubling chunk size from 256/50 to 512/150 increases document ingest rate by ~1.75X but increases RAG retrieval ISL by ~1,000 tokens (TopK=4), reduces throughput by 25-33%. Select Chunk Size based on the RAG Retrieval application requirements.
Ingestion Sizing - T-Shirt Sizing Guide#
Use the Sizing table below to size GPU resources for multimodal PDF ingestion. This is based on Nemo Retriever (NV-Ingest) multimodal benchmarks with the bo767 dataset (average 71 pages/doc, 30 tables/doc, 10 charts/doc).
Assuming Enterprise RA 2-8-5 cluster RTX PRO 6000 GPU hourly cost: $0.97/hour (including software and server, 5-year amortization).
Size |
Data Volume |
Required Rate |
Run:ai Config |
MIG Config |
E2E Time |
Run:ai TCO |
MIG TCO |
|---|---|---|---|---|---|---|---|
Small |
5K docs - 500K vectors |
1,500 docs/hr - 150K vector/hr |
Scale 1X - 1 GPU - CR=16 |
Scale 1X - 1.5 GPUs - CR=16 |
3.30 hrs |
$2.59 |
$4.28 |
Medium |
10K docs - 1M vectors |
2,700 docs/hr - 270K vector/hr |
Scale 2X - 1.75 GPUs - CR=32 |
Scale 2X - 2 GPUs - CR=32 |
3.68 hrs |
$5.47 |
$6.39 |
Large |
40K docs - 4M vectors |
4,800 docs/hr - 480K vector/hr |
Scale 4X - 3.25 GPUs - CR=64 |
Scale 4X - 4 GPUs - CR=64 |
8.36 hrs |
$22.50 |
$25.23 |
X-Large |
100K docs - 10M vectors |
7,000 docs/hr - 700K vector/hr |
Scale 6X - 4.85 GPUs - CR=96 |
Scale 6X - 5.5 GPUs - CR=96 |
14.29 hrs |
$52.51 |
$65.84 |
Start conservatively with Scale 1X or 2X and refine as actual enterprise document profiles (pages, tables, charts) become known. The biggest uncertainty is multimodal extraction time, which varies significantly with document content type.
Data Volume - How many documents need to be ingested at a given time, pages per document, document size MB? What is the type of content, Text, PDF, parquet? What is modality percentage, text vs tables/charts/image?
Ingestion rate - What is the document or vector ingestion rate required, in terms of docs/s or vectors/s? Use benchmarking data to determine the document ingestion rate possible at different concurrency for each type: Multimodal PDF, Text or parquet.
Ingestion schedule - Is ingestion continuous, GPUs permanently allocated? or Does ingestion need to be scheduled during specific off-peak hours, nights or weekends? Based on data type, volume and schedule; select the sizing (small, medium, large) to achieve the ingestion rate required.
TCO Total Cost - Calculate the TCO Cost using formula below:
Small Scale-1X Run:ai TCO: $1.09 × (0.75 GPU × 3.10 hr + 0.25 GPU × 0.20 hr) = $2.59