NVIDIA® Nsight™ Development Platform, Visual Studio Edition 4.7 User Guide
Send Feedback
This section discusses the CUDA Source View analysis report page.
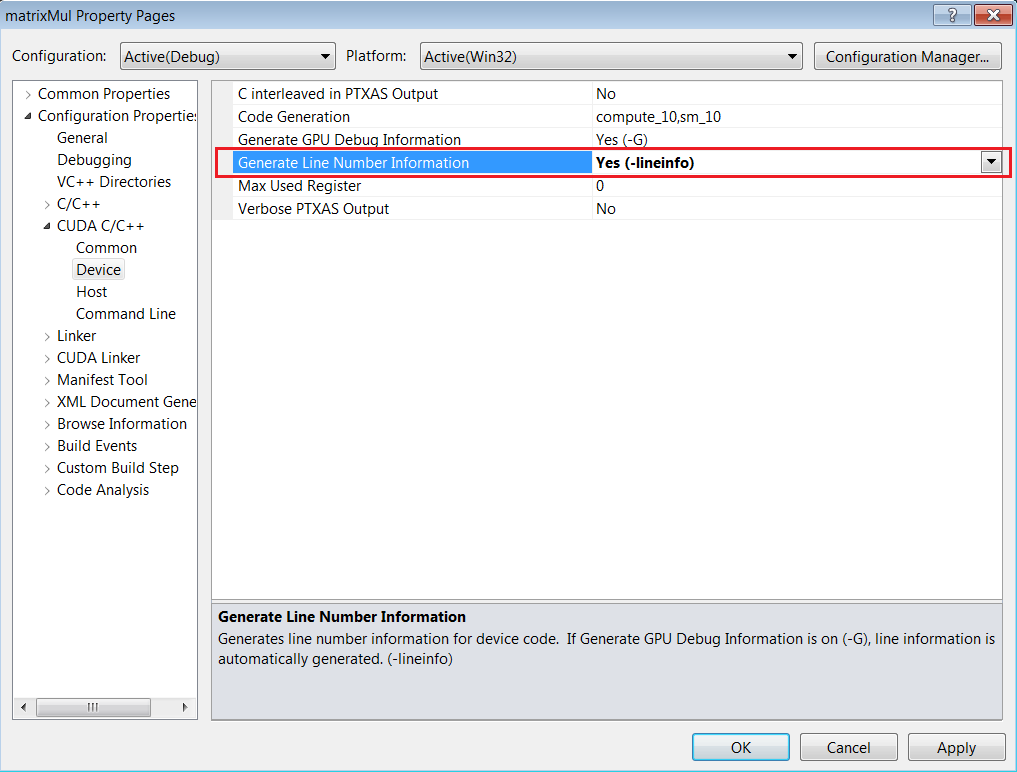
Before you can profile your application, you need to set the -lineinfo compile option.
If an application is compiled without the -lineinfo option, source code data will only be shown on a SASS level. With this enabled, additional information will be compiled that allows mapping between the SASS code, PTX, and CUDA-C. This guarantees that this type of profiling will work on unchanged debug and release compiled kernels.
Three source code experiments are available from the custom experiment configuration:
There is also an option, Collect Information for CUDA Source View, which allows the user to force collection of the source code data, even if no source code experiments are selected.
If this option is enabled, the CUDA Source View report page will become available and will display source code, but no metrics. (Note that this option is automatically enabled if one of the source code correlated experiments has been selected.) Besides displaying the source code itself, this option will also add columns to the report page that will show the metrics collected by this experiment.

In the details pane on the far right, you will see that each experiment has additional configuration options available. Note that the more options you select, the more overhead is introduced. All of the source code experiments introduce a relatively high overhead, and may trigger a TDR if the target kernel with source code data collection executes longer than the TDR timeout. To work around this, ensure that either TDR has been disabled or the timeout has been set to a high enough value to prevent a problem.
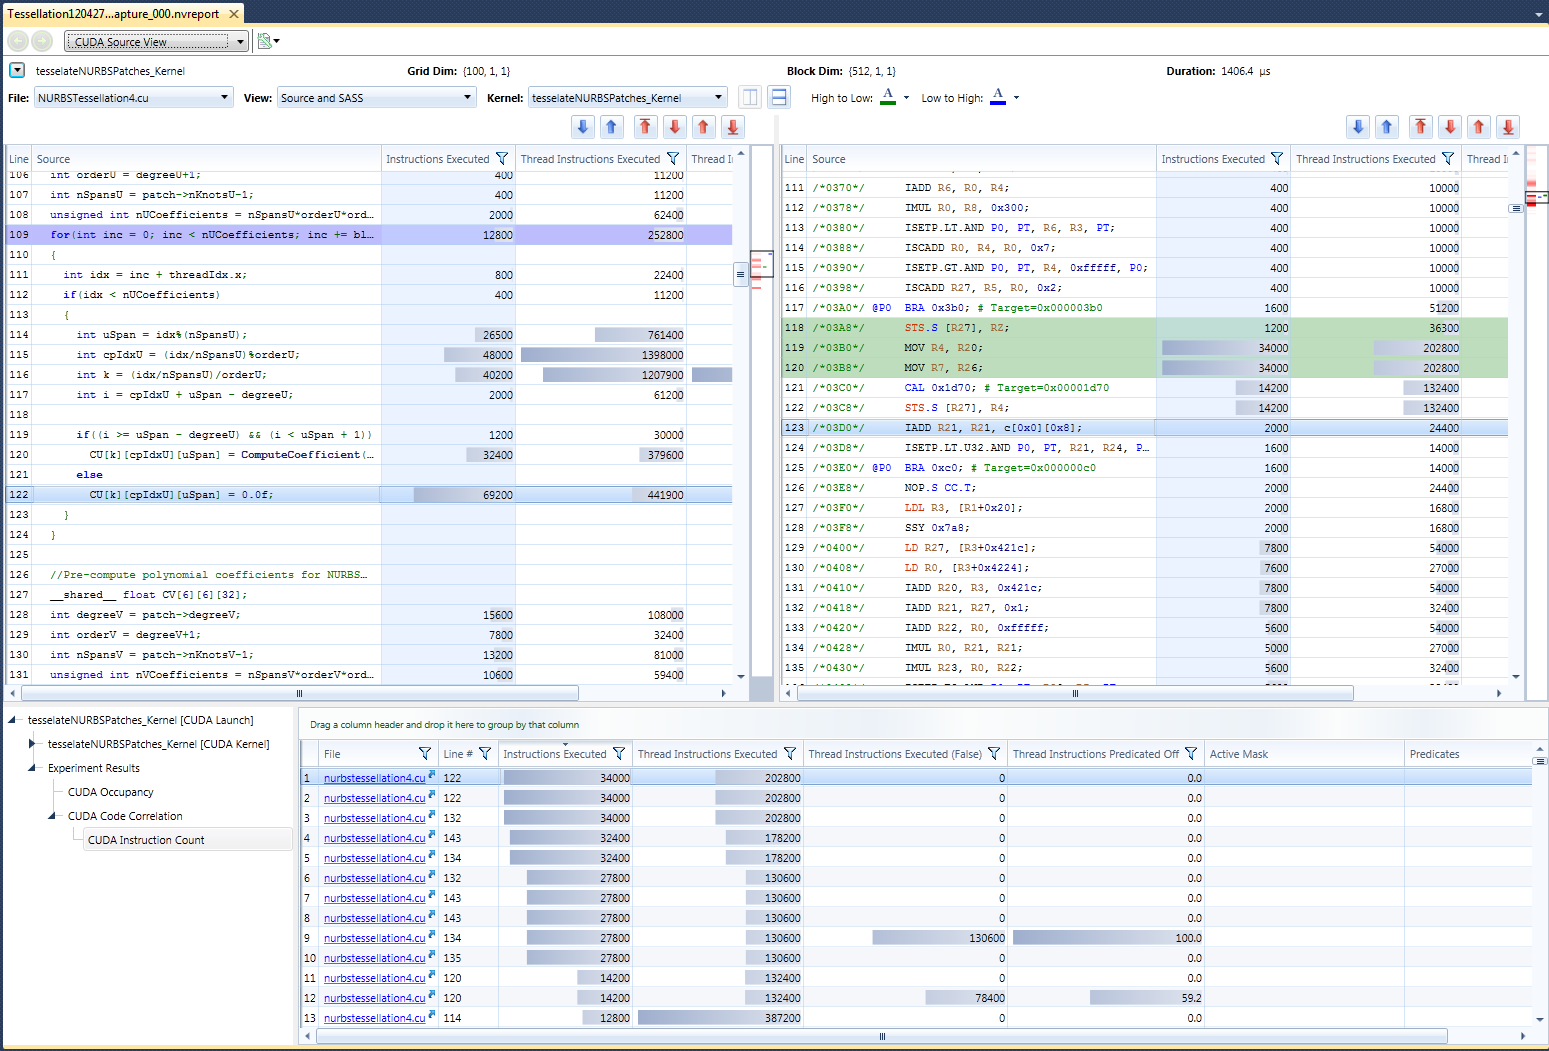
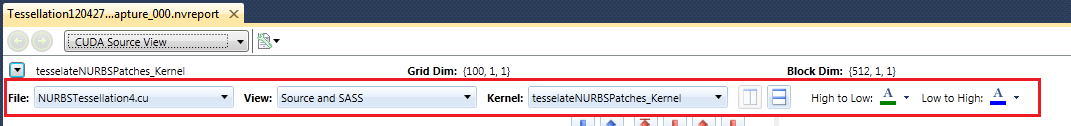
An example of the CUDA Source View report page is shown below.
Let's now go over the key items to note on this report page.
The Kernel Selection toolbar is located at the top of the CUDA Source View Report page. Here, the user can select the Kernel launch to examine.

When closed, the Kernel Selection Toolbar shows which kernel is currently selected as well as the Grid Dimension, Block Dimension, and Duration of the selected kernel. To change the selected kernel, simply click on the drop-down button next to the kernel name, and choose any of the available kernels listed for further inspection.
The View toolbar controls the display of the main content of the CUDA Source View report page.
The main content of the CUDA Source View report page is delivered through one or two Source Code Grid controls.
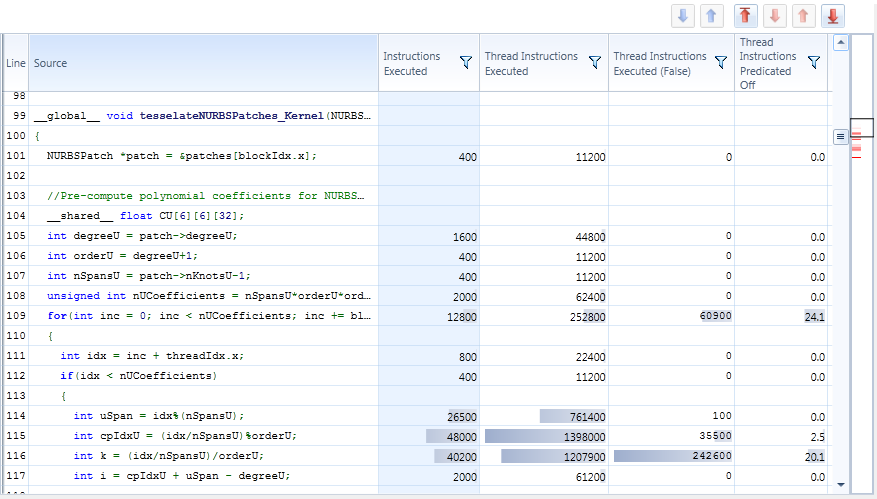
Each source code grid presents a single line column, a single source column, as well as multiple metric columns.
Some numeric and percentage columns can be configured to display gradients to help identify critical values.
Metric columns are the only column type that is selectable. When selected, the metric values found in the column are presented on the mini-map and some of the buttons on the Metric Navigation toolbar are enabled.
The Metric Navigation toolbar allows the user to easily navigate the rows in the source code grid, based on the values in the selected metric column.

Using these buttons, you can move to the previous/next rows with data in the selected column, or move to the rows with the highest/lowest values in the selected column.
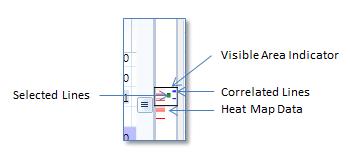
The mini-map, located on the right side of the source code grid, provides an overview of the source code, by presenting three types of data:
The height of the mini-map will never exceed the height of the source grid. For shorter files however, it may not extend to the full height of the grid. When necessary, a rectangle that describes the currently visible area of the grid will be drawn.
The main purpose of the CUDA Source View report page is to show how higher-level source code lines correlate to lower-level source code, and vice-versa. In order to see this relationship, the report must be configured with a view that displays both higher and lower level source code.
As mentioned previously, the High to Low and Low to High correlation colors are used to display this relationship.

In this scenario, line 142 of the higher level source code is selected. In this particular program, line 142 of high-level (CUDA-C) code correlates to lines 228, 232 and 234 in the SASS code.
By default, the High to Low correlation color is green. Notice how this green color is used in this diagram:
When source code lines are selected in both source code grids, correlation data is presented in both directions. The use of color follows the same rules as for the single direction case, it just happens in both directions at the same time.
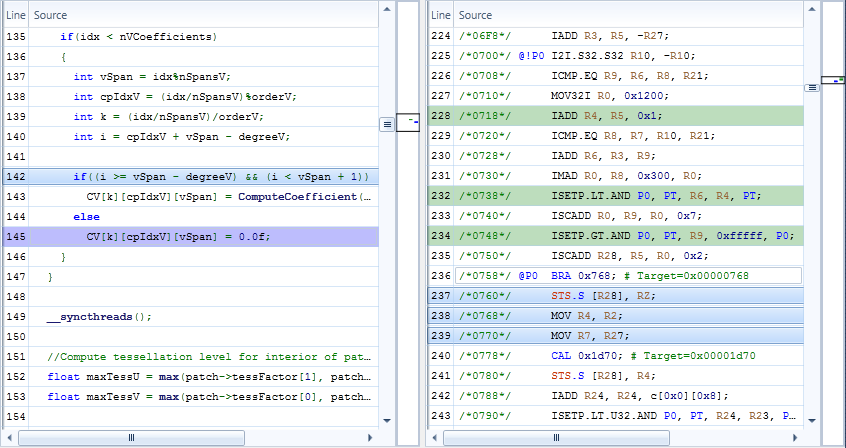
As before, high-level source line 142 maps to lines 228, 232 and 234 in SASS code. However, in this scenario, we now also see that lines 237, 238 and 239 in the SASS code map to line 145 in the high-level code.
By default, the Low to High correlation color is blue. So, in addition to the color use described above for high to low correlation, we now also see:
Source code correlation data is also displayed on the CUDA Launches report page, as shown below.
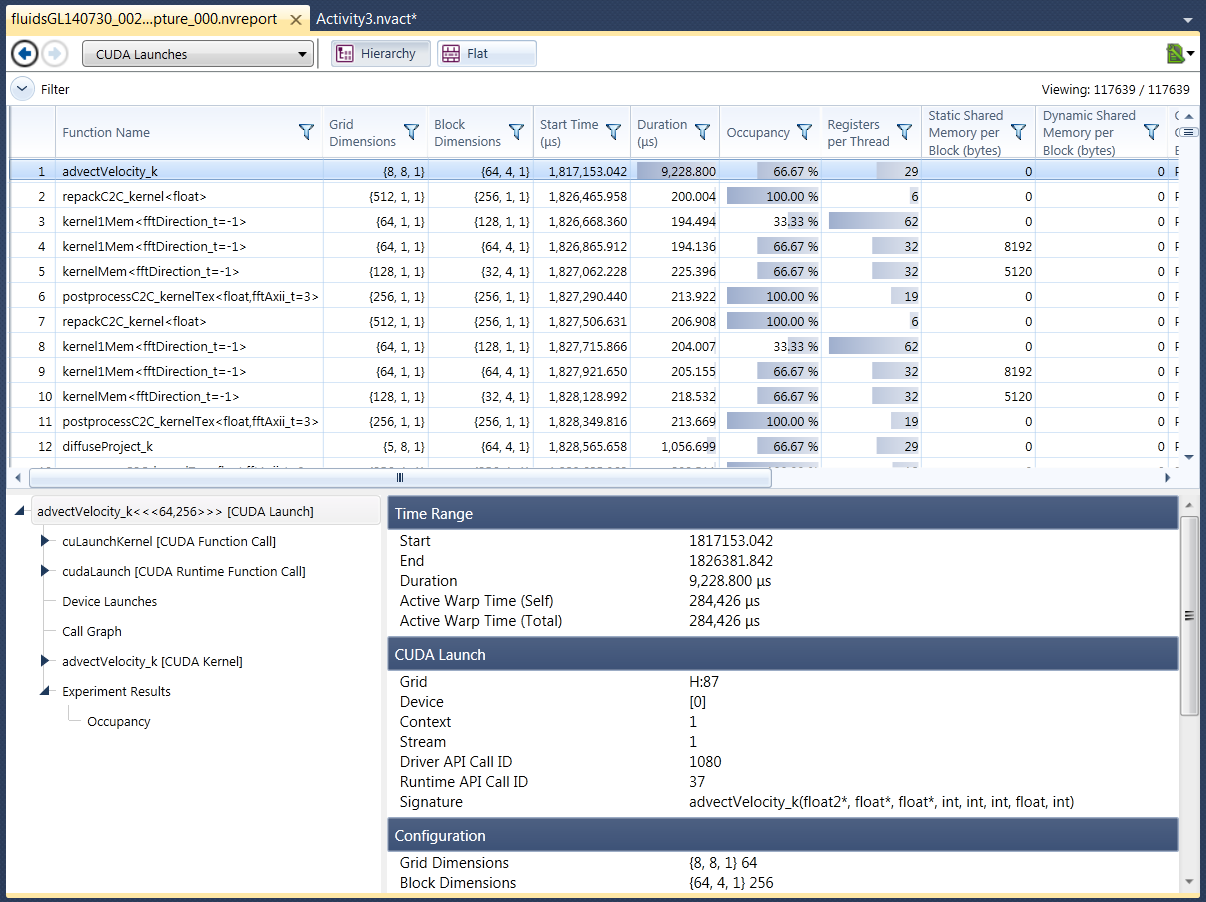
The correlation tree that is presented for a CUDA Launch has been enhanced to include a new branch called CUDA Code Correlation. Under this branch is a list of all code correlation experiment results, like CUDA Instruction Count.
Clicking on a particular experiment presents a list of resulting metrics for that experiment. Clicking on the CUDA Code Correlation node itself presents an aggregate view of all experiment results.
The grid in the correlation details pane presents metric data for the selected experiment and selected kernel launch. Different metric columns may be displayed, depending on which experiment is selected. If the CUDA Code Correlation node is selected in the Correlation Tree, then all results are presented in the grid.
The metrics presented in the grid are rolled up to high-level source code lines. The source code file name and line are also shown in the grid. By right-clicking on the grid header, the column chooser can be invoked to add additional columns to the grid. Additional columns include Directory Name, SASS Line Number, SASS Source, and Kernel name.
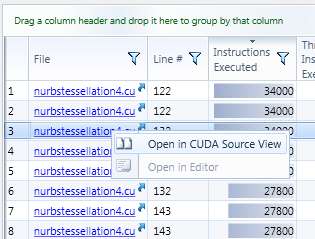
Navigation is also supported from within the correlation data pane.
By default, clicking on the File link will open the CUDA Source View to the selected file and source line number.
However, if the file also exists on disk, then it is possible to also open it in the Visual Studio editor, by right-clicking on the desired row and selecting Open in Editor from the context menu. If the file does not exist on disk, then the Open in Editor menu option will be disabled.
NVIDIA GameWorks Documentation Rev. 1.0.150630 ©2015. NVIDIA Corporation. All Rights Reserved.