You are here: Developer Tools > Desktop Developer Tools > NVIDIA Nsight Visual Studio Edition > Frame Debugger (Direct3D)

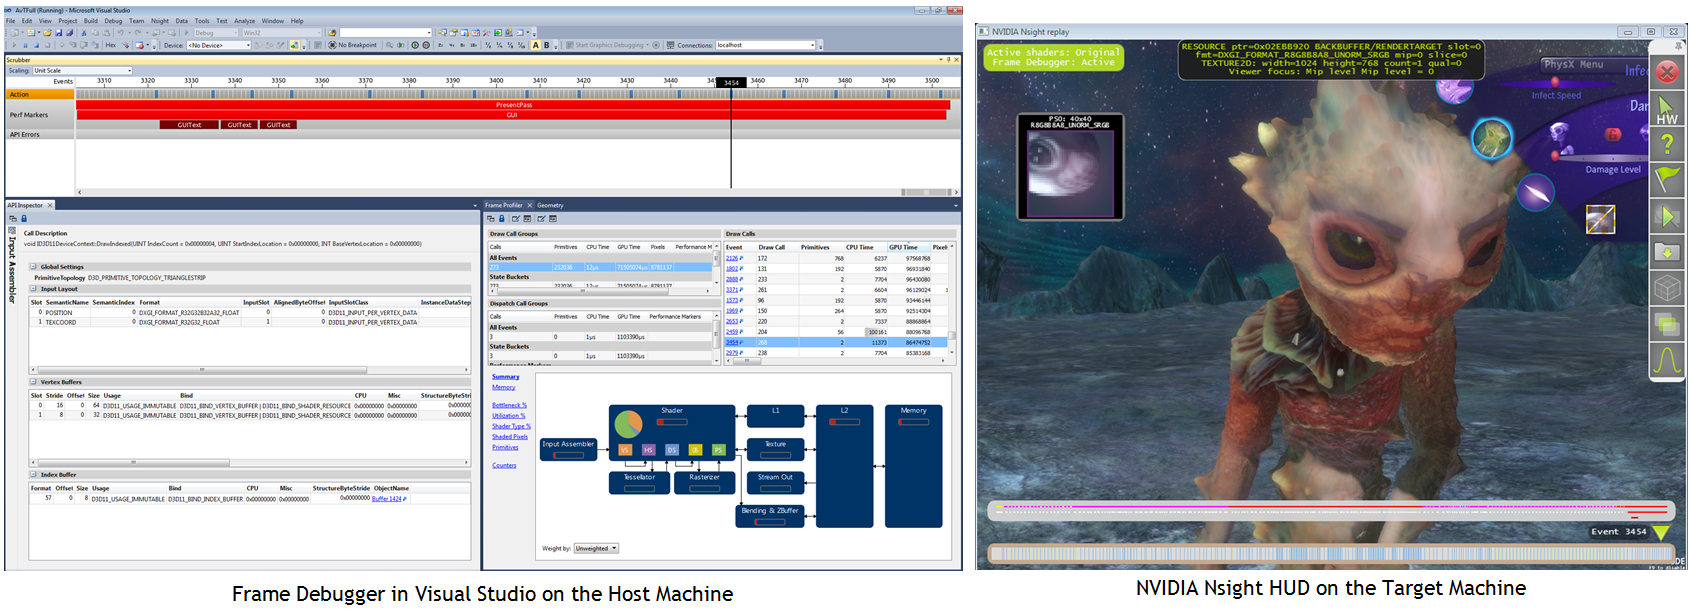
The NVIDIA Nsight Frame Debugger provides the ability for both real-time and capture-based application analysis. In real time, the Performance Dashboard shows a heads-up display (HUD) on the application being debugged, which includes real time performance data from both the GPU and CPU. Once a capture is performed, you can navigate through draw events with the Frame Scrubber, see pipeline states in the API Inspector, inspect render targets and textures in the Resources View, and display profiler information with the scene broken down according to API performance markers. (Many of these features are similar to NVIDIA's PerfHUD software, which may be familiar to you.)

To launch the Frame Debugger:

  1. Begin debugging your graphics project. To do so:
    1. Open your project in Visual Studio.
    2. Build the project.
    3. If you are using remote debugging, make sure the Nsight Monitor is running on the target machine. (The target machine can be either the localhost or a remote machine; however, in a local debugging configuration, the Nsight Monitor will start automatically.)
      For more information on configuring your target and host machines, see Target and Host Setup.
    4. From the Nsight menu, select Start Graphics Debugging to launch your target application. (Wait for the application to finish loading and start. The target application must be running before you can start using the Frame Debugger.)
  2. From the Nsight menu, select Pause and Capture Frame. In Visual Studio, a number of tool windows will open. On the target application, the HUD will appear with the toolbar and scrubber.


of

NVIDIA GameWorks Documentation Rev. 1.0.150630 ©2015. NVIDIA Corporation. All Rights Reserved.