Open topic with navigation
In the following tutorial we look at how to use some of the basic features of the CUDA Debugger. For the purpose of this tutorial, we use a sample application called Matrix Multiply, but you can follow the same procedures, using your own source.
This tutorial covers how to debug an application locally. This means that you will need to have the NVIDIA Nsight host software running on a machine with Visual Studio, and have the Nsight Monitor also running on the same machine.
Make sure that the machine you use meets the system requirements. For more information, see System Requirements for Nsight Software.
That will be our first exercise in this tutorial: configuring a machine for local debugging. In this tutorial:
- EXERCISE 1: Open A Project And Build The Executable
- EXERCISE 2: Set Breakpoints
- EXERCISE 3: Run The CUDA Debugger And Inspect Variables
- EXERCISE 4: Run The Memory Checker
EXERCISE 1: Open a Project and Build an Executable
Let's open the sample project matrixMul. This is a simple CUDA-based application that multiplies 2 matrices. The algorithms in the source code are relatively simple, but will still give you a sense of how the CUDA Debugger works. The matrixMul application is included with the NVIDIA Nsight software.
Make sure that you understand the importance of using a CUDA Toolkit that works with NVIDIA Nsight.

|
CUDA Toolkit: In order to use a project with the NVIDIA Nsight tools, we recommend that you use the compiler that ships with the tools. The default installation directory for this version of the compiler is:
C:\Program Files\NVIDIA GPU Computing Toolkit\CUDA
The compiler is in a subdirectory labeled by its version, such as: ...\<version_number>\bin\nvcc.exe
The NVIDIA Nsight tools work best with this version of the compiler. However, the tools also work with the standard toolkit. Whichever compiler you use, the CUDA Toolkit that you use to compile your CUDA C code must support the following switch for generating debug symbolics: -G0 |
- Open the sample project called matrixMul.
- From the Windows Start menu, select All Programs > NVIDIA Corporation > Nsight Visual Studio Edition 4.7 > Browse NVIDIA Nsight Code Samples.
- Here you will find the ZIP file of the NVIDIA Nsight sample projects. Choose a location to unzip the files.
- Browse to the CUDA >Debugging > Matrix Multiply folder.
- Double-click on the file:
matrixMul_vc100.vcpxroj. - Visual Studio starts. The matrixMul project opens. You might notice that there is another sample project with a similar name, Matrix Multiply (Driver API). This project uses the CUDA driver API. The project we use in this example uses CUDART (CUDA Runtime API).
- Alternatively, you can open the matrixMul project from within Visual Studio.
- From the Nsight menu, choose Help > Samples.
- This will also open the ZIP file for the sample projects. Choose a location to unzip the files.
- Follow the steps outlined above to open the
matrixMul project file.
- Build the matrixMul project.
- From the Visual Studio Build menu, select Rebuild matrixMul.NVIDIA Nsight builds the project.
- View the output window for error messages. If the project built successfully, go to the next step. If the project did not build, you need to correct the problem before going to the next step.
You have now successfully opened the project and built the matrixMul executable.
EXERCISE 2: Set Breakpoints
Before we run the matrixMul application, let's set some breakpoints at key places in the source code. This will cause the CUDA Debugger to pause execution of the target application at those points, and give us an opportunity to inspect the values of variables and the state of each thread.
- Open the file called
matrixMul_kernel.cu.
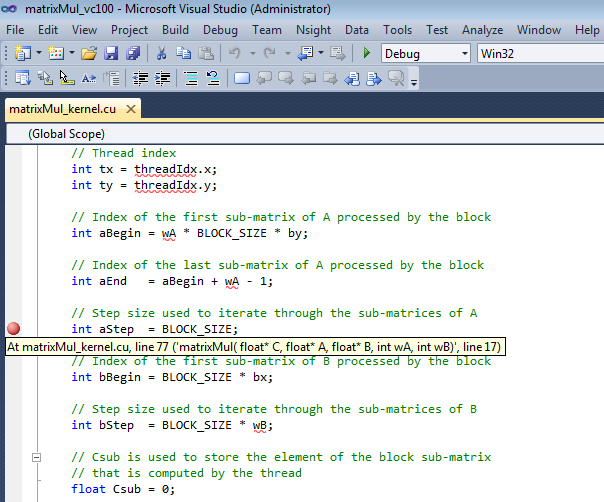
- Set a breakpoint in
matrixMul_kernel.cu at the statement:
int aBegin = wA * BLOCK_SIZE * by;
You can also use any of the other various methods that Visual Studio provides to set breakpoints. Visual Studio marks the location of the breakpoint with a red circle (glyph).
- Let's set another breakpoint. Set a breakpoint at the statement that begins:
int aStep = BLOCK_SIZE;
-
Let's set another breakpoint at:
int BS(ty, tx) = B[b + wB * ty + tx];
This particular breakpoint will be interesting because it occurs on a line of source code immediately preceding the _synchthreads statement.
EXERCISE 3: Run the CUDA Debugger and Inspect Variables
Let's start the CUDA Debugger and take a look at variables and memory at the breakpoints we set.
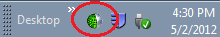
- Start the Nsight Monitor.
- On the target machine, click the Windows Start menu.
- Select All Programs > NVIDIA Corporation > Nsight Visual Studio Edition 4.7 > Nsight Monitor.
The Nsight Monitor starts. The monitor icon appears in the system tray.
- Start the CUDA Debugger. From the Nsight menu in Visual Studio, select Start CUDA Debugging. (Alternately, you can also right-click on the project and choose Start CUDA Debugging.)
The CUDA Debugger starts. Notice that a popup message indicates that a connection has been made. The debugger start the matrixMul application. Execution continues until the debugger encounters the first breakpoint, at which point the debugger pauses execution.
You cannot use F5 to start the CUDA Debugger unless you change the key bindings. The default key binding in Visual Studio for the F5 key is to start the native debugger (CPU debugger). However, once the CUDA Debugger starts, it will respond to the other key bindings that affect run control (such as F11 and F12).
- From the Debug menu, choose Windows > Locals. The Locals window opens. The Locals window displays the variables and their values in the current lexical scope. Notice the value of the variable aBegin in the Locals window.
- Click the Step Into icon or press F11.
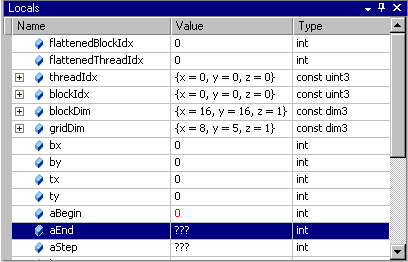
Notice that the value of the variable aBegin changed. The color red indicates that the value changed as a result of the last instruction executed, which in this case was the statement that had the first breakpoint.
Keep in mind that, unlike using the native debugger on CPU code, you cannot change the value in GPU memory by editing the value in the Locals window.
- Click the Run icon or press F5.
The CUDA Debugger resumes execution of the matrixMul application, and pauses before executing the instruction on the line of source code at the next breakpoint. Before we continue execution, let's take a look at the values in memory.
- From the Debug menu, choose Windows > Memory > Memory Window 1. The Memory window opens.
- Click and drag a variable from the Locals window onto the Memory window. The memory window displays the values at the address that corresponds to the variable (or pointer).
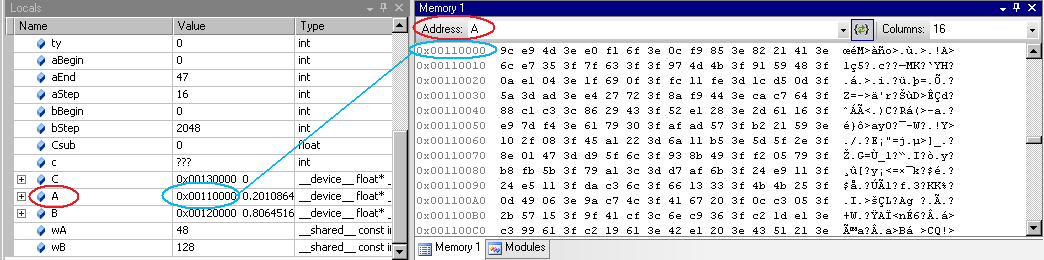
When viewing memory in __local__, __const__ or __shared__ make sure the Visual Studio Memory view is set to Re-evaluate automatically. This will ensure that the memory shown is for the correct memory space. Without this, the display can change to an address which defaults to global memory.
|
|
You cannot change the value in GPU memory by editing the value in the Memory window. |
EXERCISE 4: Run the Memory Checker
The CUDA Memory Checker keeps track of all memory allocations. to ensure that invalid memory locations are not accessed by the target application.
Writing to an out-of-bounds memory location in a CUDA kernel launch causes the GPU to terminate the launch, and places the CUDA context in a permanent error state. This results in all CUDA API functions returning an error code, such as CUDA_ERROR_UNKNOWN. The coding errors that lead to invalid memory access can been difficult to debug without a memory checker.
- From the Nsight menu, select Enable CUDA Memory Checker. A checkmark indicates that the Memory Checker is enabled.
- Start the CUDA Debugger.
- Make sure that the Nsight Monitor is running on the target machine (either a remote machine or localhost, depending on your configuration).
- From Nsight menu, select Start CUDA Debugging. (Or right-click on the project and choose Start CUDA Debugging.)
The CUDA Debugger starts and launches the target application.
NVIDIA GameWorks Documentation Rev. 1.0.150630 ©2015. NVIDIA Corporation. All Rights Reserved.