Grace Performance Tuning Guide#
Introduction#
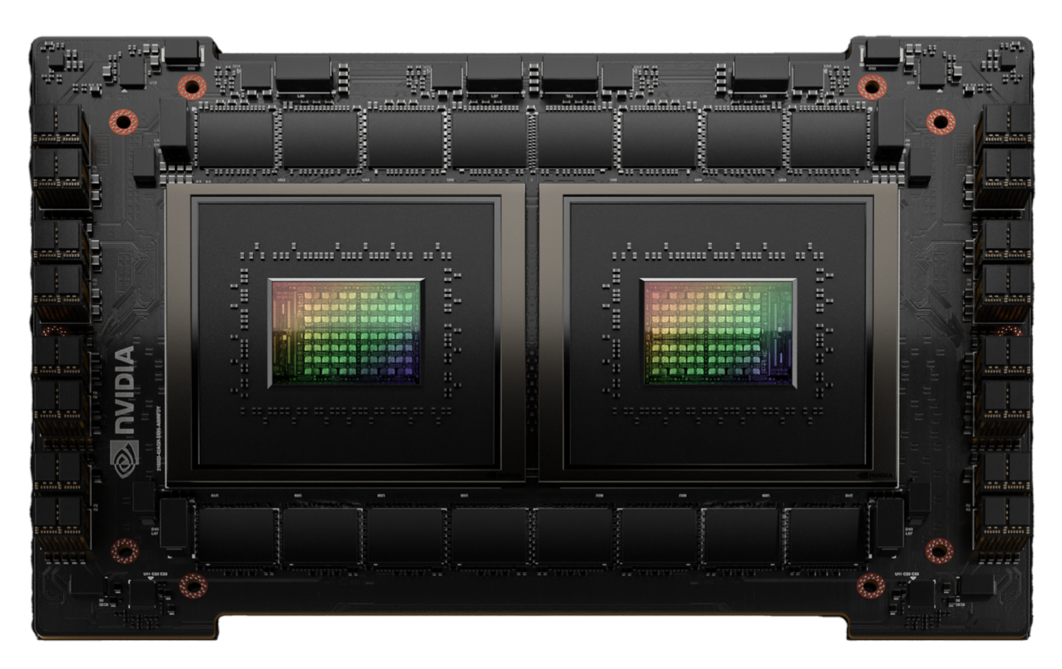
The NVIDIA® Grace™ CPU is the first data center CPU designed by NVIDIA. The Grace CPU has 72 high-performance and power efficient Arm Neoverse V2 Cores that are connected to a high-performance NVIDIA Scalable Coherency Fabric and server-class LPDDR5X memory.
The NVIDIA Grace CPU portfolio includes the NVIDIA Grace CPU Superchip, which is the heart of a dual-socket server with 144 Arm Neoverse V2 cores and up to 960GB of LPDD5X memory in a single compact module that requires only 500W for the CPU and memory. To provide additional flexibility, the Grace CPU C1 delivers incredible performance in a single socket configuration that is optimized for cloud, storage, edge, and telco deployments, and delivers up to two times the performance per watt of conventional x86 servers.
The Grace CPU can also be found in the NVIDIA GH200 Grace Hopper™ Superchip -based architecture. The NVIDIA Grace Hopper Superchip pairs the Grace CPU with the Hopper GPU, and the Grace Blackwell Superchip combines Grace CPU with the world-class GPU performance of the NVIDIA Blackwell GPU. The NVLink®-C2C connects the CPU and GPU with seven times the bandwidth of PCIe Gen 5 x16 and provides memory coherency to simplify programming. The Grace Hopper Superchip also powers the NVIDIA GH200 NVL2 that fully connects two Grace Hopper Superchips with NVLink.
NVIDIA Grace CPU Superchip#
The following table provides the NVIDIA Grace CPU Superchip specfications.
NVIDIA Grace CPU C1 |
NVIDIA Grace CPU Superchip |
|
|---|---|---|
Configuration |
1x Grace CPU |
2x Grace CPU |
Core Count |
72 Arm Neoverse V2 Cores with 4x 128b SVE2 per core |
144 Arm Neoverse V2 Cores with 4x 128b SVE2 per core |
L1 cache |
64KB i-cache + 64KB d-cache per core |
64KB i-cache + 64KB d-cache per core |
L2 cache |
1MB per core |
1MB per core |
L3 cache |
114MB |
228MB |
LPDDR5X size |
120GB, 240GB, and 480GB on-module memory options available |
240GB, 480GB, and 960GB options available |
Memory bandwidth |
|
|
NVLink-C2C bandwidth |
n/a |
Up to 900 GB/s |
PCIe Links |
Up to 4x PCIe Gen 5x16 with option to bifurcate |
Up to 8x PCIe Gen 5 x16 with option to bifurcate |
The following table provides the GH200 Grace Hopper Superchip specfications.
NVIDIA GH200 Grace Hopper Superchip |
NVIDIA GH200 NVL2 |
|
|---|---|---|
Configuration |
1x Grace CPU and 1x Hopper GPU |
2x Grace CPU and 2x Hopper GPU |
Core Count |
72 Arm Neoverse V2 Cores with 4x 128b SVE2 per core |
144 Arm Neoverse V2 Cores with 4x 128b SVE2 per core |
CPU Memory Capacity |
Up to 480 GB LPDDR5X |
Up to 960 GB LPDDR5X |
CPU Memory Bandwidth |
Up to 500 GB/s |
Up to 1 TB/s |
GPU Memory Capacity |
96GB HBM3 | 144 GB HBM3e |
Up to 288 GB HBM3e |
GPU Memory Bandwidth |
Up to 4 TB/s | Up to 4.9 TB/s |
Up to 9.8 TB/s |
NVLInk Bandwidth |
n/a |
Up to 900 GB/s |
High-Performance Architecture#
The Grace CPU delivers high, single-threaded performance, high memory bandwidth, and outstanding data movement capabilities with leadership performance per watt. To enable the Grace CPU Superchip, these design goals required the development of several innovations.
The NVIDIA Grace Hopper Superchip pairs the Grace CPU with the Hopper GPU, and the Grace Blackwell Superchip combines Grace CPU with the world-class GPU performance of the NVIDIA Blackwell GPU.
Alleviate Bottlenecks with NVLink-C2C Interconnect#
To create the Grace CPU Superchip with up to 144 Arm Neoverse V2 cores and avoid bottlenecks when moving data between the chips, the NVLink Chip-2-Chip (C2C) interconnect provides a high-speed, direct connection between chips. A typical server architecture has two sockets, each composed of multiple dies and each die can represent multiple non-uniform memory (NUMA) domains. The Grace CPU Superchip uses a clean and simple memory topology. With only two NUMA nodes and the high-bandwidth NVLink-C2C, the Grace CPU Superchip helps alleviate NUMA bottlenecks for application developers and users.
Similarly, the memory of the Grace Hopper or Grace Blackwell Superchip is set up as two NUMA nodes connected through the high-bandwidth NVLink-C2C, making access to both CPU and GPU memory seamless for applications developers and users.
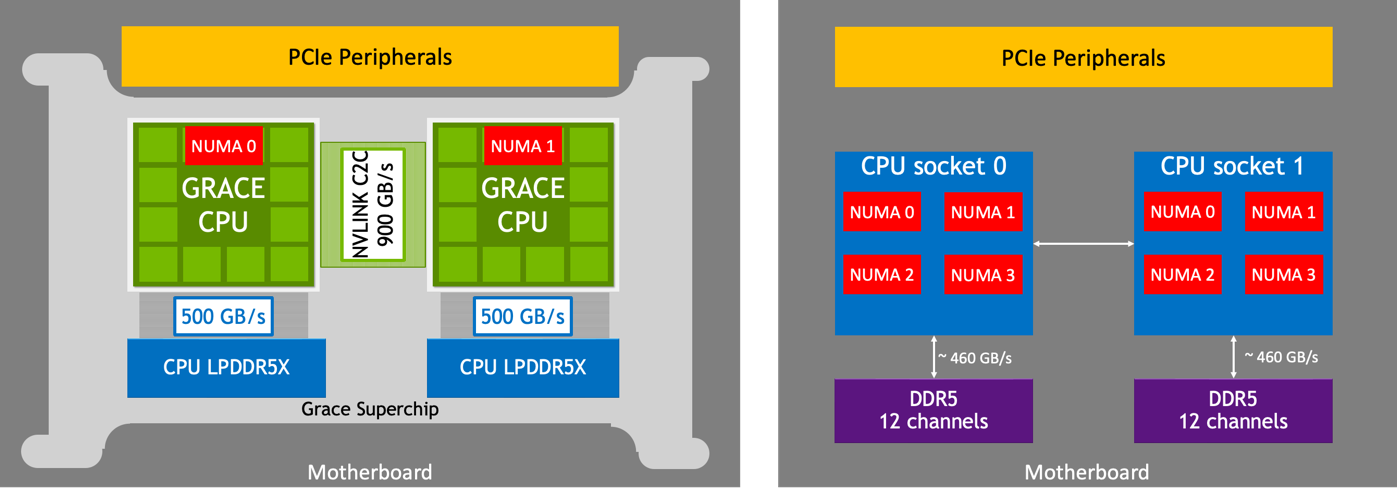
Comparing the Grace CPU Superchip with NVLink-C2C to the Traditional Server Architecture-Based on x86-64.#
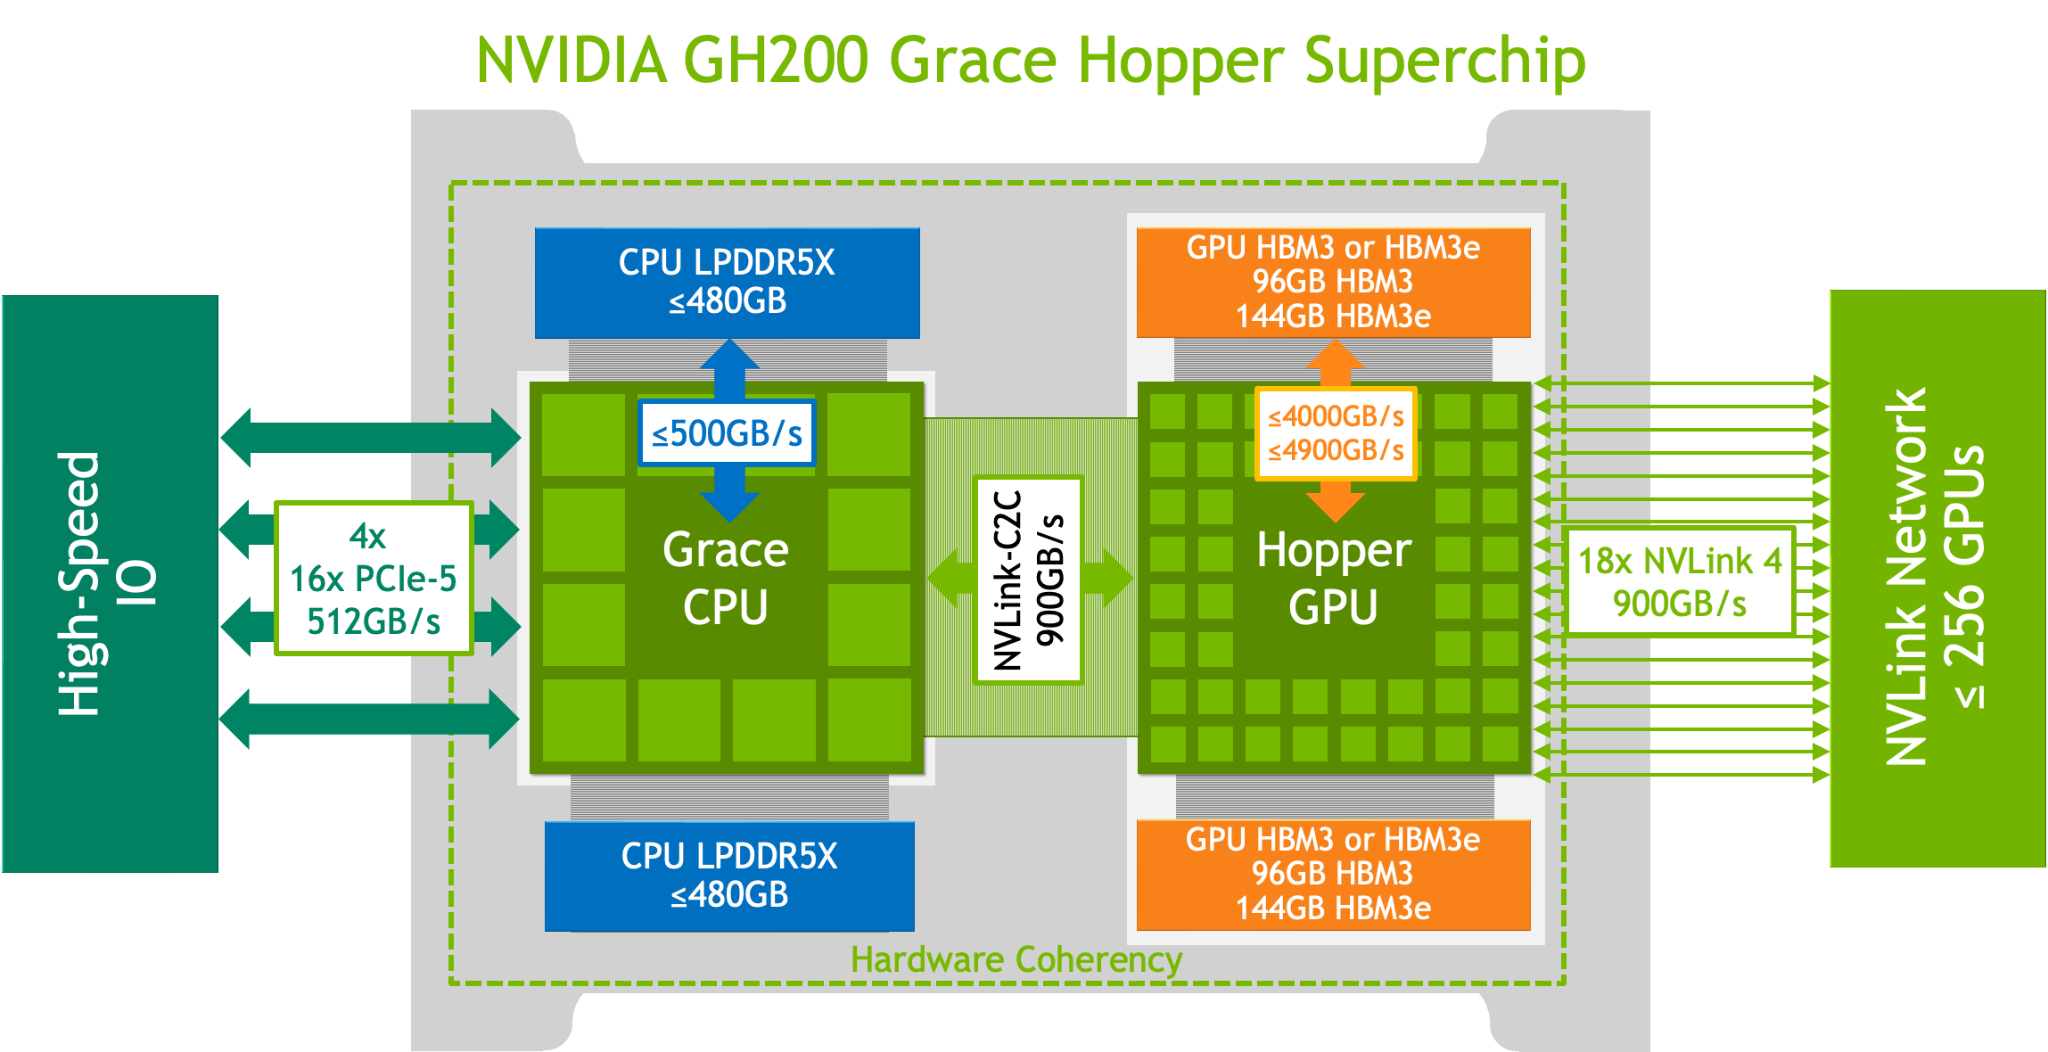
Overview of the Grace Hopper Superchip System#
Scale Cores and Bandwidth with NVIDIA Scalable Coherency Fabric#
NVIDIA Scalable Coherency Fabric (SCF), shown in the Overview of the Grace + Hopper Superchip System graphic is a mesh fabric and distributed cache architecture that is designed by NVIDIA to scale cores and bandwidth. To keep data flowing between the CPU cores, NVLink-C2C, memory, and system IO, SCF provides over 3.2 TB/s of total bisection bandwidth.
The CPU cores and SCF cache partitions are distributed throughout the mesh, and the Cache Switch Nodes route data through the fabric and serve as interfaces between the CPU, cache memory, and system IOs. A Grace CPU Superchip has 234 MB of distributed L3 cache across the two chips.
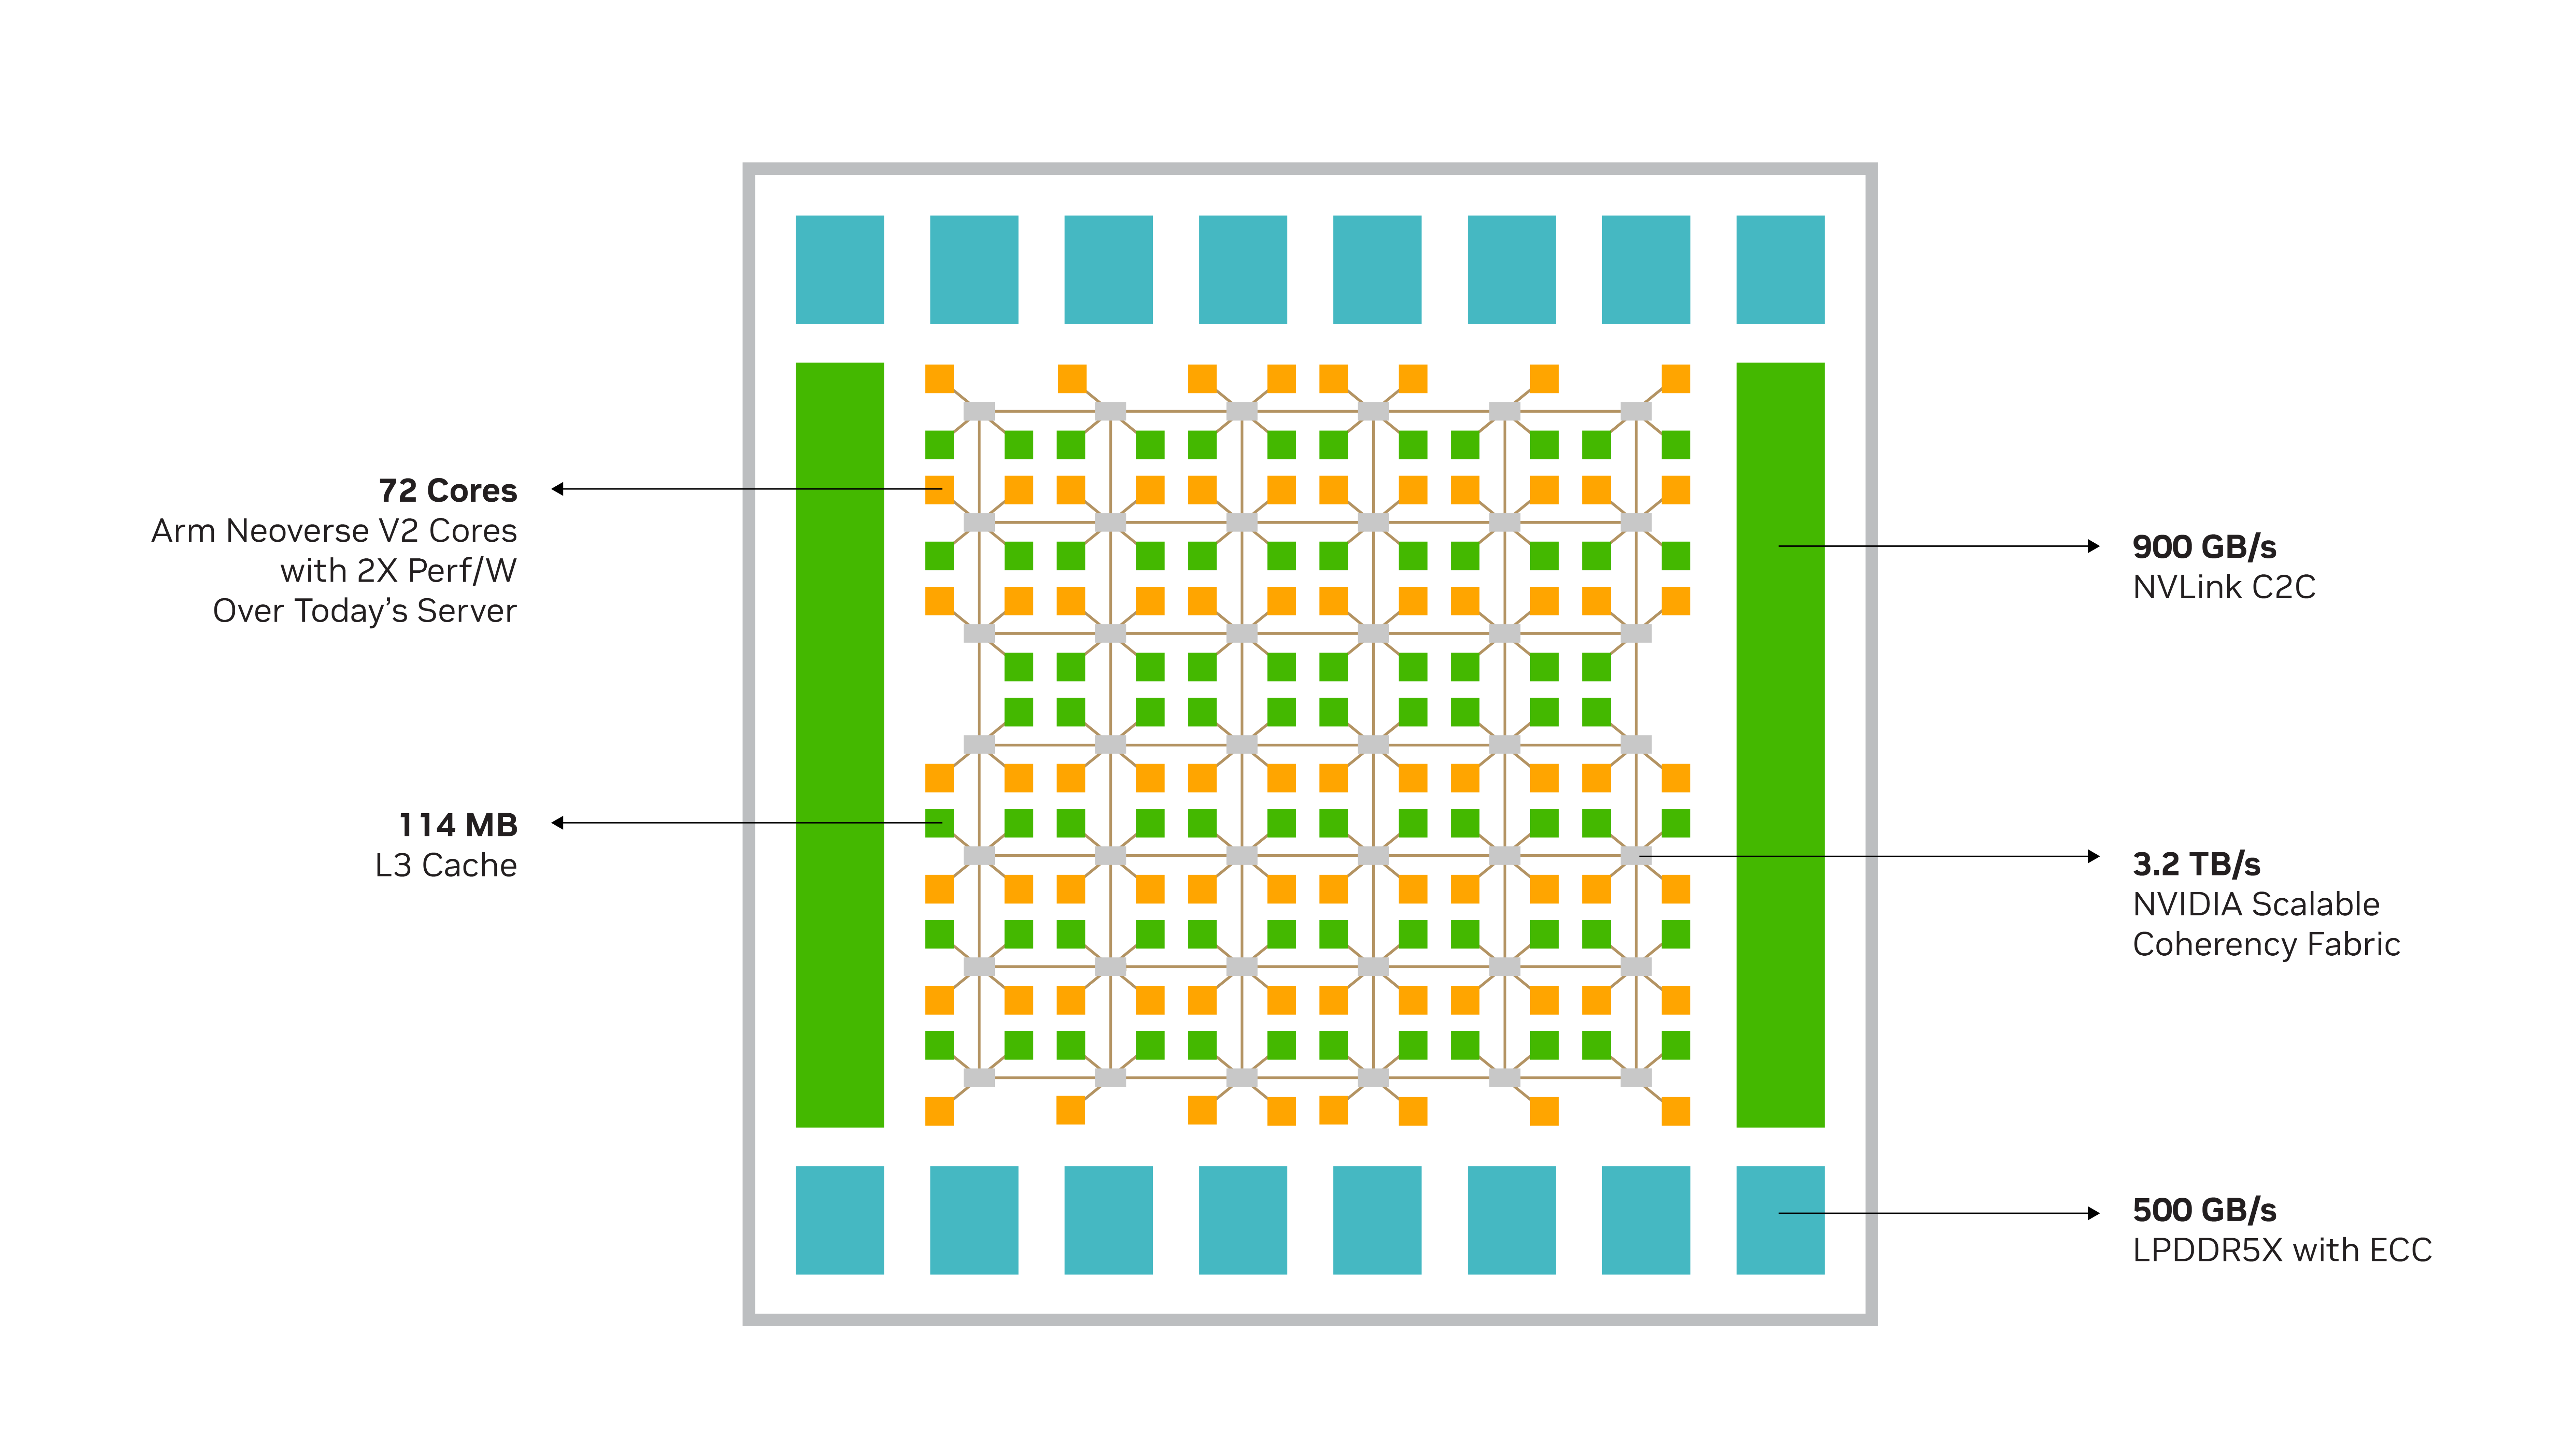
NVIDIA Grace CPU and the NVIDIA Scalable Coherency Fabric#
The figure above shows the NVIDIA Grace CPU and the NVIDIA Scalable Coherency Fabric, which join the Neoverse V2 cores and distributed cache and system IO in a high-bandwidth mesh interconnect. The Grace CPU supports Memory Partitioning and Monitoring (MPAM), which is the Arm® standard to partition the system cache and memory resources to provide performance isolation between jobs. By using MPAM, the NVIDIA-designed SCF Cache supports the partitioning of cache capacity, I/O, and memory bandwidth. MPAM also supports the use of MPAM performance monitor groups (PMGs) to monitor resources, such as cache storage usage and memory bandwidth usage.
LPDDR5X Memory Subsystem#
The Grace CPU Superchip uses up to 960 GB of server-class LPDDR5X memory with Error Correction Code (ECC). This design strikes the optimal balance of bandwidth, energy efficiency, capacity, and cost for large-scale AI and HPC workloads.
The Grace CPU LPDDR5X memory subsystem provides up to 500 GB/s of bandwidth in only about 16W. That is one fifth the power of 12 channels of conventional DDR5 memory. An HBM2e memory subsystem provides substantial memory bandwidth and energy efficiency but at more than three times the cost-per-gigabyte and only one-eighth the maximum capacity with LPDDR5X.
The Grace CPU LPDDR5X architecture is the first data center class, resilient implementation of LPDDR technology. LPDDR5 channel sparing also restores the memory subsystem health upon reboot, which results in a low service rate due to failed memory. This allows the Grace CPU to be deployed in scenarios where serviceability is difficult and expensive.
The co-packaged memory employs a novel provisioning and error detection technique which eliminates the need to service or replace failed memory in the field, allowing the Grace CPU to be deployed in scenarios where serviceability is difficult or costly.
The lower power consumption of LPDDR5X reduces the overall system power requirements and enables more resources to be used in the CPU cores. The compact form factor enables twice the density of a typical DIMM-based design.
CPU I/O#
The Grace CPU Superchip supports up to 128 lanes of PCIe Gen 5 for I/O connectivity, and each PCIe Gen 5 x16 link supports up to 128 GB/s of bi-directional bandwidth and, for additional connectivity, can be bifurcated into 2x8s. Additional PCIe interfaces are provided for system management purposes. Server makers can use the standard expansion options for a variety of PCIe slot form factors with out-of-box support for NVIDIA GPUs, NVIDIA DPUs, NVIDIA ConnectX SmartNICs, E1.S, and M.2 NVMe devices, modular BMC options, and so on.
Grace CPU Core Architecture#
The Grace CPU Neoverse V2 core implements the Armv9.0-A architecture, which extends the architecture that was defined in the Armv8-A architectures up to Armv8.5-A. Application binaries that are built for an Armv8 architecture up to Armv8.5-A will execute on NVIDIA Grace, and this includes binaries that target CPUs like the Ampere Altra, the AWS Graviton2, and the AWS Graviton3.
Important
The NVIDIA HPC Compilers compile for fixed-length, which are not binary compatible between, for example, Graviton and Grace.
SIMD Vectorization#
The Neoverse V2 implements the following single instruction multiple data (SIMD) vector instruction sets in a 4x128-bit configuration:
The Scalable Vector Extension version 2 (SVE2)
Advanced SIMD (NEON)
Each of the four 128-bit functional units can retire SVE2 or NEON instructions, and this design allows more codes to take advantage of the SIMD performance.
Many applications and libraries are already taking advantage of Advanced SIMD (also known as NEON). SVE is a length-agnostic next generation SIMD instruction set architecture (orthogonal to Advanced SIMD) and provides features such as prediction, first faulting loads, gather, scatter, the ability to scale to large vector lengths without requiring recompilation, or porting to new vector lengths by hand. SVE2 provides vector length flexibility, which allows software efforts to focus on application specific optimizations.
SVE is implemented in many flagship Arm implementations, and by using length agnostic instructions for Grace CPU accrue toward portable binaries, ensures compatibility with SVE optimizations. SVE2 also extends the SVE ISA with advanced instructions that can accelerate key HPC applications like machine learning, genomics, and cryptography.
Refer to Compilers for the command-line options with popular compilers.
Atomic Operations#
NVIDIA Grace CPU supports the Large System Extension (LSE), which was introduced in Armv8.1. LSE provides the following low-cost atomic operations, which can improve system throughput for CPU-to-CPU communication, locks, and mutexes:
The Compare and Swap instructions, CAS, and CASP.
Atomic memory operation instructions, LD<OP> and ST<OP>, where <OP> is ADD, CLR, EOR, SET, SMAX, SMIN, UMAX, or UMIN.
The Swap procedure, SWP.
These instructions can operate on integer data. All compilers that support the Grace CPU automatically use these instructions in synchronization functions like GCC’s __atomic built-ins.
Note
Avoid using Load/Store Exclusives because they do not guarantee forward progress in large systems with atomics. Refer to Arm Architecture Reference Manual - Known Issues section “2.43 R22882” for more information.
Additional Armv9 Features#
The Grace CPU implements multiple key features of the Armv9 portfolio that provide utilities in general purpose data center CPUs, including cryptographic acceleration, scalable profiling extension, virtualization extensions, and secure boot. In addition to standard Armv9 features, Grace also supports full-memory encryption.
Performance Tuning for Grace Hopper-Based and Grace Blackwell-Based Applications#
The NVIDIA Grace Hopper and NVIDIA Grace Blackwell Platforms supports all features of CUDA Unified Memory (refer to the CUDA Unified Memory Programming Guide for more information).
Refer to the NVIDIA Hopper Tuning Guide and the NVIDIA Blackwell Tuning Guide for more information about performance tuning.