Measuring Workload Performance with Hardware Performance Counters#
Many software performance analysis tools rely on event counts from hardware performance monitoring units (PMUs) to characterize workload performance. This chapter provides information about how data from PMUs can be gathered and combined to form metrics for performance optimization. For simplicity, the Linux perf tool is used, but the same metrics can be used in any tool that gathers hardware performance events from PMUs, for example, NVIDIA Nsight Systems.
Introduction to Linux perf#
The Linux perf tool is a widely available, open-source tool that is used to collect application-level and system-level performance data. perf can monitor a rich set of software and hardware performance events from different sources and, in many cases, does not require administrator privileges (for example, root).
Installing perf depends on the distribution:
Ubuntu:
apt install linux-tools-$(uname -r)Red Hat:
dnf install perf-$(uname -r)SLES:
zypper install perf
perf gathers data from PMUs by using the perf_event system that is provided by the Linux kernel. Data can be gathered for the lifetime of a process or for a specific period.
perf supports the following measurement types:
Performance summary (
perf stat): perf collects the total PMU event counts for a workload and provides a high-level summary of the basic performance characteristics.This is a good approach for a first-pass performance analysis.
Event-based sampling (
perf record): perf periodically gathers PMU event counters and relates this data to source code locations.The event counts are gathered when a specially configured event counter overflows, which causes an interrupt that contains the instruction pointer addresses and register information. perf uses this information to build stack traces and function-level annotations to characterize the performance of functions of interest on specific call paths. At a high level, this is a good approach for detailed performance characterization after an initial workload characterization. After gathering data with the
perf recordcommand, to analyze the data, use theperf reportorperf annotatecommands.
Configuring Perf#
By default, unprivileged users can only gather information about context-switched events, which includes most of the predefined CPU core events, such as cycle counts, instruction counts, and some software events. To give unprivileged access to all PMUs and global measurements, the following system settings need to be configured:
Note
To configure these settings, you must have root access.
perf_event_paranoid: This setting controls privilege checks in the kernel.Setting this to -1 or 0 allows non-root users to perform per-process and system-wide performance monitoring (refer to Unprivileged users for more information).
kptr_restrict: This setting affects how kernel addresses are exposed.Setting it to 0 assists in kernel symbol resolution.
For example:
$ echo -1 | sudo tee /proc/sys/kernel/perf_event_paranoid
$ echo 0 | sudo tee /proc/sys/kernel/kptr_restrict
To make these settings reboot persistent, follow your Linux distribution’s instructions for configuring system parameters. Typically, you need to edit /etc/sysctl.conf or create a file in the /etc/sysctl.d/ folder that contains the following lines:
kernel.perf_event_paranoid=-1
kernel.kptr_restrict=0
Warning
There are security implications for configuring these settings as shown in the example above. You must read and understand the relevant Linux kernel documentation and consult your system administrator.
To access the PMUs, configure the following kernel driver modules:
Core PMU:
CONFIG_ARM_PMU_ACPICONFIG_ARM_PMUV3
Statistical Profiling Extension PMU:
CONFIG_ARM_SPE_PMU
Coresight System PMU:
CONFIG_ARM_CORESIGHT_PMU_ARCH_SYSTEM_PMUCONFIG_NVIDIA_CORESIGHT_PMU_ARCH_SYSTEM_PMU
Gathering Hardware Performance Data with Perf#
To generate a high-level report of event counts, run the perf stat command. For example, to count cache miss events, CPU cycles, and CPU
instructions for ten seconds:
$ perf stat -a -e cache-misses,cycles,instructions sleep 10
You can also gather information for a specific process:
$ perf stat -e cycles,stalled-cycles-backend ./stream.exe
This counts total CPU cycles and cycles where the CPU is stalled on the frontend or backend while stream.exe is executing.
The -e flag accepts a comma-separated list of performance events, which can be predefined, or raw, events. To see the predefined events, type perf list. Raw events are specified as rXXXX where XXXX is a hexadecimal event number. Refer to the Arm Neoverse V2 Core Technical Reference Manual for more information about event numbers.
For a more detailed analysis, and gather in event-based sampling mode, run the perf record command:
$ perf record -e cycles,instructions,dTLB-loads,dTLB-load-misses ./xhpl.exe
$ perf report
$ perf annotate
Additional information about basic perf usage is available in the perf man pages.
Grace CPU Performance Metrics#
This section provides formulas for useful performance metrics, which are the functions of a hardware event count that more fully express the performance characteristics of the system. For example, a simple count of instructions is less meaningful than the ratio of instructions-per-cycle, which characterizes the processor’s usage. These metrics can be used with any tool that gathers hardware performance event data from the Grace PMUs.
The counters are provided by name, instead of event number because most performance analysis tools provide names for common events. If your tool does not have a named counter for one of the following events, use the translation tables in the Arm Neoverse V2 Core Technical Reference Manual to convert the following event names to raw event numbers. For example, FP_SCALE_OPS_SPEC has event number 0x80C0 and FP_FIXED_OPS_SPEC has event number 0x80C1, so data for the FLOPS computational intensity metric can be gathered using perf by measuring raw events 0x80C0 and 0x80C1:
perf record -e r80C0 -e r80C1 ./a.out
Cycle and Instruction Accounting#
Instructions Per Cycle: Instructions retired per cycle.
INST_RETIRED/CPU_CYCLES
Warning
The stall_slot_backend and stall_slot_frontend events, which are required for computing stage 1 topdown metrics for the Neoverse-V2 CPU core, cannot be used to accurately measure backend and frontend boundness on Grace (refer to errata 2446525). These events are also used for TopdownL1 metrics in perf stat, which also cannot be accurate. The Stalls Slots metric, which counts the percentage of slots that stall in the frontend or backend, can be used in stage 1 instead. If the percentage of stalled slots is high, stage 2 metrics can be used to identify the microarchitectural bottleneck.
Stalled Slots: Percentage of slots that were stalled due to resource constraints in the backend or frontend unit of the processor.
100 * (STALL_SLOT / (CPU_CYCLES * 8) - BR_MIS_PRED * 4 / CPU_CYCLES)Retiring: Percentage of total slots that are retired operations and indicates efficient CPU usage.
100 * (OP_RETIRED/OP_SPEC) * (1 - (STALL_SLOT/(CPU_CYCLES*8)))Bad Speculation: Percentage of total slots that executed operations and didn’t retire due to a pipeline flush.
100 * ((1-OP_RETIRED/OP_SPEC) * (1 - STALL_SLOT/(CPU_CYCLES * 8)) + BR_MIS_PRED * 4 / CPU_CYCLES)
Computational Intensity#
SVE FLOPS: Floating point operations per second in any precision performed by the SVE instructions.
Fused instructions count as two operations, for example, a fused multiply-add instruction increases the count by twice the number of active SVE vector lanes. These operations do not count as floating point operations that are performed by scalar or NEON instructions.
FP_SCALE_OPS_SPEC/TIMENon-SVE FLOPS: Floating point operations per second in any precision performed by an instruction that is not an SVE instruction.
Fused instructions count as two operations, for example, a scalar fused multiply-add instruction increases the count by two, and a fused multiply-add NEON instruction increases the count by twice the number of vector lanes. These operations do not count as floating point operations performed by SVE instructions.
FP_FIXED_OPS_SPEC/TIMEFLOPS: Floating point operations per second in any precision performed by any instruction.
Fused instructions count as two operations.
(FP_SCALE_OPS_SPEC + FP_FIXED_OPS_SPEC)/TIME
Operation Mix#
Load Operations Percentage: Percentage of total operations speculatively executed as load operations.
(LD_SPEC/INST_SPEC)*100Store Operations Percentage: Percentage of total operations speculatively executed as store operations.
(ST_SPEC/INST_SPEC)*100Branch Operations Percentage: Percentage of total operations speculatively executed as branch operations.
((BR_IMMED_SPEC + BR_INDIRECT_SPEC)/INST_SPEC)*100Integer Operations Percentage: Percentage of total operations speculatively executed as scalar integer operations.
(DP_SPEC/INST_SPEC)*100Note
The DP in DP_SPEC stands for Data Processing.
Floating Point Operations Percentage: Percentage of total operations speculatively executed as scalar floating point operations. instructions.
(VFP_SPEC/INST_SPEC)*100Synchronization Percentage: Percentage of total operations speculatively executed as synchronization operations.
((ISB_SPEC + DSB_SPEC + DMB_SPEC)/INST_SPEC)*100Crypto Operations Percentage: Percentage of total operations speculatively executed as crypto operations.
(CRYPTO_SPEC/INST_SPEC)*100SVE Operations (Load/Store Inclusive) Percentage: Percentage of total operations speculatively executed as scalable vector operations, including loads and stores.
(SVE_INST_SPEC/INST_SPEC)*100Advanced SIMD Operations Percentage: Percentage of total operations speculatively executed as advanced SIMD (NEON) operations.
(ASE_INST_SPEC/INST_SPEC)*100SIMD Percentage: Percentage of total operations speculatively executed as integer or floating point vector/SIMD operations.
((SVE_INST_SPEC + ASE_INST_SPEC)/INST_SPEC)*100FP16 Percentage: Percentage of total operations speculatively executed as half-precision floating point operations.
Includes scalar, fused, and SIMD instructions and cannot be used to measure computational intensity.
(FP_HP_SPEC/INST_SPEC)*100FP32 Percentage: Percentage of total operations speculatively executed as single-precision floating point operations.
Includes scalar, fused, and SIMD instructions and cannot be used to measure computational intensity.
(FP_SP_SPEC/INST_SPEC)*100FP64 Percentage: Percentage of total operations speculatively executed as double-precision floating point operations.
Includes scalar, fused, and SIMD instructions and cannot be used to measure computational intensity.
(FP_DP_SPEC/INST_SPEC)*100
SVE Predication#
Full SVE Operations Percentage: Percentage of total operations speculatively executed as SVE SIMD operations with all active predicates.
(SVE_PRED_FULL_SPEC/INST_SPEC)*100Partial SVE Operations Percentage: Percentage of total operations speculatively executed as SVE SIMD operations in which at least one element is FALSE.
(SVE_PRED_PARTIAL_SPEC/INST_SPEC)*100Empty SVE Operations Percentage: Percentage of total operations speculatively executed as SVE SIMD operations with no active predicate.
(SVE_PRED_EMPTY_SPEC/INST_SPEC)*100
Cache Effectiveness#
L1 Data Cache Miss Ratio: Ratio of total level 1 data cache read or write accesses that miss.
L1D_CACHE includes reads and writes and is the sum of L1D_CACHE_RD and L1D_CACHE_WR.
L1D_CACHE_REFILL/L1D_CACHEL1D Cache MPKI: The number of level 1 data cache accesses missed per thousand instructions executed.
(L1D_CACHE_REFILL/INST_RETIRED) * 1000L1I Cache Miss Ratio: The ratio of level 1 instruction cache accesses missed to the total number of level 1 instruction cache accesses.
L1I_CACHE does not measure cache maintenance instructions or non-cacheable accesses.
L1I_CACHE_REFILL/L1I_CACHEL1I Cache MPKI: The number of level 1 instruction cache accesses missed per thousand instructions executed.
(L1I_CACHE_REFILL/INST_RETIRED) * 1000L2 Cache Miss Ratio: The ratio of level 2 cache accesses missed to the total number of level 2 cache accesses.
L2D_CACHE does not count cache maintenance operations or snoops from outside the core.
L2D_CACHE_REFILL/L2D_CACHEL2 Cache MPKI: The number of level 2 unified cache accesses missed per thousand instructions executed.
(L2D_CACHE_REFILL/INST_RETIRED) * 1000LL Cache Read Hit Ratio: The ratio of last level cache read accesses hit in the cache to the total number of last level cache accesses.
(LL_CACHE_RD - LL_CACHE_MISS_RD) / LL_CACHE_RDLL Cache Read Miss Ratio: The ratio of last level cache read accesses missed to the total number of last level cache accesses.
LL_CACHE_MISS_RD / LL_CACHE_RDLL Cache Read MPKI: The number of last level cache read accesses missed per thousand instructions executed.
(LL_CACHE_MISS_RD/INST_RETIRED) * 1000
TLB Effectiveness#
L1 Data TLB Miss Ratio: The ratio of level 1 data TLB accesses missed to the total number of level 1 data TLB accesses.
TLB maintenance instructions are not counted.
L1D_TLB_REFILL/L1D_TLBL1 Data TLB MPKI: The number of level 1 data TLB accesses missed per thousand instructions executed.
(L1D_TLB_REFILL/INST_RETIRED) * 1000L1 Instruction TLB Miss Ratio: The ratio of level 1 instruction TLB accesses missed to the total number of level 1 instruction TLB accesses.
TLB maintenance instructions are not counted.
L1I_TLB_REFILL/L1I_TLBL1 Instruction TLB MPKI: The number of level 1 instruction TLB accesses missed per thousand instructions executed.
(L1I_TLB_REFILL/INST_RETIRED) * 1000DTLB MPKI: The number of data TLB Walks per thousand instructions executed.
(DTLB_WALK/INST_RETIRED) * 1000DTLB Walk Ratio: The ratio of data TLB Walks to the total number of data TLB accesses.
DTLB_WALK / L1D_TLBITLB MPKI: The number of instruction TLB Walks per thousand instructions executed.
(ITLB_WALK/INST_RETIRED) * 1000ITLB Walk Ratio: The ratio of instruction TLB Walks to the total number of instruction TLB accesses.
ITLB_WALK / L1I_TLBL2 Unified TLB Miss Ratio: The ratio of level 2 unified TLB accesses missed to the total number of level 2 unified TLB accesses.
L2D_TLB_REFILL / L2D_TLBL2 Unified TLB MPKI: The number of level 2 unified TLB accesses missed per thousand instructions executed.
(L2D_TLB_REFILL/INST_RETIRED) * 1000
Branching#
Branch Misprediction Ratio: The ratio of branches mispredicted to the total number of branches architecturally executed.
BR_MIS_PRED_RETIRED/BR_RETIREDBranch MPKI: The number of branch mispredictions per thousand instructions executed.
(BR_MIS_PRED_RETIRED/INST_RETIRED) * 1000
Statistical Profiling Extension#
Arm’s Statistical Profiling Extension (SPE) is designed to enhance software performance analysis by providing detailed profiling capabilities. This extension allows you to collect statistical data about software execution and records key execution data, including program counters, data addresses, and PMU events. SPE enhances performance analysis for branches, memory access, and so on, which makes it useful for software optimization. Refer to Statistical Profiling Extension for more information about SPE.
Grace Coresight System PMU Units#
Grace includes the Coresight System PMUs in the following table that are registered by the PMU driver with the specified naming conventions.
System |
Coresight System PMU name |
|---|---|
Scalable Coherency Fabric (SCF) |
nvidia_scf_pmu_<socket-id> |
NVLINK-C2C0 |
nvidia_nvlink_c2c0_pmu_<socket-id> |
NVLINK-C2C1 (Grace-Hopper/Blackwell Only) |
nvidia_nvlink_c2c1_pmu_<socket-id> |
PCIe |
nvidia_pcie_pmu_<socket-id> |
CNVLINK (Multi socket Grace-Hopper/ Blackwell Only) |
nvidia_cnvlink_pmu_<socket-id> |
Coresight System PMU events are not attributable to a core, so the perf tool must be run in system-wide mode. If the measurement requires multiple events to be measured, perf tools support event grouping from the same PMU. For example, to monitor SCF CYCLES, CMEM_WB_ACCESS, and CMEM_WR_ACCESS events from the SCF PMU for socket 0:
$ perf stat -a -e
duration_time,'{nvidia_scf_pmu_0/event=cycles/,nvidia_scf_pmu_0/cmem_wb_access/,nvidia_scf_pmu_0/cmem_wr_access/}'
cmem_write_test
 Performance counter stats for 'system wide':
         168225760 ns duration_time
          10515321 nvidia_scf_pmu_0/event=cycles/
            191567 nvidia_scf_pmu_0/cmem_wb_access/

                 0 nvidia_scf_pmu_0/cmem_wr_access/
      0.168225760 seconds time elapsed
Coresight System PMU Traffic Coverage#
The traffic pattern determines which PMU is used for measuring the different access types, and this might vary depending on the chip configuration.
Grace CPU Superchip#
The following table contains the summary of Coresight System PMU events that can be used to monitor different memory traffic types in Grace CPU Superchip.
PMU |
Event |
Traffic |
|---|---|---|
SCF PMU |
*SCF _CACHE* |
Access to last level cache. |
CMEM* |
Memory traffic from all CPUs (local and remote socket) to local memory. For example, a measurement using socket 0 PMU counts the traffic from CPUs in socket 0 and socket 1 to the memory in socket 0. |
|
SOCKET* or REMOTE* |
Memory traffic from CPUs in local socket to remote memory over C2C. |
|
PCIe PMU |
*LOC |
Memory traffic from PCIe root ports to local memory. |
*REM |
Memory traffic from PCIe root ports to remote memory. |
|
NVLINK-C2C0 PMU |
*LOC |
Memory traffic from PCIe of remote socket to local memory over C2C. For example, a measurement using socket 0 PMU counts the traffic from PCIe of socket 1. Note: The write traffic is limited to PCIe relaxed-ordered write. |
NVLINK-C2C1 PMU |
Unused. Me asurement on this PMU will return zero count. |
|
CNVLINK PMU |
Unused. Me asurement on this PMU will return zero count. |
*The prefix or suffix of the PMU event name.
CPU Traffic Measurement#
This section provides information about measuring CPU traffic.
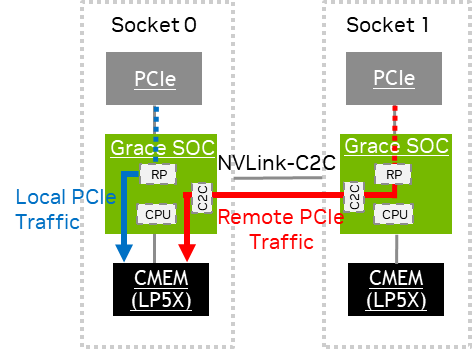
CPU Traffic Measurement#
The local CPU traffic generates CMEM events on the source socket’s SCF PMU. The remote CPU traffic generates the following events:
REMOTE*orSOCKET*events on the source socket’s SCF PMU.CMEM*events on the destination socket’s SCF PMU.
Scalable Coherency Fabric PMU Accounting contains the performance metrics that can be derived from these events.
Here are some examples of CPU traffic measurements that capture the write size in bytes and read size in data beats, where each data beat transfers up to 32 bytes.
# Local traffic: Socket-0 CPU write to socket-0 DRAM.
# The workload performs a 1 GB write and the CPU and memory are pinned to socket-0.
# The result from SCF PMU in socket-0 shows 1,009,299,148 bytes of CPU writes to socket-0
# memory.
nvidia@localhost:~$ sudo perf stat -a -e
duration_time,'{nvidia_scf_pmu_0/cmem_wr_total_bytes/,nvidia_scf_pmu_0/cmem_rd_data/}','{nvidia_scf_pmu_1/remote_socket_wr_total_bytes/,nvidia_scf_pmu_1/remote_socket_rd_data/}'
numactl --cpunodebind=0 --membind=0 dd if=/dev/zero of=/tmp/node0 bs=1M
count=1024 conv=fdatasync
1024+0 records in
1024+0 records out
1073741824 bytes (1.1 GB, 1.0 GiB) copied, 0.125672 s, 8.5 GB/s

Performance counter stats for 'system wide':

      27,496,157 ns duration_time
      1,009,299,148 nvidia_scf_pmu_0/cmem_wr_total_bytes/
      1,213,938 nvidia_scf_pmu_0/cmem_rd_data/
      1,355,223 nvidia_scf_pmu_1/remote_socket_wr_total_bytes/
            7,960 nvidia_scf_pmu_1/remote_socket_rd_data/
      0.127496157 seconds time elapsed

# Local traffic: Socket-0 CPU read from socket-0 DRAM
# The workload performs a 1 GB read and the CPU and memory are pinned to socket-0.

# The result from SCF PMU in socket-0 shows 35,572,420 data beats of CPU reads from socket-0
# memory. Converting it to bytes: 35,572,420 x 32 bytes = 1,138,317,440 bytes.**
nvidia@localhost:~$ sudo perf stat -a -e duration_time,'{nvidia_scf_pmu_0/cmem_wr_total_bytes/,nvidia_scf_pmu_0/cmem_rd_data/}','{nvidia_scf_pmu_1/remote_socket_wr_total_bytes/,nvidia_scf_pmu_1/remote_socket_rd_data/}' numactl --cpunodebind=0 --membind=0 dd of=/dev/null if=/tmp/node0 bs=1M count=1024
1024+0 records in
1024+0 records out
1073741824 bytes (1.1 GB, 1.0 GiB) copied, 0.0872731 s, 12.3 GB/s
Performance counter stats for 'system wide':
      88,826,372 ns duration_time
      36,057,808 nvidia_scf_pmu_0/cmem_wr_total_bytes/
      35,572,420 nvidia_scf_pmu_0/cmem_rd_data/**
            24,173 nvidia_scf_pmu_1/remote_socket_wr_total_bytes/
            4,728 nvidia_scf_pmu_1/remote_socket_rd_data/
      0.088826372 seconds time elapsed

# Remote traffic: Socket-1 CPU write to socket-0 DRAM
# The workload performs a 1 GB write. The CPU is pinned to socket-1 and memory is pinned to socket-0.
# The result from SCF PMU in socket-1 shows 961,728,219 bytes of remote writes to socket-0**
# memory. The remote writes are also captured by the destination (socket-0) SCF PMU that shows
# 993,278,696 bytes of any CPU writes to socket-0 memory.
nvidia@localhost:~$ sudo perf stat -a -e duration_time,'{nvidia_scf_pmu_0/cmem_wr_total_bytes/,nvidia_scf_pmu_0/cmem_rd_data/}','{nvidia_scf_pmu_1/remote_socket_wr_total_bytes/,nvidia_scf_pmu_1/remote_socket_rd_data/}'
numactl --cpunodebind=1 --membind=0 dd if=/dev/zero of=/tmp/node0 bs=1M
count=1024 conv=fdatasync
1024+0 records in
1024+0 records out
1073741824 bytes (1.1 GB, 1.0 GiB) copied, 0.171349 s, 6.3 GB/s

 Performance counter stats for 'system wide':
       172,847,464 ns duration_time
       993,278,696 nvidia_scf_pmu_0/cmem_wr_total_bytes/
       1,040,902 nvidia_scf_pmu_0/cmem_rd_data/
       961,728,219 nvidia_scf_pmu_1/remote_socket_wr_total_bytes/**
       1,065,136 nvidia_scf_pmu_1/remote_socket_rd_data/
       0.172847464 seconds time elapsed

# Remote traffic: Socket-1 CPU read from socket-0 DRAM**
# The workload performs a 1 GB read. The CPU is pinned to socket-1 and memory is pinned to socket-0.
# The result from SCF PMU in socket-1 shows 36,189,087 data beats of remote reads from socket-0
# memory. The remote reads are also captured by the destination (socket-0) SCF PMU that shows
# 33,542,984 data beats of any CPU read from socket-0 memory.**
# Converting it to bytes:
# - Socket-1 CPU remote read: 36,189,087 x 32 bytes = 1,158,050,784 bytes.
# - Any CPU read from socket-0 memory = 33,542,984 x 32 bytes = 1,073,375,488 bytes.
nvidia@localhost:~$ sudo perf stat -a -e
duration_time,'{nvidia_scf_pmu_0/cmem_wr_total_bytes/,nvidia_scf_pmu_0/cmem_rd_data/}','{nvidia_scf_pmu_1/remote_socket_wr_total_bytes/,nvidia_scf_pmu_1/remote_socket_rd_data/}'
numactl --cpunodebind=1 --membind=0 dd of=/dev/null if=/tmp/node0 bs=1M
count=1024
1024+0 records in
1024+0 records out
1073741824 bytes (1.1 GB, 1.0 GiB) copied, 0.133185 s, 8.1 GB/s

Performance counter stats for 'system wide':

     134,526,031 ns duration_time
     19,588,224 nvidia_scf_pmu_0/cmem_wr_total_bytes/
     33,542,984 nvidia_scf_pmu_0/cmem_rd_data/
     18,771,438 nvidia_scf_pmu_1/remote_socket_wr_total_bytes/
     36,189,087 nvidia_scf_pmu_1/remote_socket_rd_data/**
     0.134526031 seconds time elapsed
PCIe Traffic Measurement#
This section provides information about measuring PCIe traffic.

PCIe Traffic Measurement#
The local PCIe traffic generates *LOC events on the source socket’s PCIe PMU, and the remote PCIe traffic generates the following events:
*REMevents on the source socket’s PCIe PMU.*LOCevents on the destination socket’s NVLINK-C2C0 PMU.
PCIe PMU Accounting contains the performance metrics that can be derived from these events.
The PCIe PMU monitors traffic from PCIe root ports to local/remote memory. Grace SOC supports up to 10 PCIe root ports. At least one of these root ports need to be specified in perf tool using the root_port bitmap filter. For example, the root_port=0xF filter corresponds to root ports 0 through 3.
Example: To count the rd_bytes_loc event from PCIe root port 0 and 1 of socket 0:
$ perf stat -a -e nvidia_pcie_pmu_0/rd_bytes_loc,root_port=0x3/
Example: To count the rd_bytes_rem event from PCIe root port 2 in socket 1 and measure the test duration (in nanoseconds):
$ perf stat -a -e duration_time,'{nvidia_pcie_pmu_1/rd_bytes_rem,root_port=0x4/}'
Here is an example of finding the root port number of a PCIe device.
# Find the root port number of the NVLINK drive on each socket.
# nvme0 is attached to domain number 0018, which corresponds to socket-1 root port 0x8.
# nvme1 is attached to domain number 0008, which corresponds to socket-0 root port 0x8.
nvidia@localhost:~$ readlink -f /sys/class/nvme/nvme*
/sys/devices/pci0018:00/**0018**:00:00.0/0018:01:00.0/nvme/nvme0
/sys/devices/pci0008:00/**0008**:00:00.0/0008:01:00.0/0008:02:00.0/0008:03:00.0/nvme/nvme1

# Query the mount point of each nvme drive to get the path for the workloads below.
nvidia@localhost:~$ df -H | grep nvme0
/dev/**nvme0n1p2** 983G 625G 309G 67% /
nvidia@localhost:~$ df -H | grep nvme1
/dev/**nvme1n1** 472G 1.1G 447G 1% /var/data0
Here are some examples of PCIe traffic measurements when reading data from DRAM and storing the result to an NVME drive. These capture the size of read/write to local/remote memory in bytes.
# Local traffic: Socket-0 PCIE read from socket-0 DRAM.
# The workload copies data from socket-0 DRAM to socket-0 NVME in root port 0x8. The NVME would
# perform a read request to DRAM.
# The root_port filter value: 1 << root port number = 1 << 8 = 0x100
# The result from PCIe PMU in socket-0 shows 1,168,472,064 bytes of PCIe read from socket-0 memory.
nvidia@localhost:~$ sudo perf stat -a -e
duration_time,'{nvidia_pcie_pmu_0/rd_bytes_loc,root_port=0x100/,nvidia_pcie_pmu_0/wr_bytes_loc,root_port=0x100/,nvidia_pcie_pmu_0/rd_bytes_rem,root_port=0x100/,nvidia_pcie_pmu_0/wr_bytes_rem,root_port=0x100/}'
numactl --cpunodebind=0 --membind=0 dd if=/dev/zero of=/var/data0/pcie_test_0 bs=16M count=64 oflag=direct conv=fdatasync
64+0 records in
64+0 records out
1073741824 bytes (1.1 GB, 1.0 GiB) copied, 1.96463 s, 547 MB/s

   Performance counter stats for 'system wide':
      1,966,391,711 ns duration_time
      1,168,472,064 nvidia_pcie_pmu_0/rd_bytes_loc,root_port=0x100/
      31,250,176 nvidia_pcie_pmu_0/wr_bytes_loc,root_port=0x100/
            49,152 nvidia_pcie_pmu_0/rd_bytes_rem,root_port=0x100/
            0 nvidia_pcie_pmu_0/wr_bytes_rem,root_port=0x100/
      1.966391711 seconds time elapsed
# Remote traffic: Socket-1 PCIE read from socket-0 DRAM.
# The workload copies data from socket-0 DRAM to socket-1 NVME in root port 0x8. The NVME would perform a read request to DRAM.
# The root_port filter value: 1 << root port number = 1 << 8 = 0x100
# The result from PCIe PMU in socket-1 shows 1,073,762,304 bytes of PCIe read from socket-0 memory.
# The remote reads are also captured by the destination (socket-0) NVLINK C2C0 PMU that shows 1,074,057,216 bytes of reads.
nvidia@localhost:~$ sudo perf stat -a -e
duration_time,'{nvidia_pcie_pmu_1/rd_bytes_loc,root_port=0x100/,nvidia_pcie_pmu_1/wr_bytes_loc,root_port=0x100/,nvidia_pcie_pmu_1/rd_bytes_rem,root_port=0x100/,nvidia_pcie_pmu_1/wr_bytes_rem,root_port=0x100/}','{nvidia_nvlink_c2c0_pmu_0/rd_bytes_loc/,nvidia_nvlink_c2c0_pmu_0/wr_bytes_loc/}' numactl --membind=0 dd if=/dev/zero of=/home/nvidia/pcie_test_0 bs=16M count=64 oflag=direct conv=fdatasync
64+0 records in
64+0 records out
1073741824 bytes (1.1 GB, 1.0 GiB) copied, 0.73373 s, 1.5 GB/s

Performance counter stats for 'system wide':
      735,201,612 ns duration_time
      6,398,720 nvidia_pcie_pmu_1/rd_bytes_loc,root_port=0x100/
         164,096 nvidia_pcie_pmu_1/wr_bytes_loc,root_port=0x100/
      1,073,762,304 nvidia_pcie_pmu_1/rd_bytes_rem,root_port=0x100/**
          0 nvidia_pcie_pmu_1/wr_bytes_rem,root_port=0x100/
      1,074,057,216 nvidia_nvlink_c2c0_pmu_0/rd_bytes_loc/
         32,768 nvidia_nvlink_c2c0_pmu_0/wr_bytes_loc/
      0.735201612 seconds time elapsed
Grace Hopper/Blackwell Superchip#
The following table contains a summary of the Coresight System PMU events that can be used to monitor different memory traffic types in Grace Hopper/Blackwell Superchip.
PMU |
Event |
Traffic |
|---|---|---|
SCF PMU |
*SCF_CACHE* |
Access to last level cache. |
CMEM* |
Memory traffic from CPU to CPU memory. |
|
GMEM* |
Memory traffic from CPU to GPU memory over C2C. |
|
PCIe PMU |
*LOC |
Memory traffic from PCIe root ports to CPU or GPU memory. |
NVLINK-C2C0 PMU |
*LOC |
ATS translated or EGM memory traffic from GPU to CPU memory over C2C. |
NVLINK-C2C1 PMU |
*LOC |
Non-ATS translated memory traffic from GPU to CPU or GPU memory over C2C. |
CNVLINK PMU |
Unused. Measurement on this PMU will return a zero count. |
* The prefix or suffix of a PMU event name.
Refer to Grace CPU Superchip for more information about CPU and PCIe traffic measurement.
GPU Traffic Measurement#
This section provides information about measuring the GPU traffic.
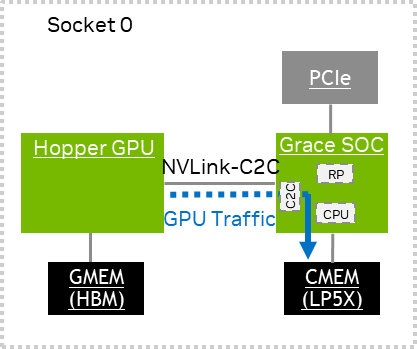
GPU Traffic Measurement#
The GPU traffic generates *LOC events on the Grace Coresight System C2C PMUs, and the NVLINK-C2C0 PMU captures ATS translated or EGM memory traffic. NVLINK-C2C1 PMU captures non-ATS translated traffic. The solid line indicates only that the path from the SOC to memory has been captured. The C2C PMUs do not capture the latency effect of the C2C interconnect. Refer to NVLink C2C PMU Accounting for more information about the performance metrics that can be derived from these events.
Here are some examples of GPU traffic measurements that capture the size of read/write in bytes.
# GPU write to CPU DRAM.
# The workload performs a write by GPU copy engine to CPU DRAM.
# The result from NVLINK-C2C0 PMU shows 4,026,531,840 bytes of writes to DRAM.

nvidia@localhost:/home/nvidia/nvbandwidth$ sudo perf stat -a -e '{nvidia_nvlink_c2c0_pmu_0/total_bytes_loc/,nvidia_nvlink_c2c0_pmu_0/rd_bytes_loc/,nvidia_nvlink_c2c0_pmu_0/wr_bytes_loc/}','{nvidia_nvlink_c2c1_pmu_0/total_bytes_loc/,nvidia_nvlink_c2c1_pmu_0/rd_bytes_loc/,nvidia_nvlink_c2c1_pmu_0/wr_bytes_loc/}'
./nvbandwidth -t 1
nvbandwidth Version: v0.4
Built from Git version: v0.4

NOTE: This tool reports current measured bandwidth on your system.
Additional system-specific tuning may be required to achieve maximal peak bandwidth.

CUDA Runtime Version: 12050
CUDA Driver Version: 12050
Driver Version: 555.42.02
Device 0: NVIDIA GH200 120GB
Running device_to_host_memcpy_ce.memcpy CE CPU(row) <- GPU(column) bandwidth (GB/s)

      0
0 295.07

SUM **device_to_host_memcpy_ce** 295.07

  Performance counter stats for 'system wide':

      4,234,950,656 nvidia_nvlink_c2c0_pmu_0/total_bytes_loc/
      208,418,816 nvidia_nvlink_c2c0_pmu_0/rd_bytes_loc/
      **4,026,531,840 nvidia_nvlink_c2c0_pmu_0/wr_bytes_loc/**
      26,981,632 nvidia_nvlink_c2c1_pmu_0/total_bytes_loc/
      6,337,792 nvidia_nvlink_c2c1_pmu_0/rd_bytes_loc/
      20,643,840 nvidia_nvlink_c2c1_pmu_0/wr_bytes_loc/
      0.777059774 seconds time elapsed
**# GPU read from CPU DRAM.**
**# The workload performs a read by GPU copy engine from CPU DRAM.**
**# The result from NVLINK-C2C0 PMU shows 4,234,927,104 bytes of reads from DRAM.**
nvidia@localhost:/home/nvidia/nvbandwidth$ sudo perf stat -a -e'{nvidia_nvlink_c2c0_pmu_0/total_bytes_loc/,nvidia_nvlink_c2c0_pmu_0/rd_bytes_loc/,nvidia_nvlink_c2c0_pmu_0/wr_bytes_loc/}','{nvidia_nvlink_c2c1_pmu_0/total_bytes_loc/,nvidia_nvlink_c2c1_pmu_0/rd_bytes_loc/,nvidia_nvlink_c2c1_pmu_0/wr_bytes_loc/}'
./nvbandwidth -t 0
nvbandwidth Version: v0.4
Built from Git version: v0.4
NOTE: This tool reports current measured bandwidth on your system.
Additional system-specific tuning may be required to achieve maximal peak bandwidth.

CUDA Runtime Version: 12050
CUDA Driver Version: 12050
Driver Version: 555.42.02

Device 0: NVIDIA GH200 120GB

Running host_to_device_memcpy_ce.memcpy CE CPU(row) -> GPU(column) bandwidth (GB/s)

       0
0 408.42

SUM **host_to_device_memcpy_ce** 408.42
 Performance counter stats for 'system wide':
      4,436,253,696 nvidia_nvlink_c2c0_pmu_0/total_bytes_loc/
      **4,234,927,104 nvidia_nvlink_c2c0_pmu_0/rd_bytes_loc/**
      201,326,592 nvidia_nvlink_c2c0_pmu_0/wr_bytes_loc/
      26,949,888 nvidia_nvlink_c2c1_pmu_0/total_bytes_loc/
      6,356,480 nvidia_nvlink_c2c1_pmu_0/rd_bytes_loc/
      20,593,408 nvidia_nvlink_c2c1_pmu_0/wr_bytes_loc/
      0.771266524 seconds time elapsed
Scalable Coherency Fabric PMU Accounting#
SCF PMU Events#
The following tables provide the events exposed by the PMU driver and perf tool.
Event Name |
ID |
Description |
|---|---|---|
CYCLES |
0x100000000 |
SCF Clock Cycles. |
BUS_CYCLES |
0x1d |
Same with cycles |
Event Name |
ID |
Description |
|---|---|---|
SCF_CACHE_ALLOCATE |
0xf0 |
Read / Write / Atomic / Prefetch requests which are allocated in LL Cache. |
SCF_CACHE_REFILL |
0xf1 |
Read / Atomic/ StashOnce requests which miss in Last Level cache and inner caches resulting in request to next level memory hierarchy (# of Read Requests which miss in CTAG and DIR and fetch data from L4). |
SCF_CACHE |
0xf2 |
LL Cache Read / Write / Atomic /
Snoop / Prefetch requests not
resulting in decode errors.
|
SCF_CACHE_WB |
0xf3 |
Number of capacity evictions from LL Cache. |
Event Name |
ID |
Description |
|---|---|---|
CMEM_RD_DATA |
0x1a5 |
Counts the total number of SCF Read data beats transferred from Local Grace DRAM to Local or Remote CPU. Each data beat transfers up to 32 bytes. |
CMEM_RD_ACCESS |
0x1a6 |
Counts the number of SCF Read accesses from Local or Remote CPU to Local Grace DRAM. Increments by total new Read accesses each cycle. |
CMEM_RD_OUTSTANDING |
0x1a7 |
Counts the total number of outstanding SCF Read accesses from Local or Remote CPU to Local socket Grace DRAM. Increments by total outstanding count each cycle. |
CMEM_WB_DATA |
0x1ab |
Counts the total number of SCF Write-back data beats (clean/dirty) transferred from Local or Remote CPU to Local Grace DRAM (excluding Write-unique/non-coherent Writes). Each wb_data beat transfers 32 bytes of data. |
CMEM_WB_ACCESS |
0x1ac |
Counts the number of SCF Write-back accesses (clean/dirty) from Local or Remote CPU to Local Grace DRAM (excluding Write-unique/non-coherent Writes). Increments by total new Write accesses each cycle. Each Write-back access is a 64-byte transfer. |
CMEM_WR_DATA |
0x1b1 |
Counts the number of bytes transferred, based on size field, for SCF Write-unique and non-coherent Writes (including for WriteZeros which is counted as 64 bytes) from Local or Remote CPU to Local Grace DRAM. |
CMEM_WR_TOTAL_BYTES |
0x1db |
Counts the total number of bytes
transferred to Local Grace DRAM by
Write-backs, Write-unique and
non-coherent Writes from Local or
Remote CPU. |
CMEM_WR_ACCESS |
0x1ca |
Counts the total number of SCF Write-unique and non-coherent Write (including WriteZeros) requests from Local or Remote CPU to Local Grace DRAM. |
Event Name |
ID |
Description |
|---|---|---|
GMEM_RD_DATA |
0x16d |
Counts the total number of Read data beats transferred from Local coherent GPU DRAM to Local or Remote CPU. Each data beat transfers up to 32 bytes. |
GMEM_RD_ACCESS |
0x16e |
Counts the number of SCF Read accesses from Local or Remote CPU to Local coherent GPU DRAM. Increments by total new Read accesses each cycle. |
GMEM_RD_OUTSTANDING |
0x16f |
Indicates the total number of outstanding Read requests from Local or Remote CPU to coherent GPU DRAM. Increments by outstanding Read request count each cycle. |
GMEM_WB_DATA |
0x173 |
Counts the total number of SCF Write-back data beats transferred from Local or Remote CPU to Local coherent GPU DRAM (excluding Write-unique / non-coherent Writes). Each wb_data beat transfers 32 bytes of data. |
GMEM_WB_ACCESS |
0x174 |
Counts the number of SCF Write-back accesses (clean and dirty) from Local or Remote CPU to Local coherent GPU DRAM (excluding Write-unique / non-coherent Writes) . Increments by total new Write accesses each cycle. Each Write-back access is a 64-byte transfer. |
GMEM_WR_DATA |
0x179 |
Counts the number of bytes transferred based on size field for SCF Write-unique and non-coherent Writes from Local or Remote CPU to Local coherent GPU DRAM. |
GMEM_WR_ACCESS |
0x17b |
Counts the total number of SCF Write-unique and non-coherent Write requests from Local or Remote CPU to Local coherent GPU DRAM. |
GMEM_WR_TOTAL_BYTES |
0x1a0 |
Counts the total number of bytes
transferred to Local coherent GPU
DRAM by Write-backs, Write-unique
and non-coherent Writes.
|
Event Name |
ID |
Description |
|---|---|---|
SOCKET_0_RD_DATA |
0x101 |
Counts the total number of SCF Read data beats transferred from CNVLINK Socket 0 memory or NVLINK-C2C socket 0 memory to Local CPU. Each data beat transfers up to 32 bytes. |
SOCKET_1_RD_DATA |
0x102 |
Counts the total number of SCF Read data beats transferred from CNVLINK Socket 1 memory or NVLINK-C2C socket 1 memory to Local CPU. Each data beat transfers up to 32 bytes. |
SOCKET_2_RD_DATA |
0x103 |
Counts the total number of SCF Read data beats transferred from CNVLINK Socket 2 memory to Local CPU. Each data beat transfers up to 32 bytes. |
SOCKET_3_RD_DATA |
0x104 |
Counts the total number of SCF Read data beats transferred from CNVLINK Socket 3 memory to Local CPU. Each data beat transfers up to 32 bytes. |
SOCKET_0_WB_DATA |
0x109 |
Counts the total number of SCF Write-back data beats transferred from Local CPU to CNVLINK socket 0 memory or NVLINK-C2C socket 0 memory (excluding Write-unique/non-coherent Writes). Each wb_data beat transfers 32 bytes of data. |
SOCKET_1_WB_DATA |
0x10a |
Counts the total number of SCF Write-back data beats transferred from Local CPU to CNVLINK socket 1 memory or NVLINK-C2C socket 1 memory (excluding Write-unique/non-coherent Writes). Each wb_data beat transfers 32 bytes of data. |
SOCKET_2_WB_DATA |
0x10b |
Counts the total number of SCF Write-back data beats transferred from Local CPU to CNVLINK socket 2 memory (excluding Write unique/non-coherent Writes). Each wb_data beat transfers 32 bytes of data. |
SOCKET_3_WB_DATA |
0x10c |
Counts the total number of SCF Write-back data beats transferred from Local CPU to CNVLINK socket 3 memory (excluding Write unique/non-coherent Writes). Each wb_data beat transfers 32 bytes of data. |
SOCKET_0_WR_DATA |
0x17c |
Counts the total number of bytes transferred, based on size field, for SCF Write-unique and non-coherent Writes from Local CPU to CNVLINK socket 0 memory or NVLINK-C2C socket 0 memory. |
SOCKET_1_WR_DATA |
0x17d |
Counts the total number of bytes transferred, based on size field, for SCF Write-unique and non-coherent Writes from Local CPU to CNVLINK socket 1 memory or NVLINK-C2C socket 1 memory. |
SOCKET_2_WR_DATA |
0x17e |
Counts the total number of bytes transferred, based on size field, for SCF Write-unique and non-coherent Writes from Local CPU to CNVLINK socket 2 memory. |
SOCKET_3_WR_DATA |
0x17f |
Counts the total number of bytes transferred, based on size field, for SCF Write-unique and non-coherent Writes from Local CPU to CNVLINK socket 3 memory. |
SOCKET_0_RD_OUTSTANDING |
0x115 |
Counts the total number of outstanding SCF Read accesses from Local CPU to CNVLINK socket 0 memory or NVLINK-C2C socket 0 memory. Increments by total outstanding count each cycle. |
SOCKET_1_RD_OUTSTANDING |
0x116 |
Counts the total number of outstanding SCF Read accesses from Local CPU to CNVLINK socket 1 memory or NVLINK-C2C socket 1 memory. Increments by total outstanding count each cycle. |
SOCKET_2_RD_OUTSTANDING |
0x117 |
Counts the total number of outstanding SCF Read accesses from Local CPU to CNVLINK socket 2 memory. Increments by total outstanding count each cycle. |
SOCKET_3_RD_OUTSTANDING |
0x118 |
Counts the total number of outstanding SCF Read accesses from Local CPU to CNVLINK socket 3 memory. Increments by total outstanding count each cycle. |
SOCKET_0_RD_ACCESS |
0x12d |
Counts the number of SCF Read accesses from Local CPU to CNVLINK Socket 0 memory or NVLINK-C2C socket 0 memory. Increments by total new Read accesses each cycle. |
SOCKET_1_RD_ACCESS |
0x12e |
Counts the number of SCF Read accesses from Local CPU to CNVLINK Socket 1 memory or NVLINK-C2C socket 1 memory. Increments by total new Read accesses each cycle. |
SOCKET_2_RD_ACCESS |
0x12f |
Counts the number of SCF Read accesses from Local CPU to CNVLINK Socket 2 memory. Increments by total new Read accesses each cycle. |
SOCKET_3_RD_ACCESS |
0x130 |
Counts the number of SCF Read accesses from Local CPU to CNVLINK Socket 3 memory. Increments by total new Read accesses each cycle. |
SOCKET_0_WB_ACCESS |
0x135 |
Count all Write-back (clean and dirty) accesses from Local CPU to CNVLINK socket 0 memory or NVLINK-C2C socket 0 memory. |
SOCKET_1_WB_ACCESS |
0x136 |
Count all Write-back (clean and dirty) accesses from Local CPU to CNVLINK socket 1 memory or NVLINK-C2C socket 1 memory. |
SOCKET_2_WB_ACCESS |
0x137 |
Count all Write-back (clean and dirty) accesses from Local CPU to CNVLINK socket 2 memory. |
SOCKET_3_WB_ACCESS |
0x138 |
Count all Write-back (clean and dirty) accesses from Local CPU to CNVLINK socket 3 memory. |
SOCKET_0_WR_ACCESS |
0x139 |
Count the Write-unique and non-coherent Write accesses from Local CPU to CNVLINK socket 0 memory or NVLINK-C2C socket 0 memory. |
SOCKET_1_WR_ACCESS |
0x13a |
Count the Write-unique and non-coherent Write accesses from Local CPU to CNVLINK socket 1 memory or NVLINK-C2C socket 1 memory. |
SOCKET_2_WR_ACCESS |
0x13b |
Count the Write-unique and non-coherent Write accesses from Local CPU to CNVLINK socket 2 memory. |
SOCKET_3_WR_ACCESS |
0x13c |
Count the Write-unique and non-coherent Write accesses from Local CPU to CNVLINK socket 3 memory. |
REMOTE_SOCKET_WR_TOTAL_BYTES |
0x1a1 |
Counts the total number of bytes
transferred, to Remote sockets’
memory by Write-backs,
Write-unique, non-coherent Writes,
and all atomics. For the
non-coherent Writes, number of
bytes is based on size field.
|
REMOTE_SOCKET_RD_DATA |
0x1a2 |
Counts the total number of Read
data beats transferred from all
CNVLINK Remote socket memory or
NVLINK-C2C Remote socket memory.
Each data beat transfers up to 32
bytes.
|
REMOTE_SOCKET_RD_OUTSTANDING |
0x1a3 |
Counts the total number of
outstanding Read accesses to all
CNVLINK Remote socket memory or
NVLINK-C2C Remote socket memory.
Increments by total outstanding
count each cycle.
|
REMOTE_SOCKET_RD_ACCESS |
0x1a4 |
Counts the number of Read accesses
to all CNVLINK Remote socket memory
or NVLINK-C2C Remote socket memory.
Increments by total new Read
accesses each cycle.
|
SCF Maximum Transport Request Utilization#
Target |
Max Read Requests per Cycle |
Max Write Requests per Cycle |
|---|---|---|
CMEM |
8 (RD_ACCESS) |
8 (WR_ACCESS or WB_ACCESS) |
GMEM |
4 (RD_ACCESS) |
4 (WR_ACCESS or WB_ACCESS) |
REMOTE |
2 (RD_ACCESS) |
2 (WR_ACCESS or WB_ACCESS) |
SCF PMU Metrics#
This section provides additional formulas for useful performance metrics based on events provided by the Scalable Coherency Fabric (SCF) PMU.
Duration: Duration of the measurement in nanoseconds.
Event:
DURATION_TIME
Cycles: SCF cycle count
Event:
CYCLES
SCF Frequency: Frequency of SCF cycles in GHz
Metric formula:
CYCLES/DURATION_TIME
Local CPU memory write bandwidth: Write bandwidth to local CPU memory, in GBps.
Source:
Grace CPU Superchip: local and remote CPU
Single socket Grace Hopper/Blackwell Superchip: local CPU
Destination: local CPU memory
Metric formula:
CMEM_WR_TOTAL_BYTES/DURATION_TIME
Local CPU memory read bandwidth: Read bandwidth from local CPU memory, in GBps.
Source:
Grace CPU Superchip: local and remote CPU
Single socket Grace Hopper/Blackwell Superchip: local CPU
Destination: local CPU memory
Metric formula:
CMEM_RD_DATA*32/DURATION_TIME
Local GPU memory write bandwidth: Write bandwidth to local GPU memory, in GBps.
Source: local CPU
Destination:
Grace CPU Superchip: N/A
Single socket Grace Hopper/Blackwell Superchip: local GPU memory
Metric formula:
GMEM_WR_TOTAL_BYTES/DURATION_TIME
Local GPU memory read bandwidth: Read bandwidth from local GPU memory, in GBps.
Source: local CPU
Destination:
Grace CPU Superchip: N/A
Single socket Grace Hopper/Blackwell Superchip: local GPU memory
Metric formula:
GMEM_RD_DATA*32/DURATION_TIME
Remote memory write bandwidth: Write bandwidth to remote socket memory, in GBps.
Source: local CPU
Destination:
Grace CPU Superchip: remote CPU memory
Single socket Grace Hopper/Blackwell Superchip: N/A
Metric formula:
REMOTE_SOCKET_WR_TOTAL_BYTES/DURATION_TIME
Remote memory read bandwidth: Read bandwidth from remote socket memory, in GBps.
Source: local CPU
Destination:
Grace CPU Superchip: remote CPU memory
Single socket Grace Hopper/Blackwell Superchip: N/A
Metric formula:
REMOTE_SOCKET_RD_DATA*32/DURATION_TIME
Local CPU memory write utilization percentage: Percent usage of writes to local CPU memory.
Source:
Grace CPU Superchip: local and remote CPU
Single socket Grace Hopper/Blackwell Superchip: local CPU
Destination: local CPU memory
Metric formula:
((CMEM_WB_ACCESS + CMEM_WR_ACCESS)/(8*CYCLES)) * 100.0
Local GPU memory write utilization percentage: Percent usage of writes to local GPU memory.
Source: local CPU
Destination:
Grace CPU Superchip: N/A
Single socket Grace Hopper/Blackwell Superchip: local GPU memory
Metric formula:
((GMEM_WB_ACCESS + GMEM_WR_ACCESS)/(4*CYCLES)) * 100.0
Remote memory write utilization percentage: Percent usage of writes to the remote socket memory.
Source: local CPU
Destination:
Grace CPU Superchip: remote CPU memory
Single socket Grace Hopper/Blackwell Superchip: N/A
Metric formula:
Socket 0 access to socket 1 memory (measured in socket 0) :
((SOCKET_1_WB_ACCESS + SOCKET_1_WR_ACCESS)/(2*CYCLES)) * 100.0Socket 1 access to socket 0 memory (measured in socket 1) :
((SOCKET_0_WB_ACCESS + SOCKET_0_WR_ACCESS)/(2*CYCLES)) * 100.0
Local CPU memory read utilization percentage: Percent usage of reads from local CPU memory.
Source:
Grace CPU Superchip: local and remote CPU
Single socket Grace Hopper/Blackwell Superchip: local CPU
Destination: local CPU memory
Metric formula:
((CMEM_RD_ACCESS)/(8*CYCLES)) * 100.0
Local GPU memory read utilization percentage: Percent usage of reads from local GPU memory.
Source: local CPU
Destination:
Grace CPU Superchip: N/A
Single socket Grace Hopper/Blackwell Superchip: local GPU memory
Metric formula:
((GMEM_RD_ACCESS)/(4*CYCLES)) * 100.0
Remote memory read utilization percentage: Percent usage of reads from remote socket memory.
Source: local CPU
Destination:
Grace CPU Superchip: remote CPU memory
Single socket Grace Hopper/Blackwell Superchip: N/A
Metric formula:
Socket 0 access to socket 1 memory (measured in socket 0) :
((SOCKET_1_RD_ACCESS)/(2*CYCLES)) * 100.0Socket 1 access to socket 0 memory (measured in socket 1) :
((SOCKET_0_RD_ACCESS)/(2 * CYCLES)) * 100.0
Local CPU memory read latency: Average latency of reads from local CPU memory, in nanoseconds.
Source:
Grace CPU Superchip: local and remote CPU
Single socket Grace Hopper/Blackwell Superchip: local CPU
Destination: local CPU memory
Metric formula:
(CMEM_RD_OUTSTANDING/CMEM_RD_ACCESS)/(CYCLES/DURATION)
Local GPU memory read latency: Average latency of reads from local GPU memory, in nanoseconds.
Source: local CPU
Destination:
Grace CPU Superchip: N/A
Single socket Grace Hopper/Blackwell Superchip: local GPU memory
Metric formula:
(GMEM_RD_OUTSTANDING/GMEM_RD_ACCESS)/(CYCLES/DURATION)
Remote memory read latency: Average latency of reads from remote memory in nanoseconds.
Source: local CPU
Destination:
Grace CPU Superchip: remote CPU memory
Single socket Grace Hopper/Blackwell Superchip: N/A
Metric formula:
Socket 0 access to socket 1 memory (measured in socket 0):
(SOCKET_1_RD_OUTSTANDING/SOCKET_1_RD_ACCESS)/(CYCLES/DURATION)Socket 1 access to socket 0 memory (measured in socket 1):
(SOCKET_0_RD_OUTSTANDING/SOCKET_0_RD_ACCESS)/(CYCLES/DURATION)
PCIe PMU Accounting#
PCIe PMU Events#
The following tables provide the events exposed by the PMU driver and perf tool.
Event Name |
ID |
Description |
|---|---|---|
CYCLES |
0x100000000 |
PCIe PMU cycle counter. |
WR_REQ_LOC |
0x8 |
Counts the number of PCIe Write requests to Local CMEM or GMEM. |
RD_REQ_LOC |
0x6 |
Counts the number of PCIe Read requests to Local CMEM or GMEM. |
TOTAL_REQ_LOC |
0xa |
Counts the number of PCIe Read/Write requests to Local CMEM or GMEM. |
WR_BYTES_LOC |
0x2 |
Counts the number of PCIe Write bytes to Local CMEM or GMEM. |
RD_BYTES_LOC |
0x0 |
Counts the number of PCIe Read bytes to Local CMEM or GMEM. |
TOTAL_BYTES_LOC |
0x4 |
Counts the number of PCIe Read/Write bytes to Local CMEM or GMEM. |
RD_CUM_OUTS_LOC |
0xc |
Accumulates PCIe outstanding Read request cycles to Local CMEM or GMEM. |
WR_REQ_REM |
0x9 |
Counts the number of PCIe Write requests to Remote CMEM or GMEM. |
RD_REQ_REM |
0x7 |
Counts the number of PCIe Read requests to Remote CMEM or GMEM. |
TOTAL_REQ_REM |
0xb |
Counts the number of PCIe Read/Write requests to Remote CMEM or GMEM. |
WR_BYTES_REM |
0x3 |
Counts the number of PCIe Write bytes to Remote CMEM or GMEM. |
RD_BYTES_REM |
0x1 |
Counts the number of PCIe Read bytes to Remote CMEM or GMEM. |
TOTAL_BYTES_REM |
0x5 |
Counts the number of PCIe Read/Write bytes to Remote CMEM or GMEM. |
RD_CUM_OUTS_REM |
0xd |
Accumulates PCIe outstanding Read request cycles to Remote CMEM or GMEM |
PCIe Maximum Transport Request Utilization#
Source (Target: Local/Remote) |
Max Read Requests per Cycle |
Max Write Requests per Cycle |
|---|---|---|
Root Ports 0-9 |
1 per port.
|
1 32B-request per port.
|
PCIe PMU Metrics#
This section provides additional formulas for useful performance metrics based on events provided by the PCIe PMU.
Note
All PCIe metrics that follow are affected by the root port filter. If you do not define a root port filter, the metric results will be zero (refer to PCIe Traffic Management for more information).
PCIe RP Frequency: Frequency of PCIe RP memory client interface cycles in GHz.
Metric formula:
CYCLES/DURATION_TIME
PCIe RP read bandwidth: PCIe root port read bandwidth, in GBps.
Source: local PCIe root port
Destination: local and remote memory
Metric formula:
(RD_BYTES_LOC + RD_BYTES_REM)/DURATION_TIME
PCIe RP write bandwidth: PCIe root port write bandwidth, in GBps.
Source: local PCIe root port
Destination: local and remote memory
Metric formula:
(WR_BYTES_LOC + WR_BYTES_REM)/DURATION_TIME
PCIe RP bidirectional bandwidth: PCIe root port read and write bandwidth, in GBps.
Source: local PCIe root port
Destination: local and remote memory
Metric formula:
(RD_BYTES_LOC + RD_BYTES_REM + WR_BYTES_LOC + WR_BYTES_REM)/DURATION_TIME
PCIe RP read utilization percentage: Average percent utilization of PCIe root port for reads.
Source: local PCIe root port
Destination: local and remote memory
Metric formula:
((RD_REQ_LOC + RD_REQ_REM)/(10 * CYCLES) ) * 100.0
PCIe RP write utilization percentage: Average percent utilization of PCIe root port for writes.
Source: local PCIe root port
Destination: local and remote memory
Metric formula:
( (WR_REQ_LOC + WR_REQ_REM)/(10 * CYCLES) ) * 100.0
PCIE RP local memory read latency: Average latency of PCIe root port reads to local memory, in nanoseconds.
Note
This metric does not include the latency of the PCIe interconnect.
Source: local PCIe root port
Destination: local memory
Metric formula:
(RD_CUM_OUTS_LOC/RD_REQ_LOC)/(CYCLES/DURATION_TIME)
PCIE RP remote memory read latency: Average latency of PCIe root port reads to remote memory, in nanoseconds.
Note
This metric does not include the latency of the PCIe interconnect.
Source: local PCIe root port
Destination: remote memory
Metric formula:
(RD_CUM_OUTS_REM/RD_REQ_REM)/(CYCLES/DURATION_TIME)
NVLink C2C PMU Accounting#
Note
This PMU does not monitor CPU traffic. Users should use SCF PMU to capture remote CPU traffic.
The counts from this PMU do not include the interconnect latency.
The NVLink C2C PMU monitors traffic from NVLink Chip-2-Chip (C2C) interconnect to local memory. The traffic captured by this PMU is limited to the following traffic:
Requests from remote PCIe devices in the Grace CPU Superchip system.
Requests from a coherent GPU in the Grace Hopper/Blackwell Superchip system.
Two C2C PMUs, NVLINK-C2C0, and NVLINK-C2C1 are available and cover different types of traffic. Refer to PMU Accounting for Access Patterns on the Grace Superchip and PMU Accounting for Access Patterns on the Grace Hopper/Blackwell Superchip tables above for more information about the traffic patterns covered by each PMU. The NVLINK-C2C1 PMU is unused on the Grace Superchip.
NVLink C2C PMU Events#
The following tables provide the events exposed by the PMU driver and perf tool.
Event Name |
ID |
Description |
|---|---|---|
CYCLES |
0x100000000 |
NVLink-C2C0 PMU cycle counter. |
WR_REQ_LOC |
0x8 |
Counts the number of GPU ATS-translated Write requests in Grace Coherent GPU or Remote PCIe Relaxed Order Write requests in Grace CPU Superchip to Local CMEM or GMEM. |
RD_REQ_LOC |
0x6 |
Counts the number of GPU ATS-translated Read requests in Grace Coherent GPU or Remote PCIe Read requests in Super Grace to Local CMEM or GMEM. |
TOTAL_REQ_LOC |
0xa |
Counts the number of GPU ATS-translated Read/Write requests in Grace Coherent GPU or Remote PCIe Read/Relaxed Order Write requests in Grace CPU Superchip to Local CMEM or GMEM. |
WR_BYTES_LOC |
0x2 |
Counts the number of GPU ATS-translated Write bytes in Grace Coherent GPU or Remote PCIe Relaxed Order Write bytes in Grace CPU Superchip to Local CMEM or GMEM. |
RD_BYTES_LOC |
0x0 |
Counts the number of GPU ATS-translated Read bytes in Grace Coherent GPU or Remote PCIe Read bytes in Grace CPU Superchip to Local CMEM or GMEM. |
TOTAL_BYTES_LOC |
0x4 |
Counts the number of GPU ATS-translated Read/Write bytes in Grace Coherent GPU or Remote PCIe Read/Relaxed Order Write bytes in Grace CPU Superchip to Local CMEM or GMEM. |
RD_CUM_OUTS_LOC |
0xc |
Accumulates GPU ATS-translated outstanding Read request cycles in Grace Coherent GPU or Remote PCIe Read outstanding Read request cycles in Grace CPU Superchip cycles to Local CMEM or GMEM. |
WR_REQ_REM |
0x9 |
Counts the number of GPU ATS-translated Write requests in Grace Coherent GPU to Remote CMEM or GMEM. |
RD_REQ_REM |
0x7 |
Counts the number of GPU ATS-translated Read requests in Grace Coherent GPU to Remote CMEM or GMEM. |
TOTAL_REQ_REM |
0xb |
Counts the number of GPU ATS-translated Read/Write requests in Grace Coherent GPU to Remote CMEM or GMEM. |
WR_BYTES_REM |
0x3 |
Counts the number of GPU ATS-translated Write bytes in Grace Coherent GPU to Remote CMEM or GMEM. |
RD_BYTES_REM |
0x1 |
Counts the number of GPU ATS-translated Read bytes in Grace Coherent GPU to Remote CMEM or GMEM. |
TOTAL_BYTES_REM |
0x5 |
Counts the number of GPU ATS-translated Read/Write bytes in Grace Coherent GPU to Remote CMEM or GMEM. |
RD_CUM_OUTS_REM |
0xd |
Accumulates GPU ATS-translated outstanding Read request cycles in Grace Coherent GPU to Remote CMEM or GMEM. |
Event Name |
ID |
Description |
|---|---|---|
CYCLES |
0x100000000 |
NVLink-C2C1 PMU cycle counter. |
WR_REQ_LOC |
0x8 |
Counts the number of GPU Not ATS-translated Write requests in Grace Coherent GPU to Local CMEM or GMEM. |
RD_REQ_LOC |
0x6 |
Counts the number of GPU Not ATS-translated Read requests in Grace Coherent GPU to Local CMEM or GMEM. |
TOTAL_REQ_LOC |
0xa |
Counts the number of GPU Not ATS-translated Read/Write requests in Grace Coherent GPU to Local CMEM or GMEM. |
WR_BYTES_LOC |
0x2 |
Counts the number of GPU Not ATS-translated Write bytes in Grace Coherent GPU to Local CMEM or GMEM. |
RD_BYTES_LOC |
0x0 |
Counts the number of GPU Not ATS-translated Read bytes in Grace Coherent GPU to Local CMEM or GMEM. |
TOTAL_BYTES_LOC |
0x4 |
Counts the number of GPU Not ATS-translated Read/Write bytes in Grace Coherent GPU to Local CMEM or GMEM. |
RD_CUM_OUTS_LOC |
0xc |
Accumulates GPU Not ATS-translated outstanding Read request cycles in Grace Coherent GPU cycles to Local CMEM or GMEM. |
WR_REQ_REM |
0x9 |
Counts the number of GPU Not ATS-translated Write requests in Grace Coherent GPU to Remote CMEM or GMEM. |
RD_REQ_REM |
0x7 |
Counts the number of GPU Not ATS-translated Read requests in Grace Coherent GPU to Remote CMEM or GMEM. |
TOTAL_REQ_REM |
0xb |
Counts the number of GPU Not ATS-translated Read/Write requests in Grace Coherent GPU to Remote CMEM or GMEM. |
WR_BYTES_REM |
0x3 |
Counts the number of GPU Not ATS-translated Write bytes in Grace Coherent GPU to Remote CMEM or GMEM. |
RD_BYTES_REM |
0x1 |
Counts the number of GPU Not ATS-translated Read bytes in Grace Coherent GPU to Remote CMEM or GMEM. |
TOTAL_BYTES_REM |
0x5 |
Counts the number of GPU Not ATS-translated Read/Write bytes in Grace Coherent GPU to Remote CMEM or GMEM. |
RD_CUM_OUTS_REM |
0xd |
Accumulates GPU Not ATS-translated outstanding Read request cycles in Grace Coherent GPU to Remote CMEM or GMEM. |
NVLink C2C Maximum Transport Request Utilization#
Source (Target: Local/Remote) |
Max Read Requests per Cycle |
Max Write Requests per Cycle |
|---|---|---|
Grace Hopper/Blackwell Superchip
in one GPU mode: 10 C2C ports/GPU
|
1 per port.
|
1 32B-request per port.
|
NVLink C2C PMU Metrics#
This section provides additional formulas for useful performance metrics based on events provided by the NVLINK-C2C PMU.
NVLink C2C Client Interface Frequency: Frequency of NVLink C2C memory client interface cycles in GHz.
Metric formula:
CYCLES/DURATION_TIME
GPU or remote PCIe traffic read bandwidth: Bandwidth of read traffic, in GBps.
Source: GPU or PCIe of remote socket
Destination: local memory
Metric formula:
(RD_BYTES_LOC)/DURATION_TIME
GPU or remote PCIe traffic write bandwidth: Bandwidth of write traffic, in GBps.
Source: GPU or PCIe of remote socket
Destination: local memory
Metric formula:
(WR_BYTES_LOC)/DURATION_TIME
GPU or Remote PCIe traffic bidirectional bandwidth: Bandwidth of read and write traffic, in GBps.
Source: GPU or PCIe of remote socket
Destination: local memory
Metric formula:
(RD_BYTES_LOC + WR_BYTES_LOC )/DURATION_TIME
GPU or Remote PCIe traffic read utilization percentage: Average percent usage of the NVLink-C2C client interface for reads.
Source: GPU or PCIe of remote socket
Destination: local memory
Metric formula:
((RD_REQ_LOC)/(10 * CYCLES) ) * 100.0
GPU or Remote PCIe traffic write utilization percentage: Average usage of the NVLink-C2C client interface for writes.
Source: GPU or PCIe of remote socket
Destination: local memory
Metric formula:
((WR_REQ_LOC)/(10 * CYCLES) ) * 100.0
GPU or Remote PCIe to local memory read latency: Average latency of reads to local memory, in nanoseconds.
Note
This metric does not include the latency of the NVLink-C2C interconnect (refer to GPU Traffic Measurement for more information).
Source: GPU or PCIe of remote socket
Destination: local memory
Metric formula:
(RD_CUM_OUTS_LOC/RD_REQ_LOC)/(CYCLES/DURATION_TIME)
Profiling CPU Behavior with Nsight Systems#
The Nsight Systems tool (also referred to as nsys) profiles the system’s compute units including the CPUs and GPUs (refer to Nsight Systems for more information). The tool can trace more than 25 APIs including CUDA APIs, sample CPU instruction pointers/backtraces, sample the CPU and SoC event counts, and sample GPU hardware event counts to provide a system-wide view of a workload’s behavior.
nsys can sample CPU and SoC events and graph their rates on the nsys UI timeline. It can generate the metrics described in Grace CPU Performance Metrics to NVLink C2C Accounting and also graph them on the nsys UI timeline. If CPU IP/backtrace data is gathered concurrently, users can determine when CPU and SoC events are extremely active (or inactive) and correlate that information with the IP/backtrace data to determine which workload aspect was actively running at that time.
The graphic below shows a sample nsys profile timeline. In this case, two Grace C2C0 socket metrics were collected in addition to the IPC (Instructions per Cycle) core metric on each CPU. The C2C0 metrics (C2C0 read and write utilization percentage) show GPU access to the CPU’s memory. The IPC metric shows that thread 2965407, which is running on CPU 146, is memory bound (the IPC value is ~0.05) right before the C2C0 activity. The orange-yellow tick marks under thread 2965407 represent individual instruction pointer/backtrace samples. Users can hover over these samples to get a backtrace that represents the code that the thread was executing at that time. This data can be used to understand what the workload is doing at that time.
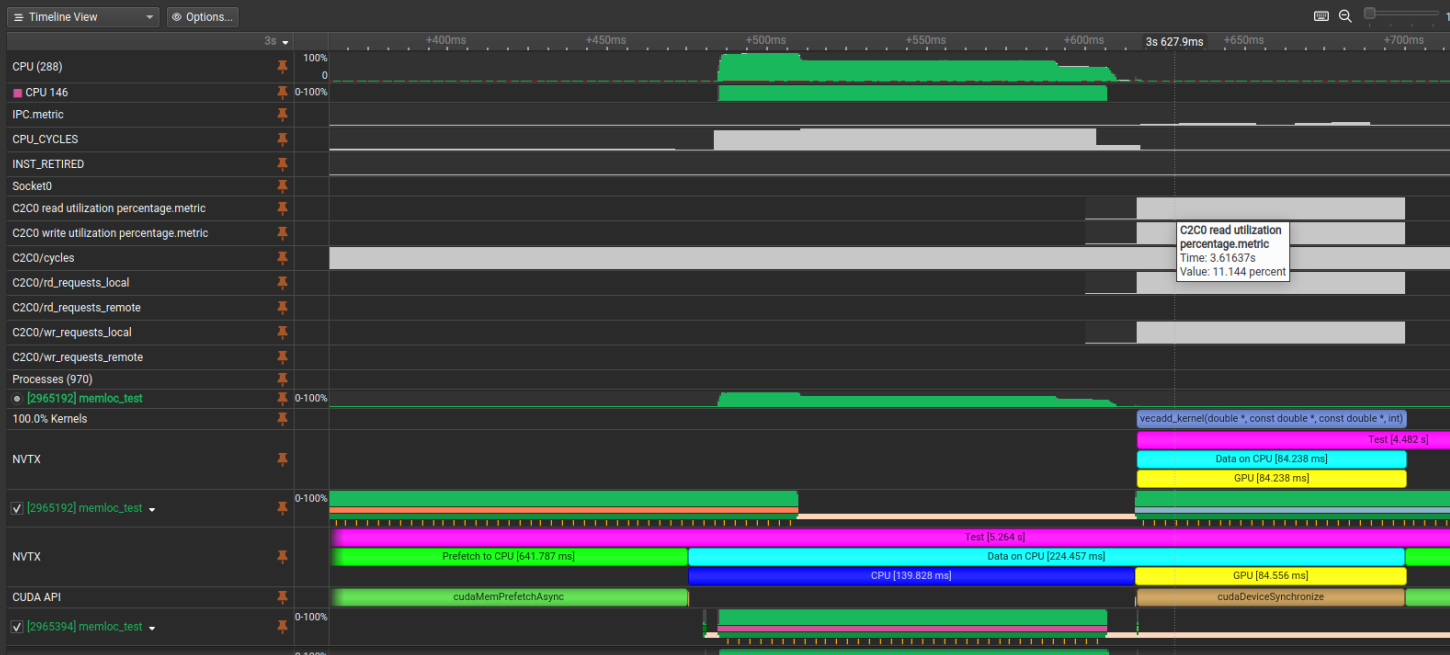
An Example nsys Timeline#
Use the --cpu-core-metrics, --cpu-socket-metrics, and --sample nsys CLI switches to collect the above data. Also, see the --cpu-core-events, --cpu-socket-events, and --cpuctxsw nsys
CLI switches that are used to profile CPU and/or SoC performance issues. For more information, run the nsys profile --help command.
nsys also provides specific support for multi-node performance analysis.
When you run nsys in a multi-node system, it typically generates one result file per rank on the system. While you can load multiple result files into the nsys UI for visualization, the Nsight Systems Multi-Report Analysis system allows you to run statistical analysis across all of the result files (refer to Nsight Systems Multi-Report Analysis for more information).
The nsys Multi-Report Analysis system includes multiple python scripts, called recipes, that provide different analysis. Example recipes include:
cuda_api_sum: CUDA API Summarycuda_gpu_kern_hist: CUDA GPU Kernel Duration Histogramgpu_metric_util_map: GPU Metric Utilization Heatmapmpi_gpu_time_util_map: MPI and GPU Time Utilization Heatmapnetwork_sum: Network Traffic Summarynvtx_sum: NVTX Range Summaryucx_gpu_time_util_map: UCX and GPU Time Utilization Heatmap
Multiple nsys reports can be viewed on a common timeline within the nsys UI. Opening multiple reports together can help identify multi-node issues (refer to Viewing Multiple Nsight Systems Reports for more information on how to open multiple reports on a common timeline). Note that opening multiple reports together can require a large amount of memory. To mitigate this issue, collect the minimum amount of data required to capture the workload’s behavior of interest.
nsys provides specific support for handling application launchers used in multi-node environments such as MPI, OpenSHMEM, UCX, NCCL, NVSHMEM, and SLURM. Refer to Viewing Multiple Nsight Systems Reports for more information.
nsys includes support for profiling many different network communication protocols including MPI, OpenSHMEM, and UCX. It can also profile Network Interface Cards(NICs) and Infiniband Network Switches (refer to Viewing Multiple Nsight Systems Reports for more information).
Additonal Tools#
HPC Benchmarks#
NVIDIA provides the NVIDIA HPC Benchmarks collection via NGC that can be used to confirm your multi-node setup is working as expected. Checkout the HPL, HPL-MxP, and HPCG benchmarks (refer to NVIDIA HPC Benchmarks for more information).
PyTorch Support#
The open source NVIDIA nvidia-resiliency-ext python package can help when running PyTorch-based workloads in a multi-node environment. The nvidia-resiliency-ext tools provides fault tolerance, straggler detection, and checkpointing support (refer to NVIDIA nvidia-resiliency-ext for more information). The checkpoint functionality minimizes wasted time by allowing workloads to be restarted between failures.