Power and Thermals#
This chapter provides information about CPU power and thermal management settings.
C-States#
C-States refer to idle CPU power states, and Grace includes the following C-states:
C0: active/run state.
This is the state of the CPU core while active.
C1: clock gated state.
This state is entered when WFI/WFE instructions are executed by the CPU core. The latency to enter/exit this state is negligible.
The LPI table in Advanced Configuration and Power Interface (ACPI) provides information about the C-states to any CPU idle governors such as the cpuidle framework in Linux.
For systems that have the cpuidle governors enabled, to read the number of times the C1 state is entered through the idle framework, run the following command:
$ cat /sys/devices/system/cpu/cpu<n>/cpuidle/state0/usage
The State0 entry reflects the WFI or the C1-clock gated state, run the following command to read the desc node in the cpuidle/state0 directory and confirm:
$ cat /sys/devices/system/cpu/cpu<n>/cpuidle/state0/desc
For systems that do not use cpuidle governors, the CPU cores can still enter the clock gated state when WFI/WFE instructions are executed, but no stats will be available.
P-States#
P-States refers to performance states, and Grace does not offer explicit P-states. Instead, Grace exposes the maximum and minimum performance capabilities through ACPI’s CPPC mechanism. CPPC offers users and operating systems the ability to request any performance in the allowed bounds rather than discrete P-State. Refer to CPU Performance and Frequency Management for more information.
CPU Performance and Frequency Management#
Each CPU core can operate at its own independent frequency, and the frequency is determined by the frequency policy governors that were used. Linux provides the following frequency governors:
Performance governor: Geared towards getting the maximum performance and sets the performance/frequency request of the CPU cores to the maximum possible value.
The request is not based on activity and kept fixed at highest value.
Userspace governor: Bypasses a kernel governor and provides control to the userspace application for frequency control.
To set the frequency of the cores, a hypervisor or a higher level software entity, can take input from an application. The kernel does not modify the frequency based on other information but will honor frequency caps based on thermals.
Schedutil governor: Incorporates information from the scheduler, which are the threads that are currently scheduled on cores, the activity on the core, load estimation, and so on, to determine the optimal frequency for the core.
The goal of this governor is to provide best performance while saving power by matching the frequency based on scheduler visible workloads.
Ondemand governor: Adjusts the frequency based on the trailing load of the CPU core.
This governor predicts the future load and ramps frequency accordingly.
Refer to https://www.kernel.org/doc/Documentation/cpu-freq/governors.txt for more information.
The default frequency governor in Grace is the performance governor, which sets the frequency to the maximum value for that core. The maximum frequency usually corresponds to the maximum possible performance and is higher than the frequency at which nominal (sustained) performance can be achieved. When running at the maximum frequency violates thermals, the thermal management solution throttles frequency. Refer to Power and Thermal Management for more information.
Managing CPU frequency on a Linux server can be achieved by using the cpupower commands or directly by using the sysfs interface. The next section provides a concise guide that combines the methods for setting a fixed frequency and a scaling max frequency.
Setting a Fixed Frequency#
This section provides information about setting a fixed frequency.
The ``cpupower`` command:
This command allows you do complete the following tasks:
Switch to userspace governor to manually set the frequency:
$ sudo cpupower frequency-set -g userspace
Set the desired frequency (for exmple, 3.2 GHz = 3200000 kHz):
$ sudo cpupower frequency-set -f 3200000
The ``sysfs`` method:
This command allows you do complete the following tasks:
Switch to userspace governor (if supported):
$ echo userspace | sudo tee
/sys/devices/system/cpu/cpu*/cpufreq/scaling_governor
Set the desired frequency directly (replace [FREQUENCY] with your value in kHz):
$ echo [FREQUENCY] | sudo tee
/sys/devices/system/cpu/cpu*/cpufreq/scaling_setspeed
Setting a Scaling Max Frequency#
This section provides information about setting a scaling max frequency.
The ``cpupower`` command:
Switch to performance governor to limit the max scaling frequency:
$ sudo cpupower frequency-set -g performance
Set the scaling max frequency (e.g., 3.2 GHz = 3200000 kHz):
$ sudo cpupower frequency-set -f 3200000
The ``sysfs`` method:
Switch to performance governor (if supported):
$ echo performance | sudo tee
/sys/devices/system/cpu/cpu*/cpufreq/scaling_governor
Limit the maximum scaling frequency (by replacing [MAX_FREQUENCY] with your value in kHz):
$ echo [MAX_FREQUENCY] | sudo tee
/sys/devices/system/cpu/cpu*/cpufreq/scaling_max_freq
Here is the general CPU frequency command to read the currently requested and measured settings:
Software frequency request (kHz) for the CPU core <n>.
$ cat /sys/devices/system/cpu/cpu<n>/cpufreq/scaling_cur_freq
Note
This makes use of the Activity Monitor Unit (AMU), which is provided by ARM, where the source and reference clocks are measured, and where the ratio is used to compute the actual frequency. With the default measuring window used in Linux, there might be up to a 3% error in the frequency read. To increase accuracy, the measurement window should be increased in upstream Linux code.
Warning
On the Grace CPU, the value reported by /sys/devices/system/cpu/cpu*/cpufreq/cpuinfo_cur_freq is imprecise. To address this, a new sysfs attribute, cpuinfo_avg_freq, was introduced by commit fbb4a475 cpufreq: Introduce an optional cpuinfo_avg_freq sysfs entry. When running kernels that carry this commit, we recommend using cpuinfo_avg_freq instead of cpuinfo_cur_freq when checking the CPU frequency.
However, cpuinfo_avg_freq is unavailable while the CPU core is idle. Therefore, to verify that the CPU is operating at your target frequency, generate load on the CPU cores. This check does not alter your frequency settings and only confirms that the CPU is running at the configured rate.
GPU and Module Power Management#
GPU provides power capping at the following scopes:
Limit power consumption of the Grace + Hopper/Blackwell superchip (Module) and keep it within the provided power limit.
Limit power consumption of the GPU and keep it within the provided power limit.
GPU and Module Power Management#
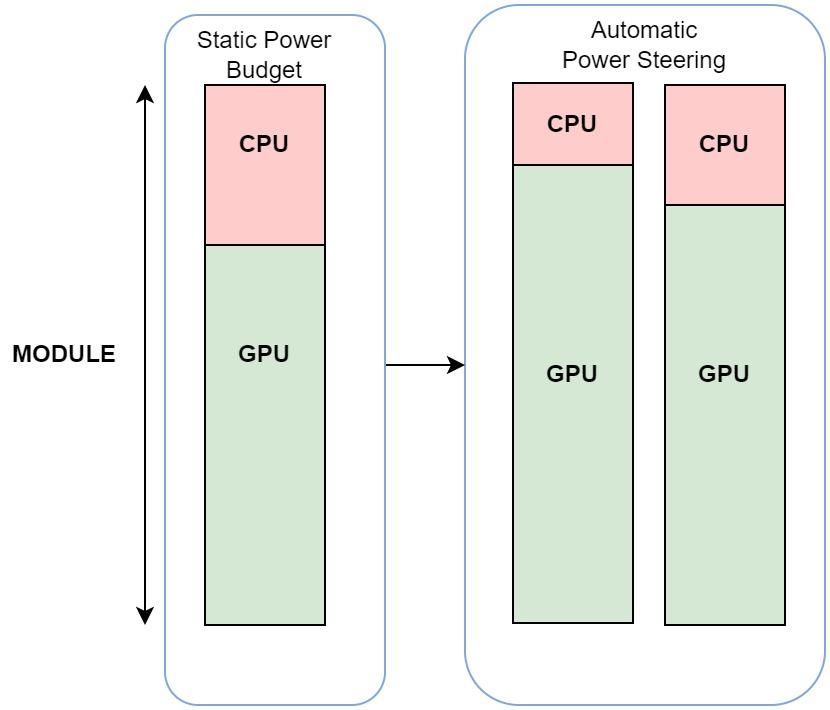
This is done by Automatic power steering in the GPU because the GPU monitors power telemetry for Grace, Module, and the GPU. Power capping at the Module scope monitors the consumed Grace power, which removes the power from the Module power limit, and gives the rest to the GPU.
The GPU can work in the new power limit or can stick to the limit that was explicitly set for the GPU, where the lower of the two limits is respected. This leads to efficiently balancing power between Grace and GPU to improve the overall app performance by opportunistically boosting the GPU power budget. The GPU achieves power capping by using DVFS.
System |
Knobs |
Description |
|---|---|---|
GPU |
nvidia-smi -q -d POWER |
Dumps Module and GPU power temetry |
GPU |
nvidia-smi -pl <limit in Watt> -sc 0 |
Sets limit for the GPU. This will apply to the GPU if the limit is lower than the limit evaluated through “Automatic Power Steering” |
GPU |
nvidia-smi -pl <limit in Watt> -sc 1 |
Sets limit for the Module |
Here is the output from the NVSMI log:
nvidia@localhost:~$ nvidia-smi -q -d POWER
==============NVSMI LOG==============
Timestamp                : Fri Oct 6 22:46:55 2023
Driver Version           : 535.122
CUDA Version             : 12.2

Attached GPUs            : 1
GPU 00000009:01:00.0
    GPU Power Readings
        Power Draw               : 77.61 W
        Current Power Limit      : 900.00 W
        Requested Power Limit    : 900.00
        Default Power Limit      : 900.00 W
        Min Power Limit          : 100.00 W
        Max Power Limit          : 900.00 W
    Power Samples
        Duration                 : 2.36 sec
        Number of Samples        : 119
        Max                      : 78.26 W
        Min                      : 76.65 W
        Avg                      : 77.48 W
    Module Power Readings
        Power Draw               : 147.49 W
        Current Power Limit      : 1000.00 W
        Requested Power Limit    : 1000.00 W
        Default Power Limit      : 1000.00 W
        Min Power Limit          : 200.00 W
        Max Power Limit          : 1000.00 W
Power and Thermal Management#
Grace provides the following types of thermal management types:
Limit power consumption and keep it within the provided power limit.
Thermal sensor (Tj)-based management.
Power Telemetry#
This section provides information about power telemetries for Grace, and guidance for comparing Grace power telemetry to Intel and AMD power telemetry. This can be useful when making comparisons in power efficiency to other CPU architectures.
Grace Power Telemetry#
Grace exposes power telemetry through hwmon, which uses the ACPI power meter interface. You can read the power telemetry information in one of the following ways:
To display the name of the power meter.
This gives information about which power is being reported on hwmon node X.
cat /sys/class/hwmon/hwmonX/device/power1_oem_info
To display power consumption in microwatts (µW), which is average power over past 50 ms interval by default, on hwmon node X:
cat /sys/class/hwmon/hwmonX/device/power1_average
To display the power stats interval in milliseconds, on hwmon node X:
cat /sys/class/hwmon/hwmonX/device/power1_average_interval
To change the power stats interval in milliseconds, on hwmon node X (default is 50):
echo <value> | sudo tee
/sys/class/hwmon/hwmonX/device/power1_average_interval
The following table provides information about the available power telemetries.
Note
To see hwmon sysfs nodes, you need CONFIG_SENSORS_ACPI_POWER=m in kconfig and acpi_power_meter.force_cap_on=y on the kernel command line.
Refer to the NVIDIA Grace Platform Support Software Patches and Configurations guide for more information about the patches.
The following table provides information about the available power telemetries.
System |
Telemetry |
Details |
|---|---|---|
Grace Superchip |
Grace Power Socket 0 |
Total power of the socket 0, including DRAM power and regulator loss. |
CPU Power Socket 0 |
CPU rail power for socket 0. |
|
SysIO Power Socket 0 |
SOC rail power. |
|
Grace Power Socket 1 |
Total power of the socket 1, including DRAM power and regulator loss. |
|
CPU Power Socket 1 |
CPU rail power for socket 1. |
|
SysIO Power Socket 1 |
SOC rail power. |
|
Grace Hopper/ Blackwell Superchip |
Module Power Socket 0 reported as part of nvidia-smi rel > 570 |
Total power of the CG1 module, including DRAM power and regulator loss. This also includes GPU and GPU HBM Power. |
Grace Power Socket 0 |
Power of Grace socket. |
|
CPU Power Socket 0 |
CPU rail power. |
|
SysIO Power Socket 0 |
SOC rail power. |
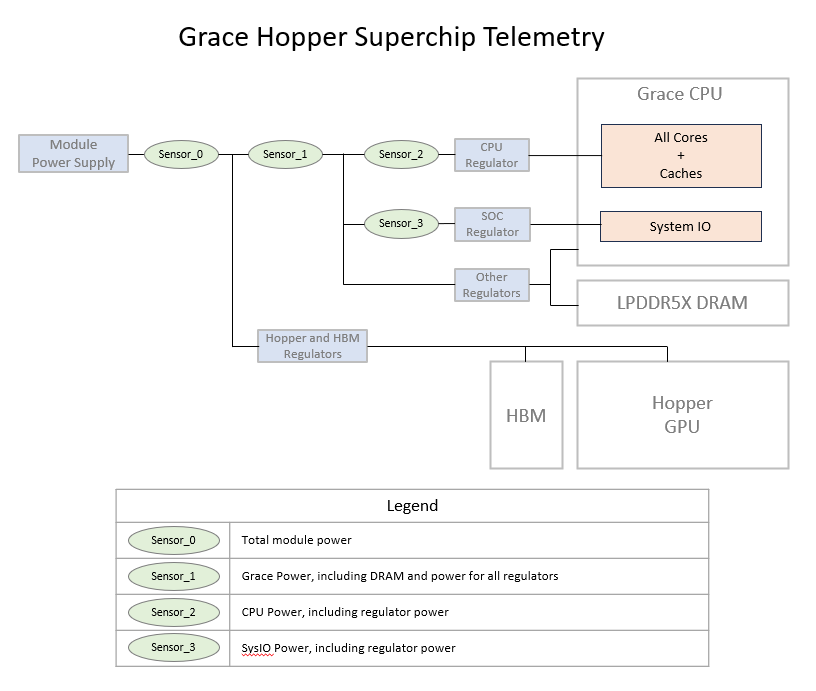
Grace Power Telemetry Sensors#
Note
Sensor1 on GB200 (Bianca) now includes additional regulator power compared to grace hopper.
Additional rail power was intially reported only in Total Module Power whereas now included as part of Grace power reporting.
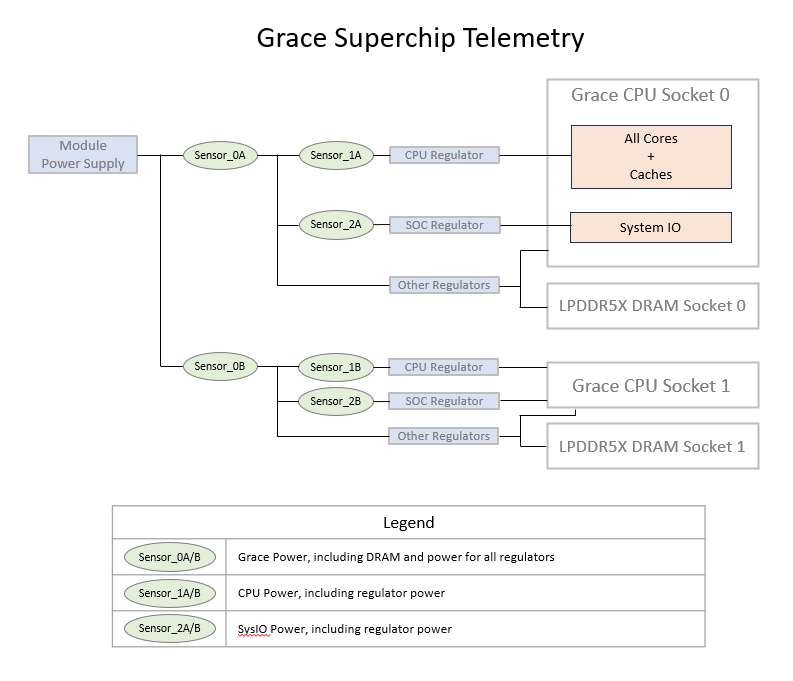
Grace SuperChip Telemetry Sensors#
Note
In Cordelia platform Sensor_0A and Sensor_0B reports asymmetrical values compared to Bianca platform due to inclusion of commona rail as part of sensor_0A reported power
As noted in the table above, the total power reported for the socket includes CPU power, DRAM power, and regulator loss. Similarly, power is reported for the CPU cores and includes regulator losses. Regulator loss accounts for 15% of the TDP power limit. DRAM power can be estimated based on total traffic using the following formula in the table below.
DRAM Power (mW, without regulator losses): -a*DRAM_BW_GBps^2 + b*DRAM_BW_GBps + c
Config |
a |
b |
c |
|---|---|---|---|
128 GB, 4266 MHz |
00.0000136 |
28.9 |
2334 |
128 GB, 3200 MHz |
00.0000175 |
28.3 |
2043 |
512 GB, 3200 MHz |
00.0000603 |
56.2 |
3396 |
The DRAM bandwidth can be determined using the PMU metrics described in Grace CPU Performance Metrics.
Comparing Grace and Intel® Power Telemetry#
Intel® CPUs expose power telemetry through the Intel® Performance Counter Monitor (Intel® PCM) APIs. When the power consumption of Grace CPUs is compared to Intel® CPUs, these APIs can be used to gather comparable metrics. The PCM APIs are available on GitHub at intel/pcm.
Refer to the following documentation for more information:
PCM’s pcm-power utility can be run to collect performance metrics for a number of intervals and the duration per interval. For example, to capture one minute of samples at one-second intervals, run the following command:
sudo pcm-power 1.00 -i=60 -silent
For each interval, pcm-power prints the power consumption for each socket (S0, S1) including CPU power consumption and DRAM power consumption:
$ sudo pcm-power -silent 1.0 -i=60 | grep '^S.; Consumed
S0; Consumed energy units: 3563683; Consumed Joules: 217.51; Watts: 217.51
S0; Consumed DRAM energy units: 533250; Consumed DRAM Joules: 32.55; DRAM Watts: 32.55
S1; Consumed energy units: 3350361; Consumed Joules: 204.49; Watts:204.49
S1; Consumed DRAM energy units: 597938; Consumed DRAM Joules: 36.50;DRAM Watts: 36.50
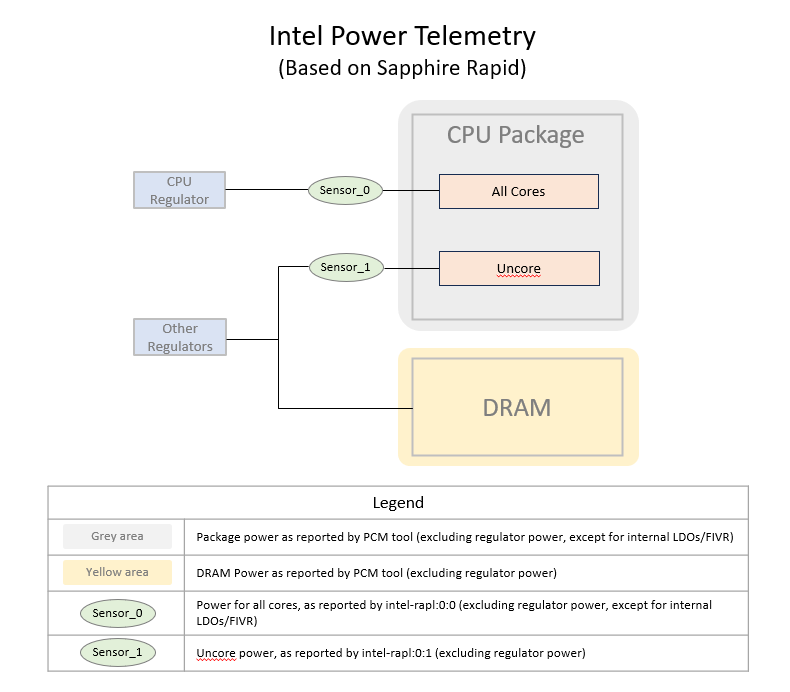
Intel Power Telemetry Sensors#
As illustrated in the graphic above, the power consumption per socket does not include regulator losses, and so is not directly comparable to the CPU Power Socket 0 and CPU Power Socket 1 telemetry as described in the Available Power Telemetries table above. To compare Intel CPU power consumption to Grace CPU power, remove the Grace regulator losses.
Refer to Power Capping Framework for more information about Power consumption metrics that are available through the Linux powercap kernel interface in sysfs.
To measure power consumption for cores only, excluding regulator losses or DRAM power consumption, the metrics per CPU are available at:
For CPU 0:
cat /sys/class/powercap/intel-rapl/intel-rapl:0/intel-rapl:0:0/energy_uj
For CPU 1:
cat /sys/class/powercap/intel-rapl/intel-rapl:1/intel-rapl:1:0/energy_uj
These counters provide a running total of the microjoules consumed for each CPU.
Measurements from this interface are comparable to the CPU Power Socket 0 and CPU Power Socket 1 telemetry as described in the Available Power Telemetries table.
Comparing Grace and AMD Power Telemetry#
AMD’s AMD μProf package includes utilities that provide power telemetry. When you compare the power consumption of Grace CPUs to AMD CPUs, these APIs can be used to gather comparable metrics.
To download and install the AMD μProf, go to https://www.amd.com/en/developer/uprof.html.
Refer to the AMD μProf User Guide for platform-specific information about the available metrics.
To capture measurements of power consumption per socket for 60 seconds with measurements at one-second intervals, run the following command:
AMDuProfCLI-bin timechart --event socket=0-1,power --interval 1000 --duration 60 -o powerOutput
The resulting output file, in a CSV format, will be reported in the command output, for example:
Live Profile Output file : /home/nvex/powerOutput/AMDuProf-SWP-Timechart_Aug-05-2023_00-03-29/timechart.csv
It contains CSV-formatted power measurements per interval, with one column per socket, for example:
RecordId,Timestamp,socket0-package-power,socket1-package-power
1,0:3:30:462, 95.56, 91.05
2,0:3:31:462, 95.09, 90.63
3,0:3:32:462, 95.17, 90.23
4,0:3:33:462, 95.70, 90.70
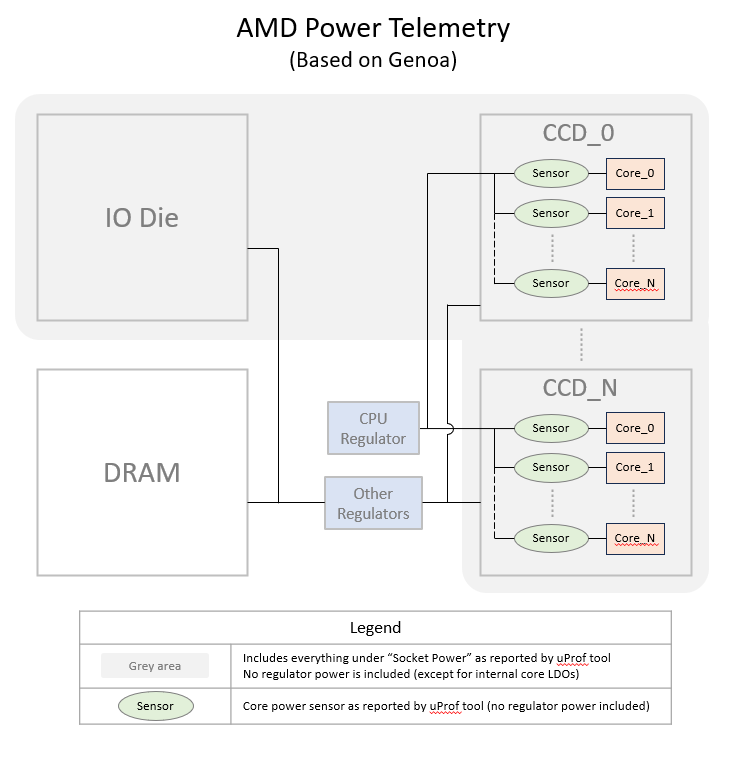
AMD Power Telemetry Sensors#
Guidance for measuring power usage for the DRAM with AMD processors depends on platform implementation details. Contact your platform vendor for guidance about measuring power usage for comparison to the measurements LPDDR5x power readings with Grace.
AMD μProf also allows per-core power utilization measurements to be captured. For example, on a 64 core AMD processor:
AMDuProfCLI-bin timechart --event core=0-63,power --interval 1000
--duration 60 -o powerOutput
The resulting file contains CSV-formatted power measurements per interval, with one column per core. These cores are summed to get the total power output across all cores to determine total power consumption by the CPU. As illustrated in the graphic above, this measurement does not include regulator losses. When regulator losses are removed from the Grace CPU measurement the total is comparable to the Grace CPU rail power CPU Power Socket 0 or CPU Power Socket 1 telemetries as described in the Available Power Telemetries table above.
Power Capping#
Power capping limits average power consumption and is usually set based on the thermal power dissipation capability of the system. Grace throttles power when average power exceeds this limit. Users can reduce the power limit lower than the default value that was set in the BIOS. This setting is exposed through the Hwmon nodes and can be applied to total socket power. Power capping can be applied only at the socket level and not at the vdd_cpu or vdd_soc power levels.
To set power limit, run the following command:
echo <power value in micro Watts> > /sys/class/hwmon/hwmonX/device/power1_cap
For a Grace Hopper/Blackwell Superchip system, the capping power of the Grace CPU allows the Hopper/Blackwell GPU to draw more power, which can improve performance of GPU-heavy applications. Power capping of the GPU can be applied according to GPU and Module Power Management.
CPU Temperature Management#
ACPI thermal management (Tj) uses telemetry from temperature sensors to ensure that no local hotspots exceed the operating temperature. Power capping ensures that the average power of the socket/module is at or below the thermal capacity of the system. However, this does not account for asymmetric power distribution based on workload distribution across the cores. ACPI tables provide passive and critical temperature limits, and the thermal governor tries to throttle CPUs to maintain temperature at or below the passive temperature limits. If the temperature exceeds the critical temperature limit, a shutdown is initiated.
To read the critical and passive trip points used for ACPI software throttling:
cat /sys/class/thermal/thermal_zone*/trip_point_0_type
cat /sys/class/thermal/thermal_zone*/trip_point_0_temp
cat /sys/class/thermal/thermal_zone*/trip_point_1_type
cat /sys/class/thermal/thermal_zone*/trip_point_1_temp
To modify these values, update the ACPI table.
Caution
We recommend that you do not change the default values.
If the passive trip point is lowered, throttling might occur more often, which affects the performance.
If the passive trip point is increased, the software might not always settle at the temperature, which leads to more aggressive hardware throttling, and can reduce performance.
GPU Temperatures#
For GPU temperature using nvidia-smi, to get the temperature output, run
the nvidia-smi -q -d TEMPERATURE command.
This step gets the current temperature and the temperature-related limits.
GB200 Power Steering Features#
In GB200, the power steering takes place between the one CPU and two GPUs on the GB200 module.
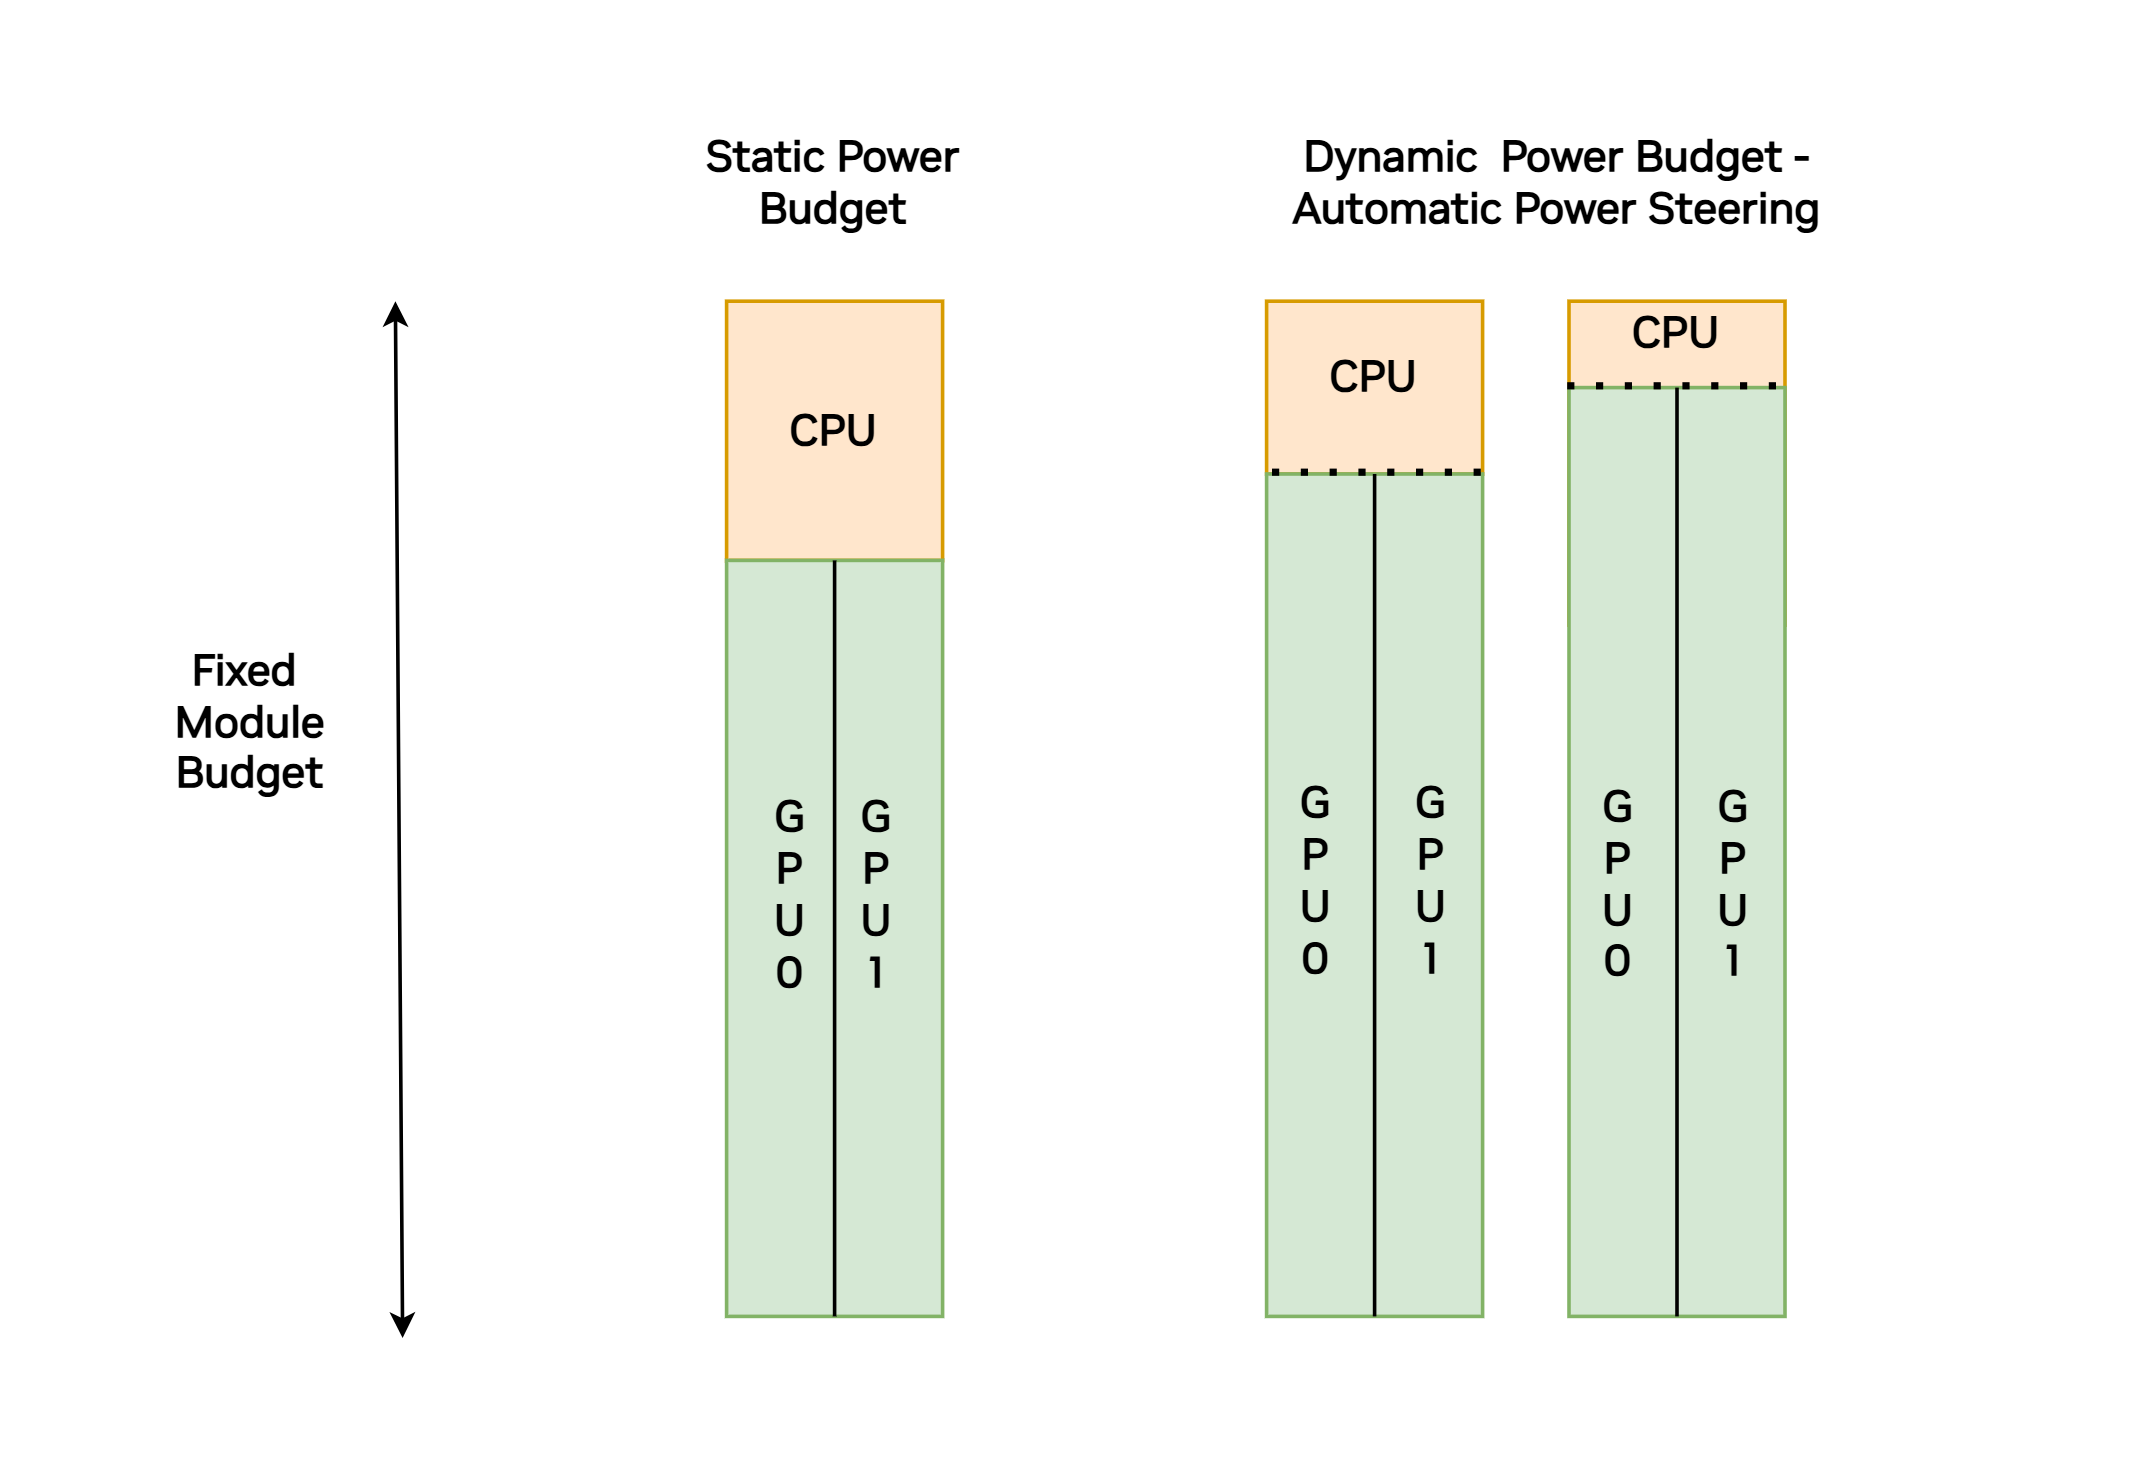
The Steering Architecture#
On the GB200 compute boards, the GPUs determine the amount of CPU power budget that is not being used by the CPU and allocates that power so that it can be used for the GPUs. The GPU TGP target is a function of the programmed TGP target or half of the TMP target minus the sampled TCP. The following equation provides a mathematical specification for the GPU TGP target:
〖TGP〗_Target=Min(〖TGP〗_Programmed,((〖TMP〗_programmed-〖TCP〗_Sampled ))/2)
Refer to NVIDIA GB NVL Power Management Application Note for Data Centers (NVOnline: 1124999) for more information.