Step #5: Create Grafana Dashboard to Monitor GPU Status
OpenShift installs a monitoring stack consisting of Prometheus, Thanos, Grafana, and other open source tooling. The NVIDIA Data Center GPU Manager (DGCM) is configured to send metrics relating to GPUs to the Prometheus stack, however the default OpenShift Grafana dashboard is read-only, so to create custom dashboards that show GPU usage information, you will need to install the Community Grafana Operator and configure it as described below.
Before Grafana can query metrics from OpenShift’s Prometheus instance, we must add a special user to the existing Prometheus Secret object. You will execute the following steps within the lab’s System Console.
Click the System Console link on the Launchpad navigation menu.

On the CLI, copy and paste the following snippet to allow Prometheus access.
            oc project openshift-monitoring
oc get secret prometheus-k8s-htpasswd -o jsonpath='{.data.auth}' | base64 -d > /tmp/htpasswd-prometheus
echo >> /tmp/htpasswd-prometheus
htpasswd -s -b  /tmp/htpasswd-prometheus nvadmin nvopenshift
oc patch secret prometheus-k8s-htpasswd -p "{\"data\":{\"auth\":\"$(base64 -w0 /tmp/htpasswd-prometheus)\"}}"
oc delete pod -l app=prometheus
oc delete pod -l app.kubernetes.io/component=prometheus
Using the left menu bar, expand the Operators section and select the OperatorHub .
Use the search bar to search for Grafana. Select the Community Grafana Operator .

Click Continue if prompted about installation of a Community Operator, then click Install. The next menu allows you to customize how and where the operator will be installed. Ensure Installed Namespace is set to nvidia-gpu-operator and leave all other settings at default values. Select Install to continue.
Wait while the Grafana Operator installs. Once you see “Installed operator - ready for use”, click View Operator. You should still be within the nvidia-gpu-operator project.
Click the Create Instance button below the Grafana option to instantiate a new Grafana instance.

Select the YAML View to configure the instance and paste the configuration below into the dialog, then click Create.

            apiVersion: integreatly.org/v1alpha1
kind: Grafana
metadata:
  name: nv-instance
  namespace: nvidia-gpu-operator
  labels:
    app: grafana
spec:
  dashboardLabelSelector:
  - matchExpressions:
      - { key: app, operator: In, values: [ grafana ] }
  config:
    security:
      admin_password: nvopenshift
      admin_user: nvadmin
  ingress:
    enabled: false
Click the + sign in the upper-right portion of the OpenShift Console, then paste the following Route definition in the dialog and click Create. This will expose the dashboard outside the OpenShift cluster.

            kind: Route
apiVersion: route.openshift.io/v1
metadata:
  name: grafana
  namespace: nvidia-gpu-operator
spec:
  host: ${tenant_uuid}-grafana.${domain}
  to:
    kind: Service
    name: grafana-service
    weight: 100
  port:
    targetPort: grafana
  tls:
    termination: edge
    insecureEdgeTerminationPolicy: Allow
  wildcardPolicy: None
Once the instance of Grafana has been deployed and the OpenShift Route has been configured, access the login page at https://${tenant_uuid}-grafana.${domain} or by expanding the Networking sidebar menu and clicking Routes. Then, select the URL for Grafana listed under the Location field.

You will be prompted to login with your LaunchPad credentials before being redirected to the Grafana login page. The credentials to login to Grafana match those used for the OpenShift Console.
Username: nvadmin
Password: nvopenshift
Follow the steps below to configure your Grafana Data Source, Prometheus in this case, before accessing Grafana & importing a dashboard.
Using the left menu bar, expand the Operators section, select the Installed Operators option, and click Grafana Operator.
Click the Create Instance button for the GrafanaDataSource custom resource.

From the Configure via radio selection, click YAML view and paste the following definition into the dialog.
            apiVersion: integreatly.org/v1alpha1
kind: GrafanaDataSource
      metadata:
  name: nv-ds
  namespace: nvidia-gpu-operator
spec:
  datasources:
    - basicAuthUser: nvadmin
      access: proxy
      editable: true
      secureJsonData:
        basicAuthPassword: nvopenshift
      name: Prometheus
        url: 'https://prometheus-k8s.openshift-monitoring.svc.cluster.local:9091'
      jsonData:
        timeInterval: 5s
        tlsSkipVerify: true
      basicAuth: true
      isDefault: true
      version: 1
      type: prometheus
  name: nv-ds.yaml
NoteThe credentials to login to Grafana match those used for the OpenShift Console:
Username: nvadmin
Password: nvopenshift
The URL is configured for the internal OpenShift Prometheus instance in the OpenShift Monitoring project/namespace.
Click the Create button.
Access the Grafana login page at https://${tenant_uuid}-grafana.${domain} or by expanding the Networking sidebar menu and clicking Routes. Then, select the URL for Grafana listed under the Location field.
Login with the previously configured admin credentials (nvadmin/nvopenshift).
Click the + icon on the left side of the screen. Choose import from the menu that pops up.

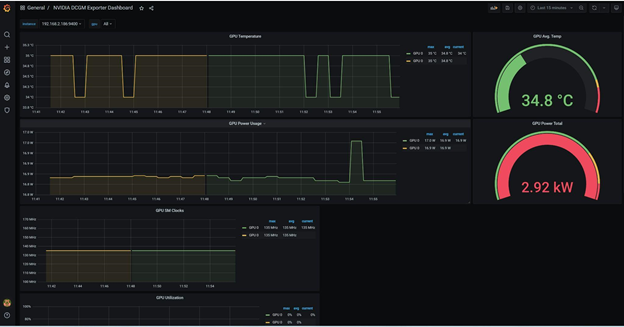
In the Import via grafana.com dialog box, enter the id 12239, then click Load. This will populate with the values needed to configure the NVIDIA DGCM Exporter Dashboard, published by NVIDIA. Edit the name and folder if desired, choose Prometheus as the data source, then click Import.

Your new dashboard will be available for viewing and should show baseline temperatures, power usage, and utilization information. Keep this page open, as we will be using it to monitor the GPUs in the subsequent exercise.
