NMC Autonomous Job Recovery User Guide#
Overview#
The Autonomous Job Recovery (AJR) is a comprehensive suite of cloud-native services developed by NVIDIA to enhance the productivity and reliability of AI training on large-scale supercomputers. It enables efficient AI cluster management by detecting, isolating, and recovering from failures autonomously, significantly reducing the manual effort required for large training jobs that can involve thousands of GPUs. The system’s architecture integrates seamlessly with Slurm, a popular workload manager, providing high fault tolerance and scalability.
Large-scale AI training, using thousands of GPUs over extended periods, is prone to interruptions from various sources such as infrastructure failures, network issues, and software bugs. These interruptions, occurring as frequently as every few hours, waste valuable time and computational resources. The AJR aims to minimize this downtime by enabling fast recovery, ensuring efficient resource utilization even with massive training jobs. The following figure illustrates an example AI training lifecycle spanning these failures.
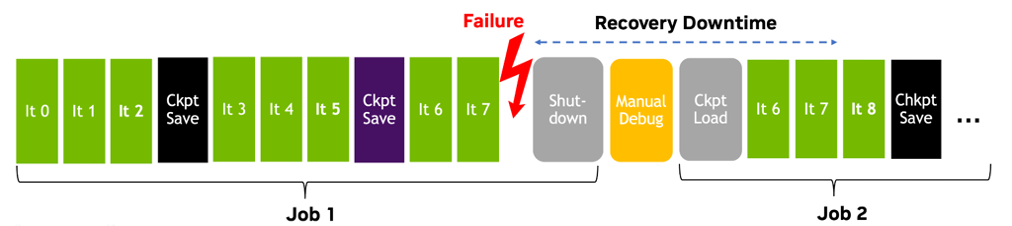
When the training job (Job 1) encounters a failure at iteration 7, denoted as It 7, we must first detect it and shut down the job. Then, the next job must restart and proceed to load the last saved checkpoint (Ckpt Load). The elapsed time between the last saved checkpoint and the first checkpoint load is considered overhead or downtime, as resources are not utilized for training during this period. This downtime consists of two components:
Manual overhead: Time spent debugging, checking logs, and coordinating findings with cluster administrators before restarting jobs (Manual Debug box in the figure above).
Non-manual overhead: Even with automated recovery, time is still consumed by failure detection, job shutdown, and checkpoint loading. Additionally, unsaved work (such as iterations 6 and 7) must be recomputed.
Efficiently addressing both manual and non-manual overheads is crucial for minimizing downtime and maximizing resource utilization in AI training.
As illustrated in the training lifecycle depicted above, the AJR is designed to address any cause of failure that results in an interruption of training jobs. By minimizing the “recovery downtime,” we maximize resource utilization, enabling efficient training and resource utilization even at massive scales. The system minimizes AI training downtime by efficiently addressing both manual and non-manual overheads, maximizing resource utilization even at massive scales.
NMC AJR Capabilities#
The AJR offers a comprehensive range of features designed to optimize AI training downtime on AI clusters:
Cloud-native services to minimize AI training downtime on AI clusters:
Fast, accurate, and fully automated anomaly detection, attribution, and isolation for issues such as training application stalls, persistent performance drops, stragglers, and crashes.
Rapid anomaly resolution, shutdown, and restart capabilities.
Scalable and efficient telemetry collection and analysis.
Continuous training workflow with minimal or no human intervention:
Automatic training job restart on healthy nodes.
Alerting mechanisms that provide timely notifications to address issues promptly.
Checkpoint monitoring and management to ensure data integrity and job continuity.
Understanding the AJR#
The AJR autonomously handles common failures encountered during AI training for both compute/infrastructure-related issues (such as network, storage, or node/GPU failures) and software problems within the AI training process, optimizing both manual and non-manual recovery processes. This capability not only boosts automated productivity gains but also enables the scaling of successful AI training practices across current and future generations of AI supercomputers. Key components include:
Anomaly Detection: Real-time detection of issues such as performance drops, crashes, and application hangs using telemetry data.
Failure Attribution and Isolation: The system attributes anomalies to the components where they originated (e.g., node-local resources like GPU/Memory, Network, or Storage) using the Failure Attribution and Characterization (FACT) engine, which analyzes system logs, application logs, and network metrics. Currently, the system isolates problematic GPU nodes to ensure only healthy resources are used in job restarts. Future capabilities will extend isolation to other infrastructure components such as network links and storage.
Automated Recovery: The AJR immediately restarts failed jobs, modifies job configurations to avoid problematic resources, and allows jobs to resume from saved checkpoints. The system also includes a watchdog to prevent prolonged downtime if a recovery does not proceed as planned.
These core services are managed by a Kubernetes cluster for high fault tolerance and scalability, which integrates with workload managers such as Slurm.
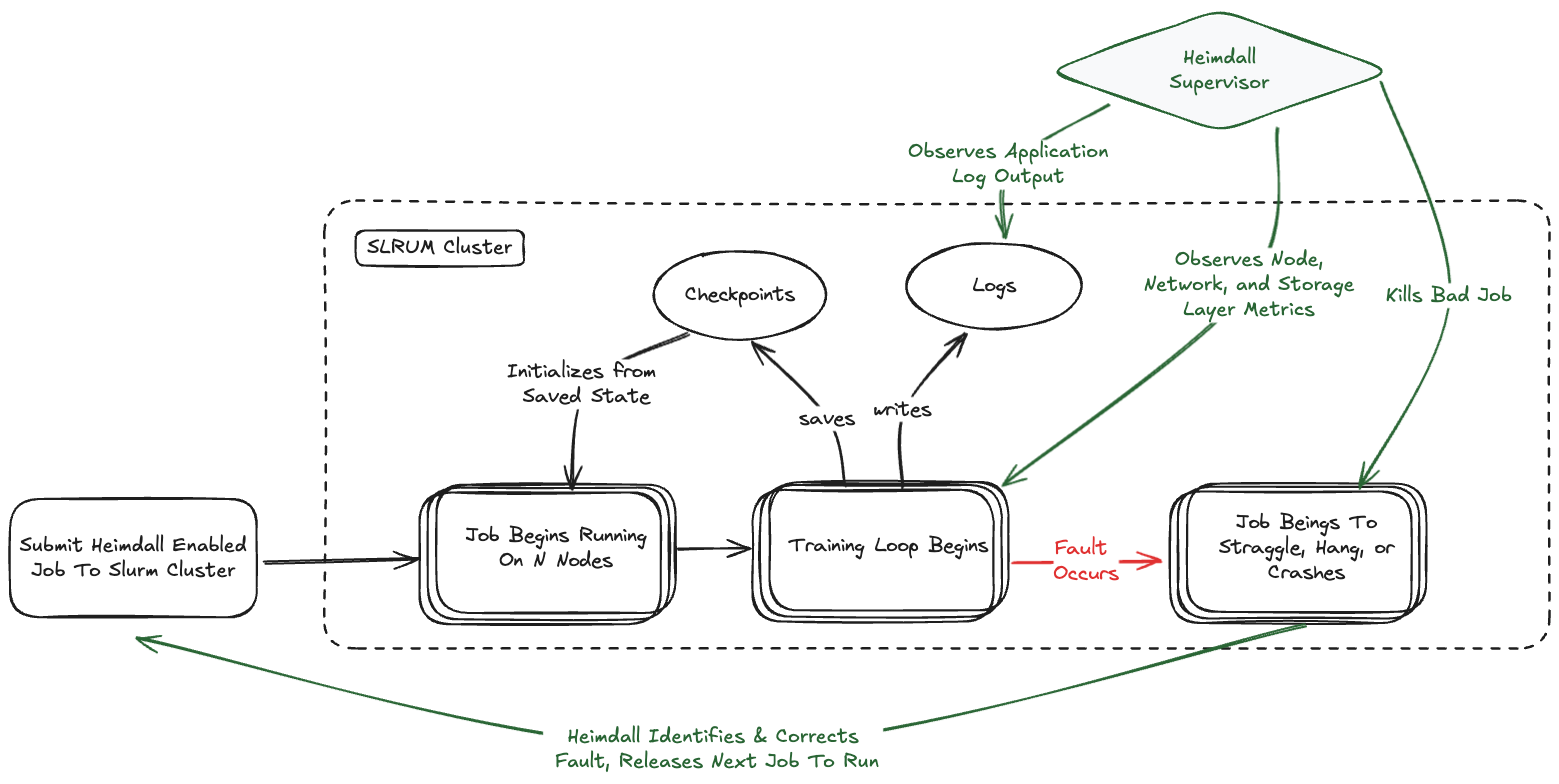
The diagram above illustrates how the AJR operates as an integrated system to detect, isolate, and recover from failures automatically. This comprehensive process operates through three interconnected stages:
1. Anomaly Detection & Monitoring The system continuously monitors AI training jobs in real-time, collecting telemetry data from various sources including system metrics, application logs, and network performance indicators. Using advanced algorithms, it identifies anomalies such as performance drops, application crashes, hangs, and straggler nodes that fall behind the expected throughput.
2. Failure Attribution & Isolation When an anomaly is detected, the Failure Attribution and Characterization (FACT) engine analyzes the collected data to determine the root cause and pinpoint the specific component responsible for the failure. This could be node-local resources (GPU, memory), network infrastructure, or storage systems. Once identified, the system isolates the problematic components—such as marking GPU nodes as unavailable—to prevent them from affecting subsequent job restarts.
3. Automated Recovery & Restart With the failure understood and problematic resources isolated, the system automatically restarts the failed job using only healthy resources. Jobs resume from their last saved checkpoint, minimizing lost work. The system also includes intelligent watchdog mechanisms to prevent prolonged downtime if the recovery process encounters unexpected issues.
This integrated approach transforms what would traditionally require manual intervention—often taking hours of debugging and coordination—into an automated process that typically completes within minutes, significantly improving training efficiency and resource utilization.
The AJR operates through a set of services running in a Kubernetes environment, ensuring that the system is highly available and stable during long-running model training workflows.
Using the AJR#
While any job submitted to an AJR-enabled cluster can utilize the system, the greatest benefits will be seen for jobs with a short expected mean time between failures. This metric decreases roughly linearly as the node and GPU count increases. Jobs of any size can benefit from the AJR, with particularly significant benefits for jobs that meet any of the following criteria:
Node Count: Greater than 16
GPU Count: Greater than 128
Expected Job Completion (Wall Time): More than 1 day
Even smaller jobs can benefit from the AJR’s automatic recovery and failure handling capabilities, eliminating the need for manual job monitoring and intervention.
Additionally, developers who want the AJR to automatically requeue and stop their jobs after reaching the maximum retries—when encountering terminal application errors to prevent compute wastage—can rely on the system to eliminate the need for manual job babysitting.
Job Compatibility#
Workload Assumptions
The AJR is primarily designed and tested for PyTorch training workloads. While the system can technically work with other frameworks, optimal performance and reliability are achieved with PyTorch-based applications.
Supported Workloads
LLM Models: Large Language Models based on: - NVIDIA NeMo framework - Megatron architecture - Cosmos framework
Supported Frameworks
PyTorch Lightning: Full support for PyTorch Lightning training workflows and lifecycle management
Untested Frameworks
The following frameworks are untested and may produce unexpected behavior or “odd” results:
TensorFlow
JAX
Ray
Other non-PyTorch frameworks
Failure Modes for Unsupported Workloads
When the AJR is deployed on unsupported workloads where log patterns are not recognized:
Anomaly detection may fail to identify application-specific failure patterns
Attribution and isolation decisions may be inaccurate
Automatic recovery mechanisms may not function optimally
Manual intervention may be required more frequently
Note
For best results, ensure your training workload uses PyTorch and follows recognized logging patterns. If using unsupported frameworks, monitor system behavior closely and be prepared for manual intervention.
Getting Started#
Setup Access#
Since the AJR will be performing job actions on behalf of the user (such as squeue, scancel, scontrol), its service account, svc-aps-wfc, will need coordinator access to the Slurm account under which jobs will be running. Contact your system administrator to ensure this access is configured.
Enrolling a Slurm Job#
When running jobs on a supported cluster, utilizing the AJR management requires an explicit opt-in and will require modifications to the sbatch script used to submit the job. The basic steps are:
Register the job with the AJR by adding a particular comment to the sbatch script.
Write a single unified log file for all process ranks.
Make the log file available for the AJR to monitor.
Registering Jobs#
Jobs to be monitored by the AJR must have the following option enabled:
For example, a batch script that begins:
#SBATCH --comment='{"APS": {"auto_resume_mode": "requeue"}}'
This is done by simply appending a new comment line to the group of lines at the start of the relevant sbatch script. It is important that no other comment string is passed to Slurm for this to be successful.
For example, a batch script that begins:
#!/bin/bash

#SBATCH -t 01:00:00 --nodes=32 --exclusive --mem=0 --ntasks-per-node=8 --gpus-per-node=8 --job-name=myjob --account=training_account --comment="Training test"

#... configuration and srun, etc
Would be modified to look like:
#!/bin/bash
#SBATCH -t 01:00:00 --nodes=32 --exclusive --mem=0 --ntasks-per-node=8 --gpus-per-node=8 --job-name=myjob --account=training_account
#SBATCH --comment='{"APS": {"auto_resume_mode": "requeue"}}'

#... configuration and srun, etc
Auto Resume Modes#
The AJR supports different auto resume modes that control how jobs are automatically restarted after failures. The auto resume mode is specified in the job comment directive:
requeue (Recommended): The standard mode where jobs are automatically requeued and restarted after failures, with isolated nodes excluded from subsequent runs. This is the actively maintained and recommended mode for all new deployments.
#SBATCH --comment='{"APS": {"auto_resume_mode": "requeue"}}'The maximum number of requeues for a job is determined by three factors:
System Level Configuration: A configurable upper bound set at the system level, typically in the order of dozens. This value should be large enough that it is not reached unless a job runs for an extremely long time with persistent failures.
Job Level Configuration: Individual jobs can specify their own maximum requeue limit using the
max_requeue_timesparameter in the JSON configuration. The system will use the smaller value between the job-level setting and the system-level maximum.#SBATCH --comment='{"APS": {"auto_resume_mode": "requeue", "max_requeue_times": 10}}'Checkpoint-based Requeue Early Stop: When a job has more than X consecutive failed attempts without successfully saving a new checkpoint, the job will be considered as crashlooping and the requeue sequence will be stopped. Here X is a configurable threshold at the system level.
Note
This mechanism assumes that the log patterns used by the jobs are recognized by the AJR. Usage of the AJR logging client library will solve this problem automatically.
singleton_dependency (Deprecated): An alternative auto resume mode that manages job dependencies in a singleton pattern.
#SBATCH --comment='{"APS": {"auto_resume_mode": "singleton_dependency"}}'Warning
Deprecated: The
singleton_dependencymode is deprecated and will not receive updates for new features in future releases. It is recommended to migrate to therequeuemode for continued support and access to new capabilities.
Writing Log files#
Utilize the srun command to launch subtasks on each node process.
Use a single output file to collect all logs from each srun task (per-rank logging and separation of stdout and stderr are not supported).
A specific file name should be used for the output file:
{SLURM_JOB_NAME}_${SLURM_JOB_ID}_${DATETIME}.log where DATETIME=`date +'date_%y-%m-%d_time_%H-%M-%S'`
Pass the -l and -u flags to the srun command within the sbatch script. These flags prevent log output buffering and append the rank number corresponding to the source of each log line.
Example Log File Modifications#
The following code is an example of what it might look like to make a submission using the symlink approach. In the example, we assume all files in the SLURM_LOG_DIR have 751 permission bits set by default.
#SBATCH --comment='{"APS": {"auto_resume_mode": "requeue"}}'

export SLURM_LOG_DIR=<insert your log directory here>
DATETIME=`date +'date_%y-%m-%d_time_%H-%M-%S'`

export APS_LOG_FILE=${SLURM_JOB_NAME}_${SLURM_JOB_ID}_${DATETIME}.log

srun -l -u --output="${SLURM_LOG_DIR}/aps.log" …
Submitting Jobs#
The AJR requires the user to submit a job once. It then monitors the job and requeues it while withholding bad or suspect nodes.
sbatch your_batch_script # with AJR spec in the comment section
Application Log Format Requirements#
To ensure the AJR can effectively monitor and manage your training jobs, follow these formatting requirements for Slurm application logs:
Job ID in filename: The log filename should include the Slurm job ID. For example,
1234567in:megatron_1234567_date_2024-07-31_time_18-15-55.logRegular heartbeat: The application should log at least one line every two minutes. This helps the AJR detect application hangs.
Throughput logging: The application should log periodic iteration throughput containing the substring “TFLOP” to detect straggler anomalies. For example:
[2024-07-30 14:21:44] iteration 30/81380208 | consumed samples: 720 | elapsed time per iteration (ms): 2986.9 | throughput per GPU (TFLOP/s/GPU): 386.7
Timestamps: Ensure that all log entries contain timestamps.
AJR Training Telemetry Client Library Integration#
For optimal AJR performance and to simplify compliance with the log format requirements above, we highly recommend using the AJR Training Telemetry Client Library. This standard logging library integration is essential for:
KPI Data Ingesting and Computation: Automated collection of training metrics in standardized formats
Training Throughput Monitoring: Real-time hang detection and performance tracking
Progress Tracking: Consistent checkpoint monitoring and iteration progress reporting
The telemetry client library provides a Python API that automatically generates properly formatted logs that the AJR can parse and analyze effectively.
Benefits of Using the Client Library#
Automatic Log Format Compliance: Eliminates manual log formatting and ensures all required fields are present
Structured Event Recording: Captures training events, metrics, and errors in standardized formats
Low Overhead Monitoring: Minimal performance impact on training workloads
Enhanced Failure Attribution: Provides detailed context for better root cause analysis
Checkpoint Progress Tracking: Enables accurate checkpoint-based requeue early stop functionality
Installation#
Install the training telemetry library from NVIDIA’s Artifactory:
pip install --extra-index-url https://pypi.nvidia.com --upgrade aidot_training_telemetry
PyTorch Integration Patterns#
The following patterns are based on the actual Megatron telemetry integration in production as well as a PyTorch example available in the training_telemetry repository:
Initialize Telemetry Provider
from training_telemetry.config import TelemetryConfig, LoggerBackendConfig
from training_telemetry.provider import Provider
from training_telemetry.torch.utils import get_rank

# Initialize telemetry with the logging backend enabled on rank 0 only, other ranks will only log errors.
# Other backends are also available (e.g. file or NVTX) but are not currently used by the AJR.
errors_only = get_rank() != 0
backends = [LoggerBackendConfig(rank_aware=True, errors_only=errors_only)]
Provider.set_provider(TelemetryConfig(backends=backends))
Application-Level and Training Loop Monitoring
The following code shows how to monitor the application and training loop, sending iteration metrics to the AJR periodically.
from training_telemetry.context import running, training, get_recorder
from training_telemetry.metrics import ApplicationMetrics, IterationMetrics
from training_telemetry.torch.utils import get_rank, get_world_size
from tzlocal import get_localzone

def get_application_metrics():
    return ApplicationMetrics.create(
        rank=get_rank(),
        world_size=get_world_size(),
        node_name="localhost",
        timezone=str(get_localzone()),
        total_iterations=num_epochs * len(dataloader),
        checkpoint_enabled=True,
        checkpoint_strategy="sync",
    )

@running(metrics=get_application_metrics())
def main():
    # Main training function with automatic exception handling
    with training() as training_span:

      current_iteration = 0

      for epoch in range(num_epochs):
          for batch_idx, (inputs, targets) in enumerate(dataloader):
            # Iteration code here
            # [...]

            # Log iteration metrics every 10 epochs
            if epoch % 10 == 0:
                metrics = IterationMetrics.create(
                    current_iteration=current_iteration,
                    num_iterations=len(dataloader),
                    interval=len(dataloader),
                    loss=loss.item(),
                    tflops=100,  # Replace with actual TFLOPS calculation
                )
                get_recorder().event(Event.create(EventName.TRAINING_ITERATIONS, metrics=metrics), training_span)

            current_iteration += 1
Checkpoint Monitoring
The following code shows how to monitor checkpoint saving, sending checkpoint metrics to the AJR.
Unlike iteration metrics, which are sent by logging an explicit event, checkpoint metrics are sent at the end of the checkpoint span.
from training_telemetry.context import checkpoint_save
from training_telemetry.metrics import CheckpointMetrics, CheckPointType
import tempfile
import os

# Checkpoint saving with telemetry (every 5 epochs in this example)

checkpoint = {
    "model_state_dict": model.state_dict(),
    "optimizer_state_dict": optimizer.state_dict(),
    "epoch": epoch,
    "iteration": current_iteration,
    "loss": loss.item(),
}
with checkpoint_save() as checkpoint_save_span:
    with tempfile.TemporaryDirectory() as temp_dir:
        checkpoint_file_name = os.path.join(temp_dir, f"checkpoint_iter_{current_iteration}.pt")
        torch.save(checkpoint, checkpoint_file_name)
        checkpoint_save_span.add_metrics(
            CheckpointMetrics.create(
                checkpoint_type=CheckPointType.LOCAL,
                current_iteration=current_iteration,
                num_iterations=len(dataloader),
                checkpoint_directory=temp_dir,
            )
        )
Key Features for AJR Integration#
The telemetry client library automatically provides:
Structured Log Output: Events logged in structured log format with all required fields
Timestamp Standardization: Consistent timestamp formatting across all events
Throughput Metrics: Automatic TFLOPS monitoring for straggler detection when TFLOPs are recorded with the iteration metrics
Exception Handling: Captures and reports training errors with full context
Checkpoint Progress: Detailed tracking of checkpoint saves and loads
Rank Information: The logger and file backends are rank-aware, but the AJR will monitor rank 0 only.
Available Context Managers
The library provides several context managers for different training phases:
running(): Wraps the entire application lifecycle with error handlingtraining(): Monitors the complete training loop durationcheckpoint_save(): Tracks checkpoint save operations with detailed metricsvalidation(): Monitors the validation or test loops durationtimed_span(): Generic context manager for timing any code block with custom span names as defined in theSpanNameenum
To create a custom context manager you can use the following code:
from contextlib import contextmanager
from training_telemetry.context import get_telemetry_recorder
from training_telemetry.spans import SpanName
from typing import Callable, Generator

@contextmanager
def get_context(create_span_name: Callable) -> Generator[None, None, None]:
    recorder = None
    try:
        recorder = get_telemetry_recorder()
        span = recorder.start(SpanName.MODEL_INIT)

        yield

    except Exception as e:
        recorder.error(error_message=f"Error {e} in span {span_name}", exception=e, span=span)
        raise e
    finally:
      if recorder:
        recorder.stop(span)
Supported Span Types
The library includes predefined span types for comprehensive monitoring:
Long-running spans:
MAIN_FUNCTION,TRAINING_LOOP,VALIDATION_LOOPCheckpoint spans:
CHECKPOINT_SAVE_SYNC,CHECKPOINT_SAVE_ASYNC,CHECKPOINT_LOADIteration spans:
ITERATION,MODEL_FORWARD,MODEL_BACKWARD,OPTIMIZER_UPDATEInitialization spans:
MODEL_INIT,OPTIMIZER_INIT,DATA_LOADER_INIT
Log Format Compliance
When using the client library, logs automatically include:
Rank information
Proper timestamp formatting
Throughput metrics with “TFLOP” substring for straggler detection
Structured error reporting with stack traces
Multi-Backend Support
The library supports multiple output backends simultaneously:
Logger Backend: Structured key=value logs via Python logging
File Backend: JSON-formatted events written to files
OpenTelemetry Backend: Trace spans sent to OTEL collectors using the OpenTelemetry Protocol (OTLP)
NVTX Backend: Code markers for NVIDIA Nsight Systems profiling
Integration with Existing Frameworks
The library is designed to integrate seamlessly with:
PyTorch Lightning: Full support for Lightning training workflows
NVIDIA NeMo: Compatible with NeMo training pipelines
Megatron: Supports distributed training architectures (as demonstrated in production)
Custom PyTorch: Easy integration with existing PyTorch training code
Integration Benefits
The telemetry library integration provides automatic compliance with AJR monitoring requirements:
Structured JSON Logs: All training events are automatically logged in the proper format
TFLOPS Tracking: Throughput metrics are captured for straggler detection
Checkpoint Progress: Detailed progress tracking enables checkpoint-based recovery
Exception Handling: Automatic error capture with stack traces for root cause analysis
Multi-Backend Support: Logs to Python logger, JSON files, OpenTelemetry, and NVTX simultaneously
Note
Using the AJR Training Telemetry Client Library is the recommended approach for ensuring your training jobs are fully compatible with the AJR’s monitoring and recovery capabilities. It eliminates the need for manual log formatting and provides enhanced failure attribution through structured event recording.
Warning
Jobs that do not use the client library may experience reduced effectiveness in the AJR’s checkpoint-based requeue early stop functionality, as the system relies on recognizing specific log patterns for progress tracking.
Job Workflow#
Job Registration
AJR can manage Slurm jobs on a per-slurm-partition or per-slurm-job basis.
In a per-slurm-partition deployment, all jobs submitted to a particular partition will automatically be managed by ARJ if they link their log output file as specified below.
In a per-slurm-job deployment, only jobs that include the --comment='{"APS":{}}' directive (either via the sbatch CLI or within an sbatch script) will be managed by AJR. These jobs also need to link their log files. In a per-partition deployment, any job submitted to any Slurm partition with an opt-in comment will also be AJR-managed.
Initial Job Submission
Submit the first job instance using the sbatch command with your desired job name:
sbatch ... --job-name=your_job_name your_job_script.sh
Job States
The first job will run normally.
If the job fails, AJR will analyze the failure and automatically restart it with problematic nodes excluded.
If the job succeeds and exits cleanly, no further action is taken.
Monitoring Your Jobs
Use the squeue command to view the status of your jobs:
squeue --meAccess monitoring dashboards (provided by your system administrator) to view job performance and recovery metrics.
Note
Ensure your job script can handle being run multiple times if necessary.
Resuming from a checkpoint is mandatory for AJR to work effectively.
The system will automatically exclude problematic nodes from subsequent job runs.
Cockpit#
The Cockpit and Web UI are optional components of AJR, providing a user-friendly interface for monitoring and managing the system. They are not required for the core functionality of AJR but can enhance user experience and provide additional insights into the system’s operations.
The Cockpit URL will be different for each deployment, but it typically follows the format:
`
https://<cockpit-host>/mission-control/recovery-engine
`
The Sign In Page#
The sign-in page allows users to authenticate and access the Cockpit. Users can log in using their existing credentials, which are managed by the underlying authentication system (e.g., LDAP, OAuth). Once clicked, the “Sign In” button will redirect users to the Authentication Provider’s login page, where they can enter their credentials.

The Home Page - Workflow Overview#
Once authenticated, users are directed to the Cockpit home page, the workflow overview page. This page provides an overview of the workflows’ status, including active jobs, states, anomalies and attributions, running time, etc.
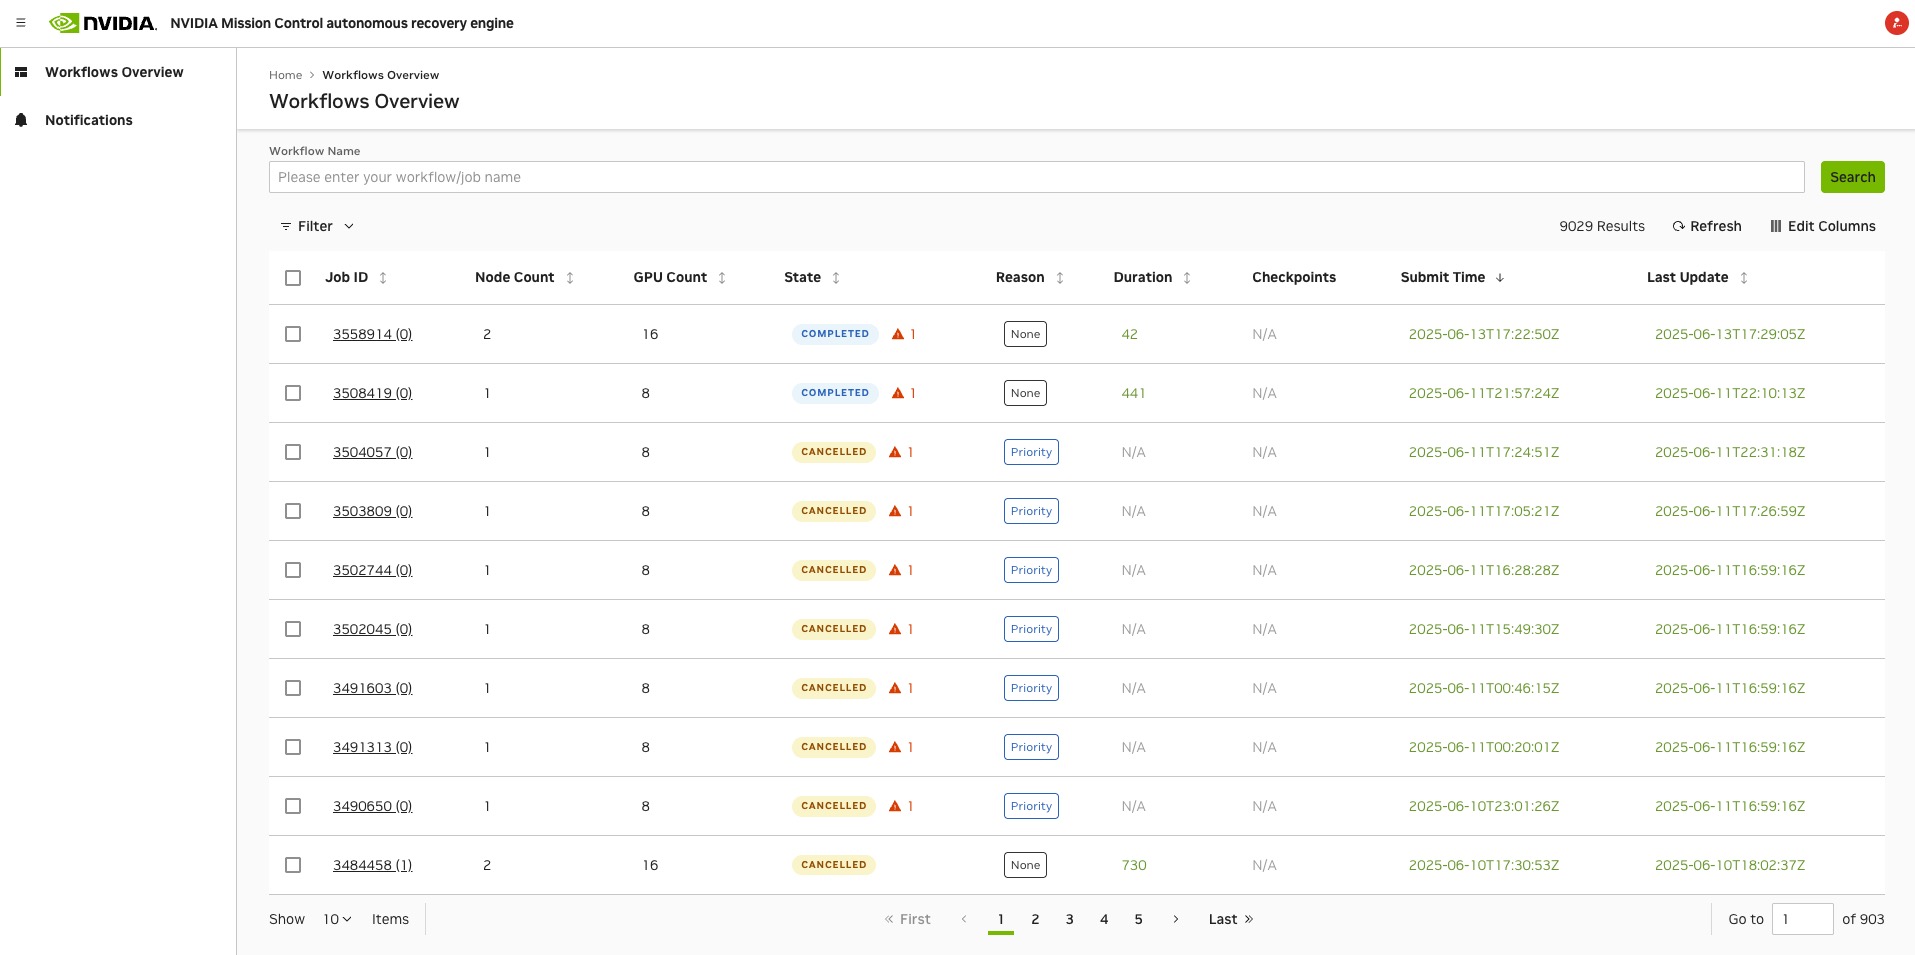
Users can type in the workflow name to filter the list of workflows. By default, the most recent jobs are displayed.
The workflow overview page displays the following information:
Workflow Name Search Bar: A search bar that allows users to filter the list of workflows by name.
Refresh Button: A button that allows users to refresh the workflow list manually.
Edit Columns: A button that allows users to customize the columns displayed in the workflow list.
Filter Button: A button that allows users to filter the workflow list based on specific criteria, such as job ID or state.
Pagination: A pagination control that allows users to navigate through the list of workflows.
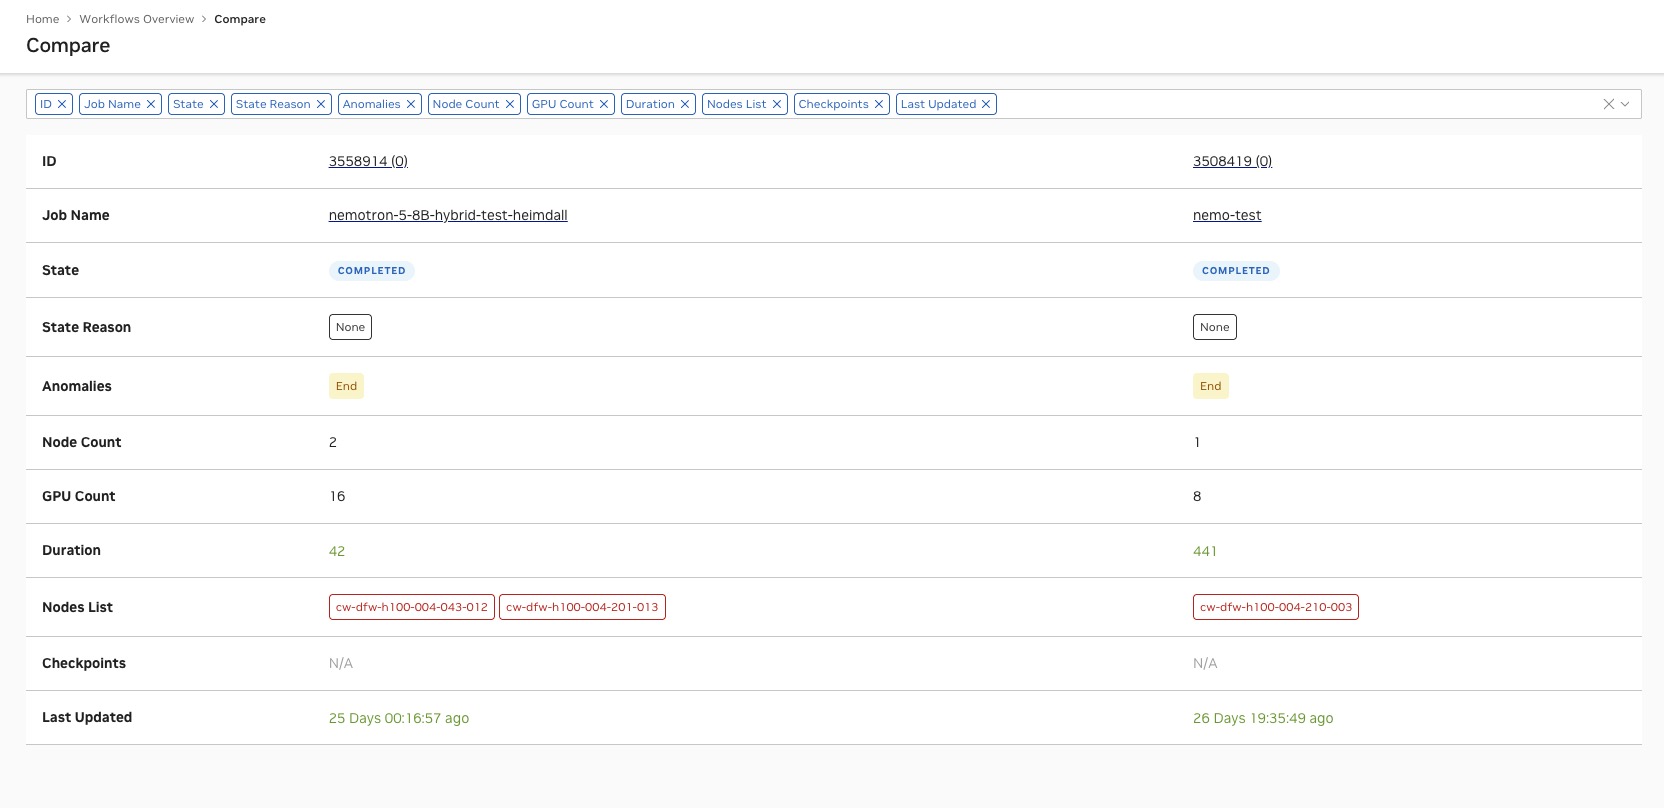
In the workflow list, each row represents a job in the workflow, each column title is clickable and sortable, by default they are sorted by the submit time, the following information is displayed: - Job Selection Checkbox: A checkbox that allows users to select multiple jobs for comparison. When multiple jobs are selected, a Compare button will appear, which will redirect to the comparison view.
Job ID: The ID of the jobs and the Attempt Index. When clicked, users will be redirected to the job details page.
Node Count: The number of nodes allocated to the job.
GPU Count: The number of GPUs allocated to the job.
State: The current state of the job (e.g., Running, Completed, Failed), which are explained here <https://slurm.schedmd.com/job_state_codes.html>. Anomalies and attributions are displayed as a triangle with colors if any exist. Hovering over the triangle will show the anomalies and attributions in a tooltip.
Reason: The reason for the job’s current state, which can be found here <https://slurm.schedmd.com/job_reason_codes.html>, such as “JobHeldUser” or “TimeLimit”.
Duration: The total running time of the job, which is calculated as the difference between the start and end/current times. When clicked, it will switch between the total running seconds and the total running time in the format of “DD HH:MM:SS”. When hovered over, it will show the start and end time of the job.
Checkpoints: The number of checkpoints created for the job, which can be useful for resuming long-running jobs from a specific point. When hovered over, the last checkpoint time will be displayed.
Submit Time: The time when the job was submitted. When clicked, it will switch between the submit time and the elapsed time since submission.
Last Update: The time when the job was last updated, which can indicate the last time the job state or attributes were changed. When clicked, it will switch between the last update time and the elapsed time since the last update.
Job Details Page#
The Job Details page provides detailed information about a specific job, including its state, anomalies, attributions, and other relevant data. Users can access this page by clicking on a job ID in the workflow overview page.
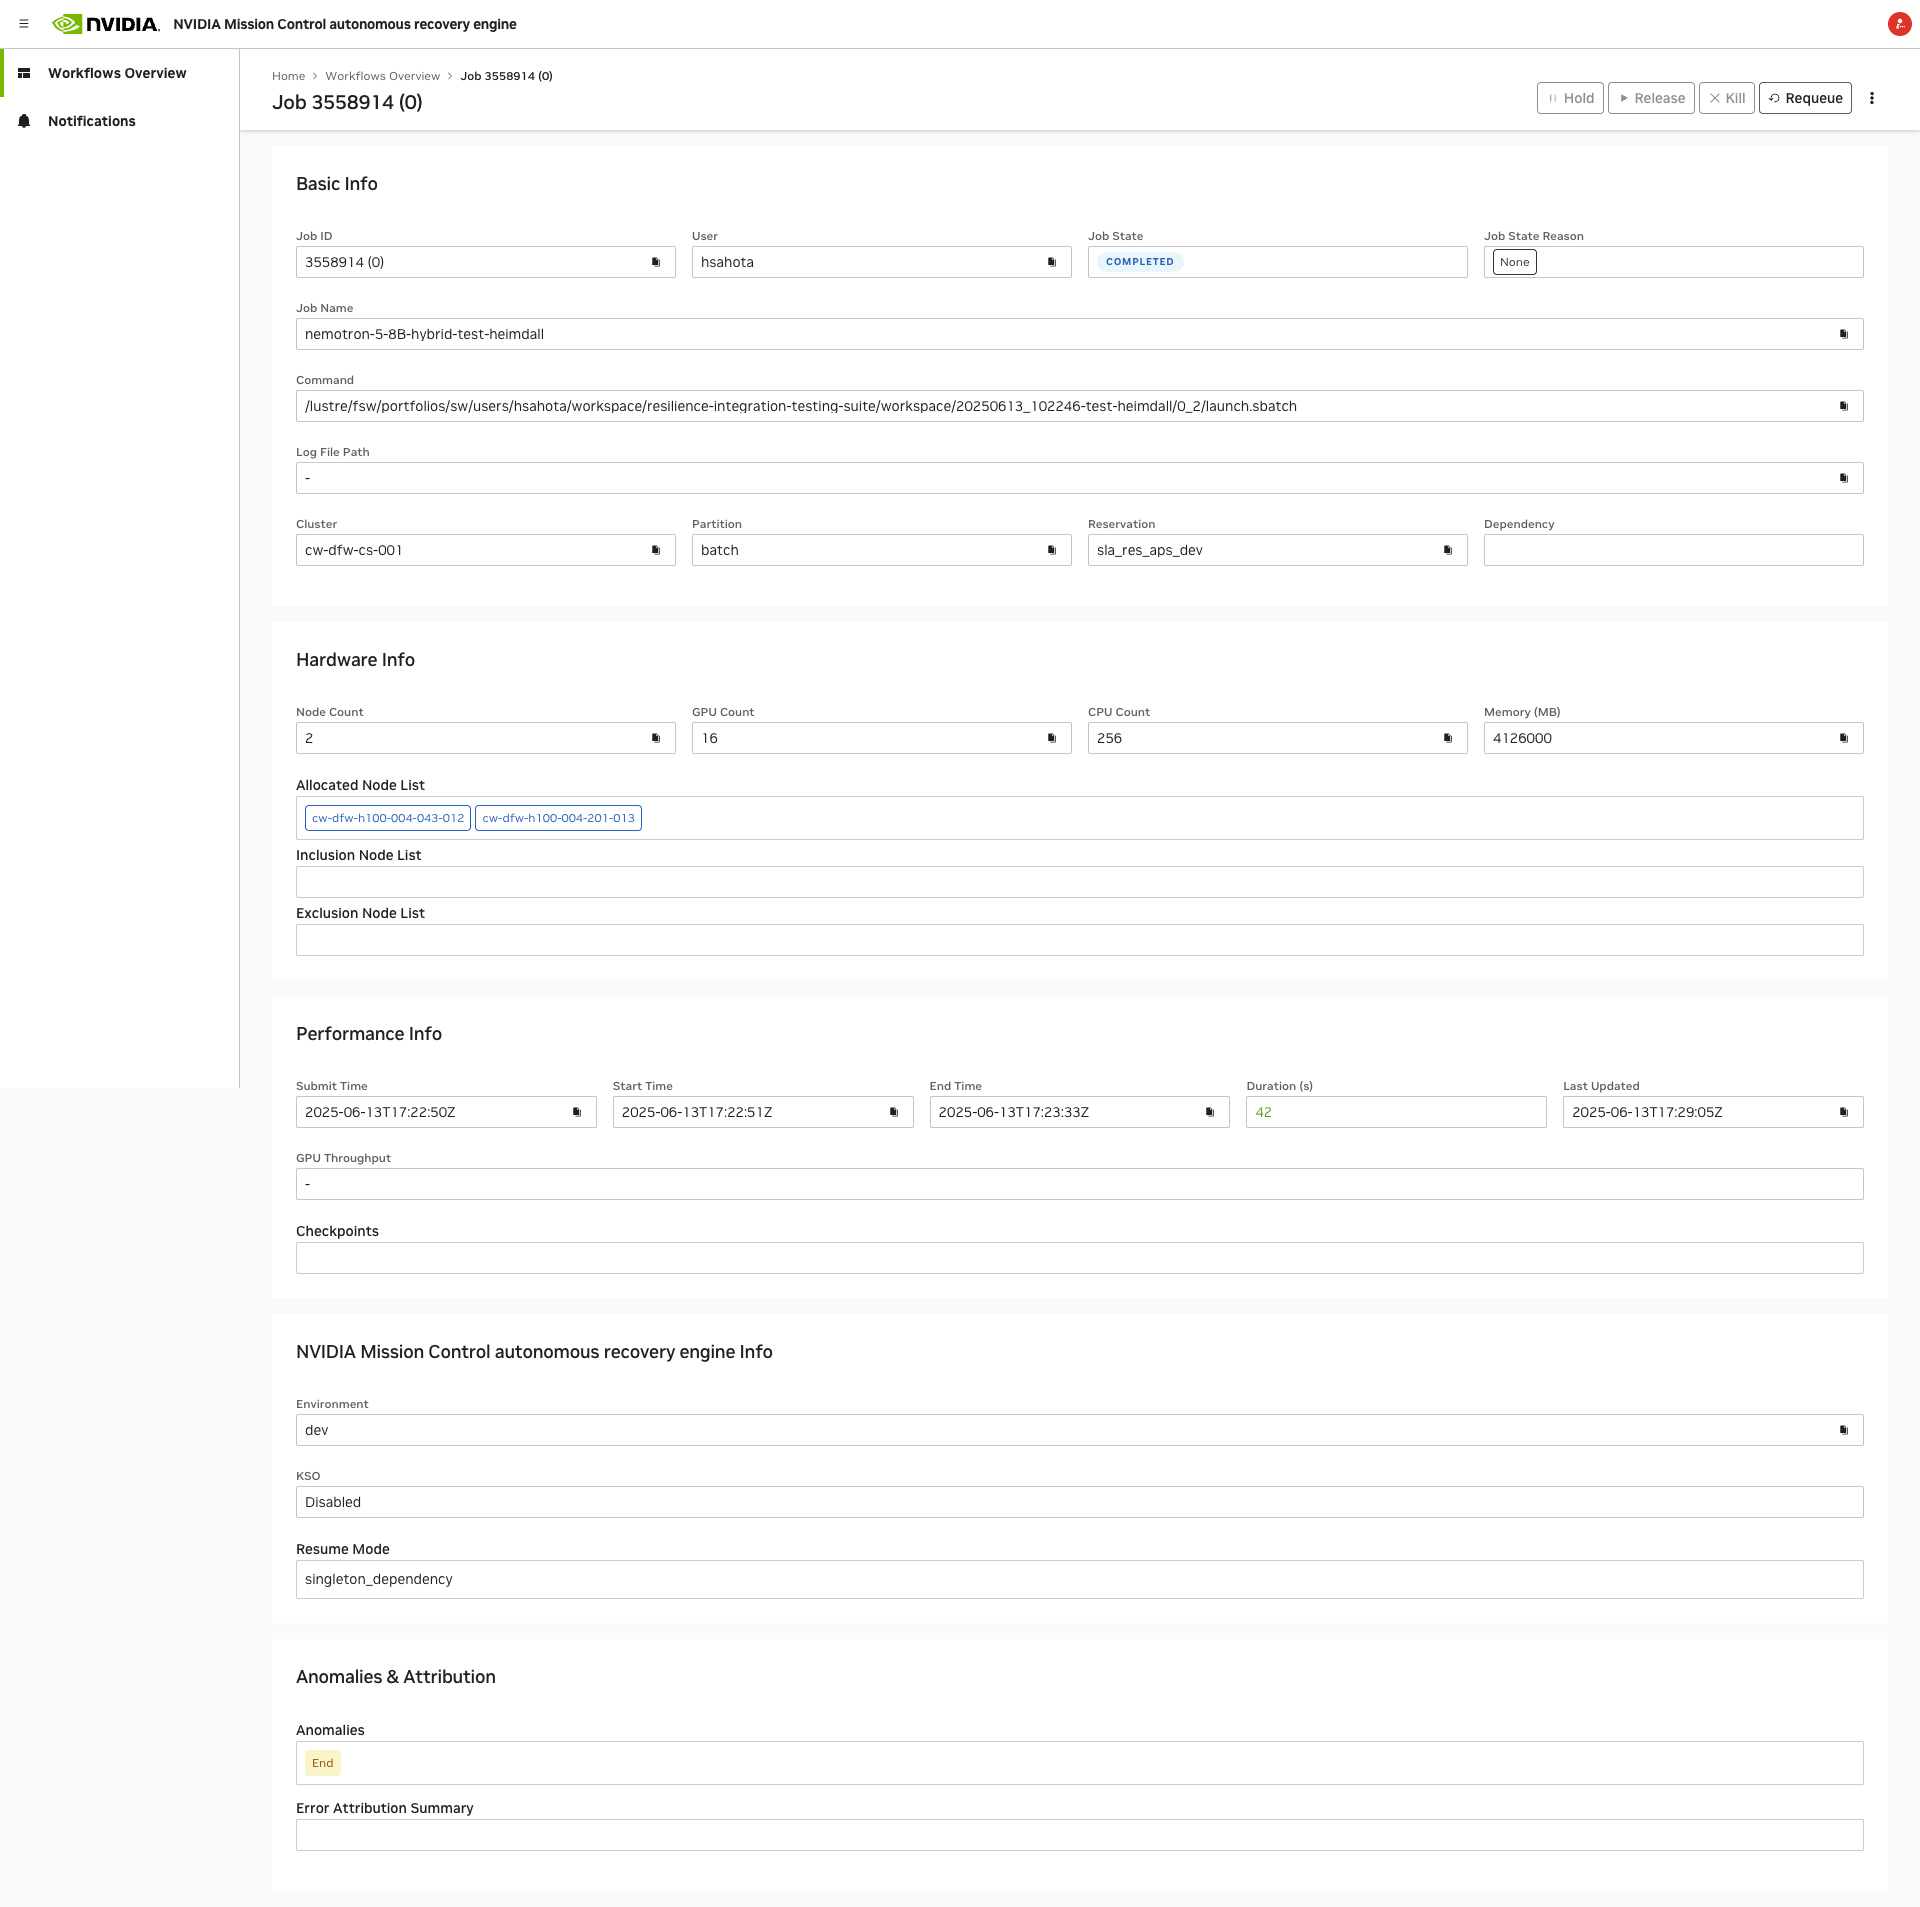
The Job Details page displays the following information:
Basic Info:
Job ID: The unique identifier for the job and the Attempt Index
User: The user who submitted the job.
Job State: The current state of the job.
Job State Reason: The reason for the job’s current state.
Job Name: The name of the job.
Command: The command used to submit the job.
Log File Path: The path to the log file for the job.
Cluster: The cluster where the job is running.
Partition: The partition where the job is running.
Reservation: The reservation where the job is running.
Dependency: The dependencies of the job, if any.
Hardware Info:
Node Count: The number of nodes allocated to the job.
GPU Count: The GPU resources allocated to the job.
CPU Count: The CPU resources allocated to the job.
Memory: The memory resources allocated to the job.
Allocated Node List: The list of nodes allocated to the job.
Inclusion Node List: The list of nodes that are included in the job.
Exclusion Node List: The list of nodes that are excluded from the job.
Performance Info:
Submit Time: The time when the job was submitted.
Start Time: The time when the job started running.
End Time: The time when the job finished running.
Duration: The total running time of the job.
Last Update: The time when the job was last updated.
GPU Throughput: The GPU throughput of the job.
Checkpoints: A chart of checkpoints created by the job.
NVIDIA Mission Control AJR info:
Environment: The environment in which the job is running, e.g., dev.
KSO: True if the KSO feature is enabled for the job, false otherwise.
Auto Resume Mode: The auto resume mode for the job, which can be “requeue” or “singleton dependency”.
Anomalies & Attribution:
Anomalies: A list of anomalies detected for the job, including their types and timestamps.
Error Attribution Summary: A summary of the error attribution for the job
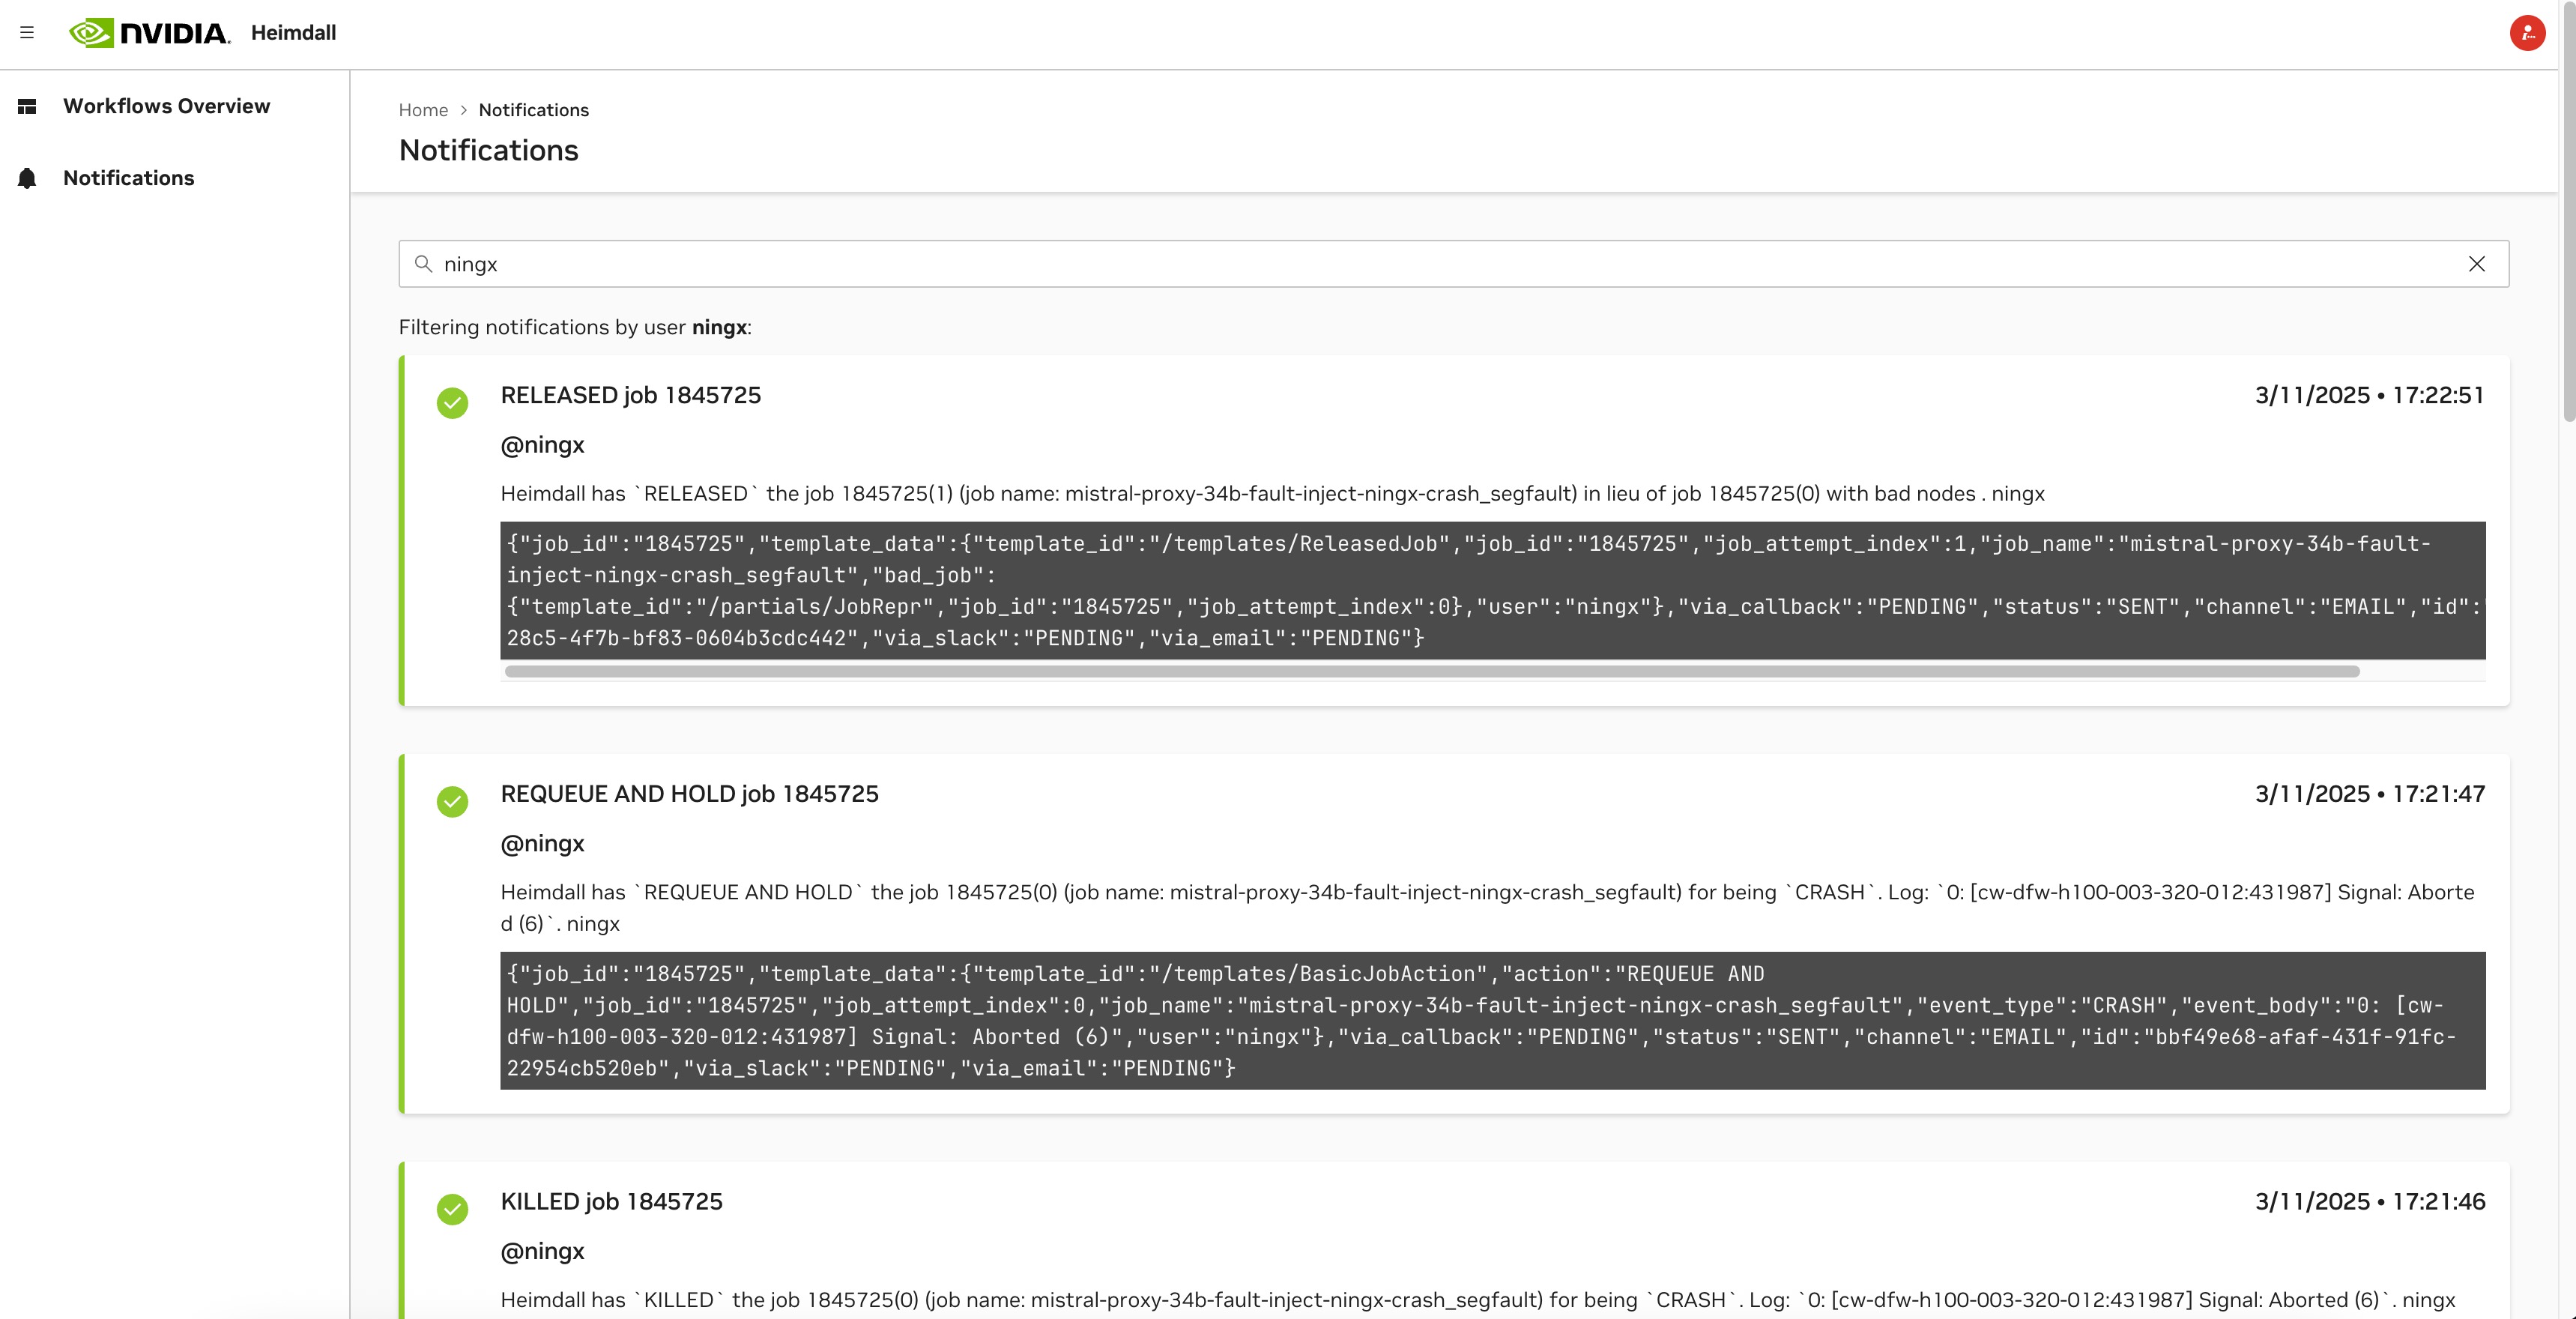
Notifications Page#
The Notifications page provides a list of notifications related to the jobs and workflows monitored by the AJR. Users can access this page by clicking on the “Notifications” link in the Cockpit navigation menu.
By default, it will filter the notifications by the current user, but users can change the filter to show all notifications. The notifications are displayed in a list of cards:
Best Practices#
Checkpointing: Implement frequent checkpointing to minimize lost work during recovery.
Log Quality: Ensure your application produces clear, timestamped logs that follow the required format.
Resource Sizing: Jobs of any size can benefit from AJR, with larger jobs (16+ nodes, 128+ GPUs) seeing the most significant benefits.
Framework Choice: Use PyTorch-based frameworks for optimal compatibility.
Testing: Test your job scripts with AJR on smaller scales before submitting large production jobs.
Frequently Asked Questions#
Why didn’t my job get requeued?
There are several reasons why a job might not be requeued:
The job completed successfully (no requeue needed)
The job reached the maximum number of requeue attempts (system or job-level limit)
The job was manually canceled with
scancelThe job lacks the proper comment directive in the batch script
The job encountered a crashloop pattern (failed multiple times without saving checkpoints)
Log patterns indicate application-level errors that don’t warrant automatic recovery
How do I know AJR is working for my job?
You can verify AJR is managing your job by:
Checking that your job includes the
--comment='{"APS": {"auto_resume_mode": "requeue"}}'directiveMonitoring job status with
squeue --me- requeued jobs will have incremented job IDsAccessing Cockpit
Looking for AJR-related messages in system notifications or alerts
Checking job history with
sacctto see if previous attempts failed and new ones started
I don’t know why my job was requeued - how can I find out?
To understand why your job was requeued:
Examine Cockpit on the job: Use the Cockpit interface to view detailed job analysis, failure attribution, and requeue reasons
Check your job’s log files for error messages or failure patterns
Use
sacct -j <job_id> --format=JobID,JobName,State,ExitCode,DerivedExitCodeto see exit codesContact your system administrator to review AJR’s analysis of the failure
Look for common failure patterns: GPU errors, network timeouts, memory issues, or application crashes
Review monitoring dashboards for performance anomalies before the restart
How long does it take to requeue a job?
The requeue process typically takes:
Detection: 15 seconds to 2 minutes (depending on the type of failure)
Analysis: Additional 30-60 seconds for failure attribution and node isolation
Requeue: Nearly immediate once analysis is complete
Total: Usually less than 5 minutes from failure detection to job restart
Note: This doesn’t include the time for Slurm to schedule your requeued job.
Will my job start immediately, or do I need to wait for cluster scheduling?
After AJR requeues your job:
The job enters Slurm’s normal scheduling queue
It must wait for resource availability like any other job
AJR may exclude problematic nodes, potentially affecting scheduling time
Priority and queue policies apply as normal
No special scheduling priority is given to requeued jobs
How do I know if my logs are in the right format?
Your logs are properly formatted if they include:
Job ID in filename:
{SLURM_JOB_NAME}_${SLURM_JOB_ID}_${DATETIME}.logTimestamps: All log entries have clear timestamps
Rank prefixes: Using
srun -ladds rank numbers to each lineRegular output: At least one log line every 2 minutes (prevents hang detection)
Throughput metrics: Periodic TFLOP measurements for straggler detection
Unified logging: Single output file (not per-rank files)
Test by running a short job and checking that your log file follows these patterns.
My job keeps getting requeued but never succeeds - what should I do?
If your job is stuck in a requeue loop:
Check for application bugs: Review your code for issues that cause consistent failures
Verify checkpointing: Ensure your application saves checkpoints successfully and can resume from them
Check resource requirements: Verify your job’s memory, GPU, and storage requirements are correct
Review log patterns: Look for recurring error messages in your logs
Contact support: If the issue persists, contact your system administrator with job details
Can I disable AJR for specific jobs?
Yes, simply omit the --comment='{"APS": ...}' directive from your batch script. Jobs without this directive will not be managed by ARJ and will behave like normal Slurm jobs.
How many times will ARJ attempt to restart my job?
The number of restart attempts depends on:
System limit: Set by administrators (typically in the dozens)
Job limit: Your
max_requeue_timesparameter if specifiedCheckpoint limit: Jobs that fail repeatedly without saving new checkpoints will be stopped earlier
The system uses the most restrictive of these limits.