Verifying#
This section describes the tools to verify system health.
Compute Tray Verification#
This section describes how to verify the health of each compute tray.
IMEX#
Verify that the system created the default IMEX Channel 0 on each compute node.
IMEX requires channel 0 for multinode workloads.
$ ll /dev/nvidia-caps-imex-channels/
total 0
drwxr-xr-x  2 root root     80 Feb 13 19:46 ./
drwxr-xr-x 21 root root   4640 Feb 14 11:43 ../
crw-rw-rw-  1 root root 234, 0 Feb 13 19:46 channel0
Read the IMEX Channels documentation for more information.
Linux Kernel#
Ensure the Linux kernel is at least 6.5.0-1024-nvidia-64k.
Use uname -r to view the current kernel version.
Tip
If you run your own kernel, ensure that the kernel version complies with the Grace patches published in the NVIDIA Grace Platform Support Software Patches and Configurations guide.
GPU Driver#
Verify that the system loaded the GPU driver correctly and all GPUs appear on each compute node.
Use the command nvidia-smi to view the status of the GPUs on a compute tray.
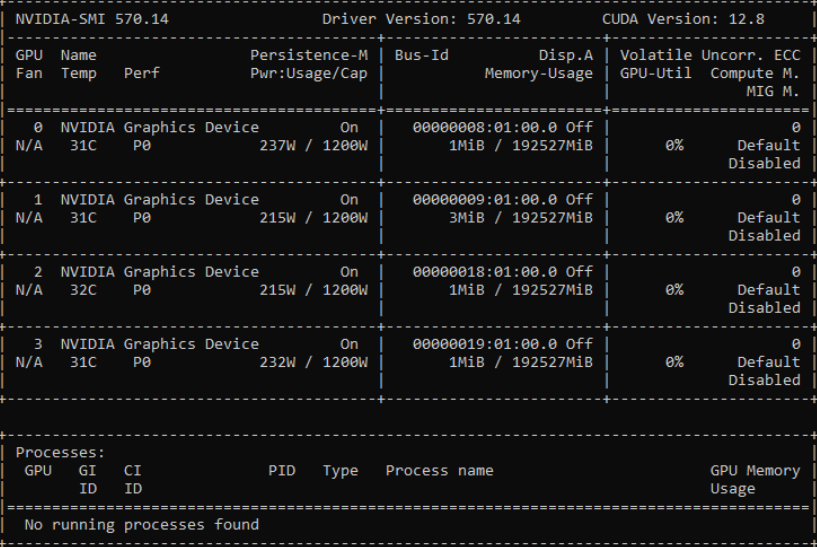
Figure 3 Example nvidia-smi output with four GPUs.#
Verify that each compute tray displays the platform information correctly.
View the GPU platform details with the command:
nvidia-smi -q | grep Platform -A 6
Figure 4 shows four GPUs connected to the NVLink network.
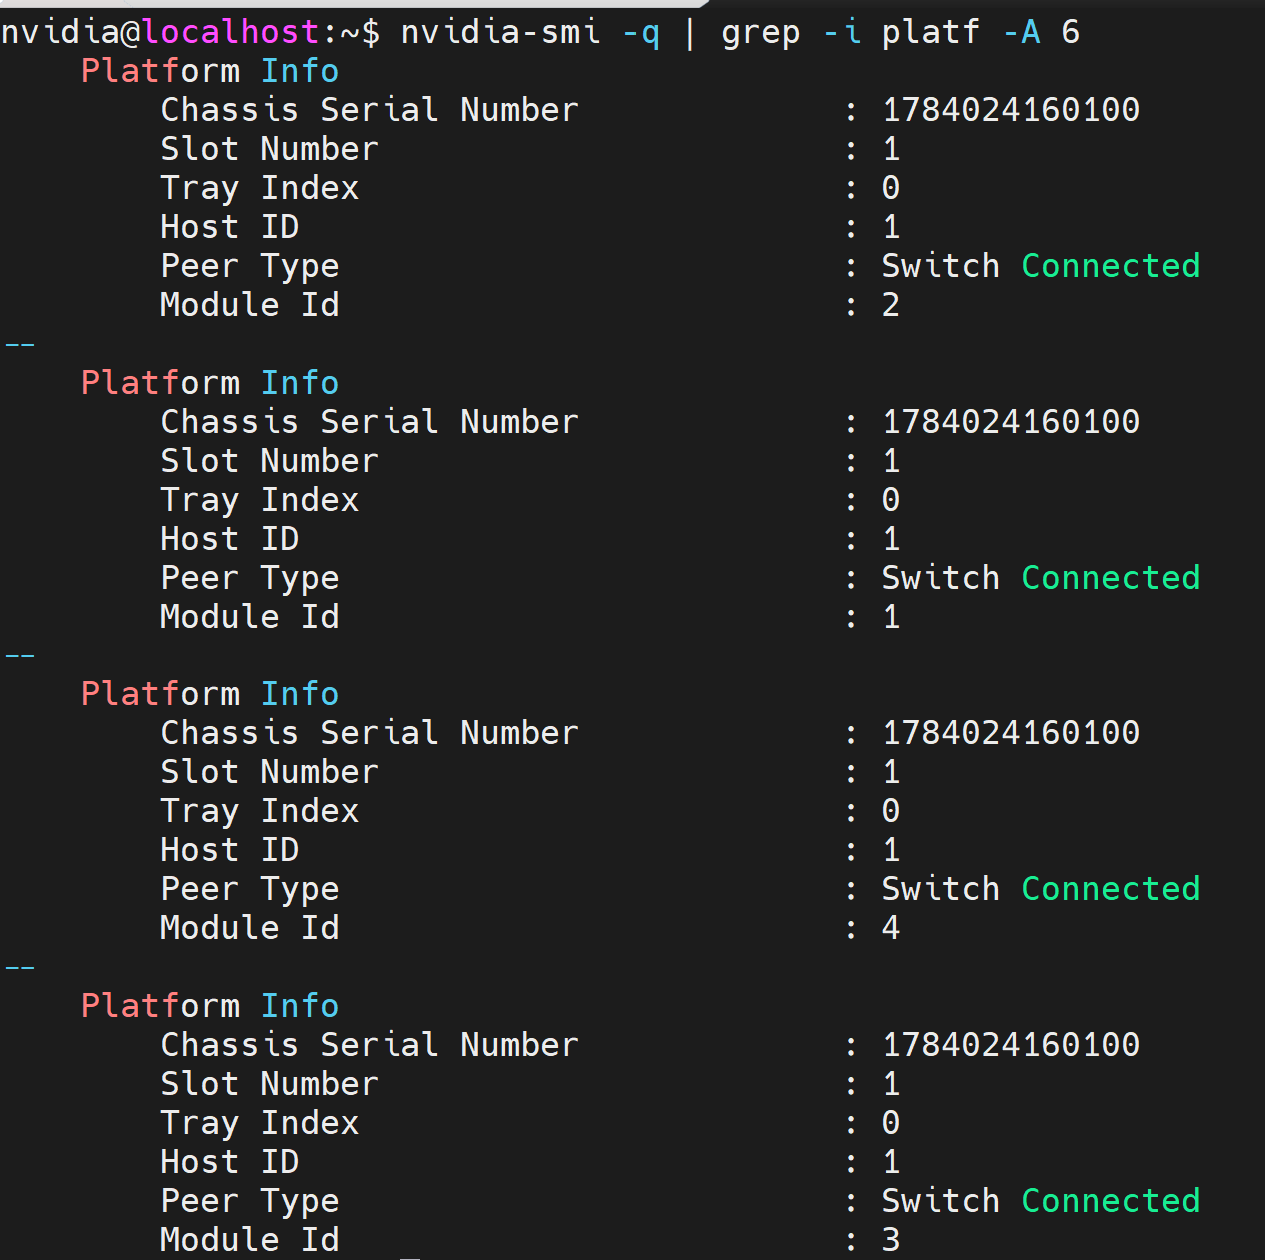
Figure 4 Example nvidia-smi -q output.#
Verify the GPUs successfully registered to the NVLink fabric with the command
nvidia-smi -q | grep 'Fabric' -A 4
Figure 5 shows an example output with the expected state of Completed and status of Success.
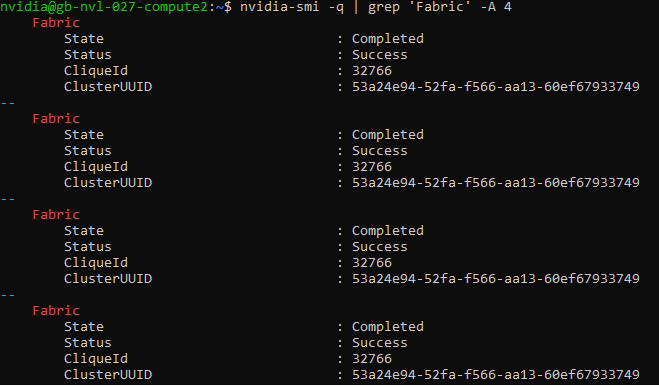
Figure 5 NVIDIA Fabric shows “Completed” and “Success”#
NVLink Status#
To ensure that the NVLink interfaces are operational and have the correct bandwidth, run the following command on each compute node:
nvidia-smi nvlink --status
Figure 6 is sample output 18 links active to the nine switch trays. Each link shows the expected 50 GB/s bandwidth.
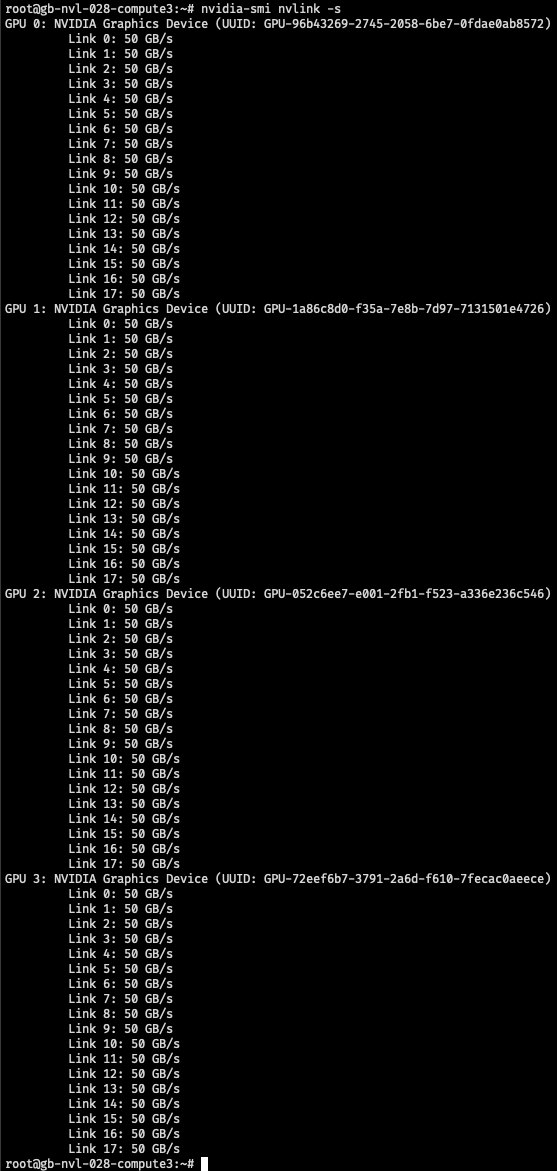
Figure 6 NVLinks between each GPU and the NVLink switches each at 50 GB/s#
If any of the links are <inactive>, the GPU driver can’t interact with other GPUs.
Important
All NVLinks must be up and reporting 50 GB/s bandwidth.
Links can be down because an switch tray is offline, problems with the physical link connections to that switch tray, high bit error rates on that link or the GPU driver isn’t running.
Topology Status#
Verify the local GPU topology with the command:
nvidia-smi topo -p2p n
Verify that all GPUs on the tray show OK.
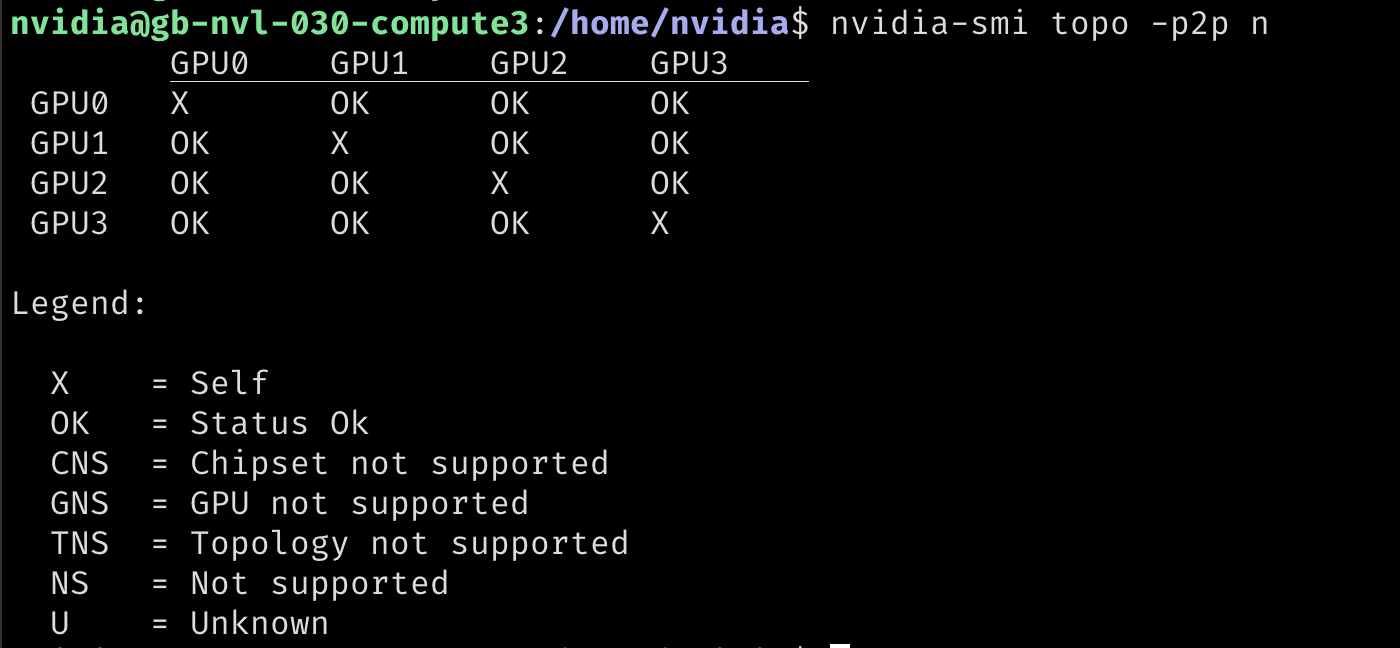
Figure 7 All GPU to GPU links are OK#
If a GPU isn’t OK, reset the specific GPU:
nvidia-smi -r -i <GPU_INDEX>
or reset all GPUs with:
nvidia-smi -r
NVIDIA Persistenced Service Status#
Verify each compute node has the nvidia-persistenced service running.
On every compute node run:
systemctl status nvidia-persistenced
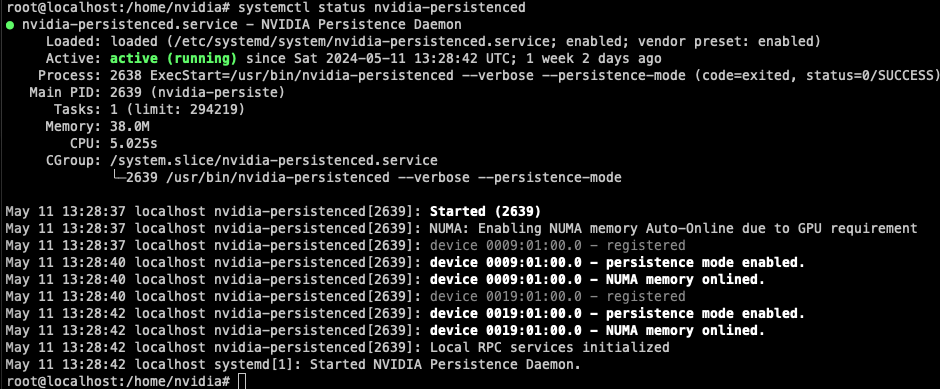
Figure 8 NVIDIA Persistenced service status#
NVIDIA IMEX Service Status#
Verify each compute node has the nvidia-imex service running.
On every compute node run:
systemctl status nvidia-imex
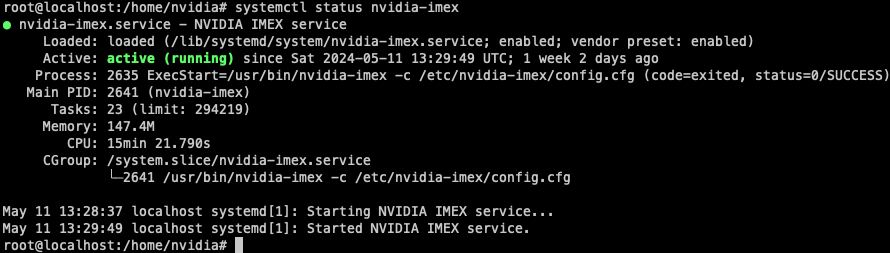
Figure 9 NVIDIA IMEX service status#
Also confirm every compute node runs the same version of the IMEX daemon.
$ /usr/bin/nvidia-imex --version
IMEX version is: 565.46
IMEX Domain Status#
Use the IMEX control tool to get the full status of the IMEX domain.
nvidia-imex-ctl -N
Figure 10 is an example of a working IMEX domain.
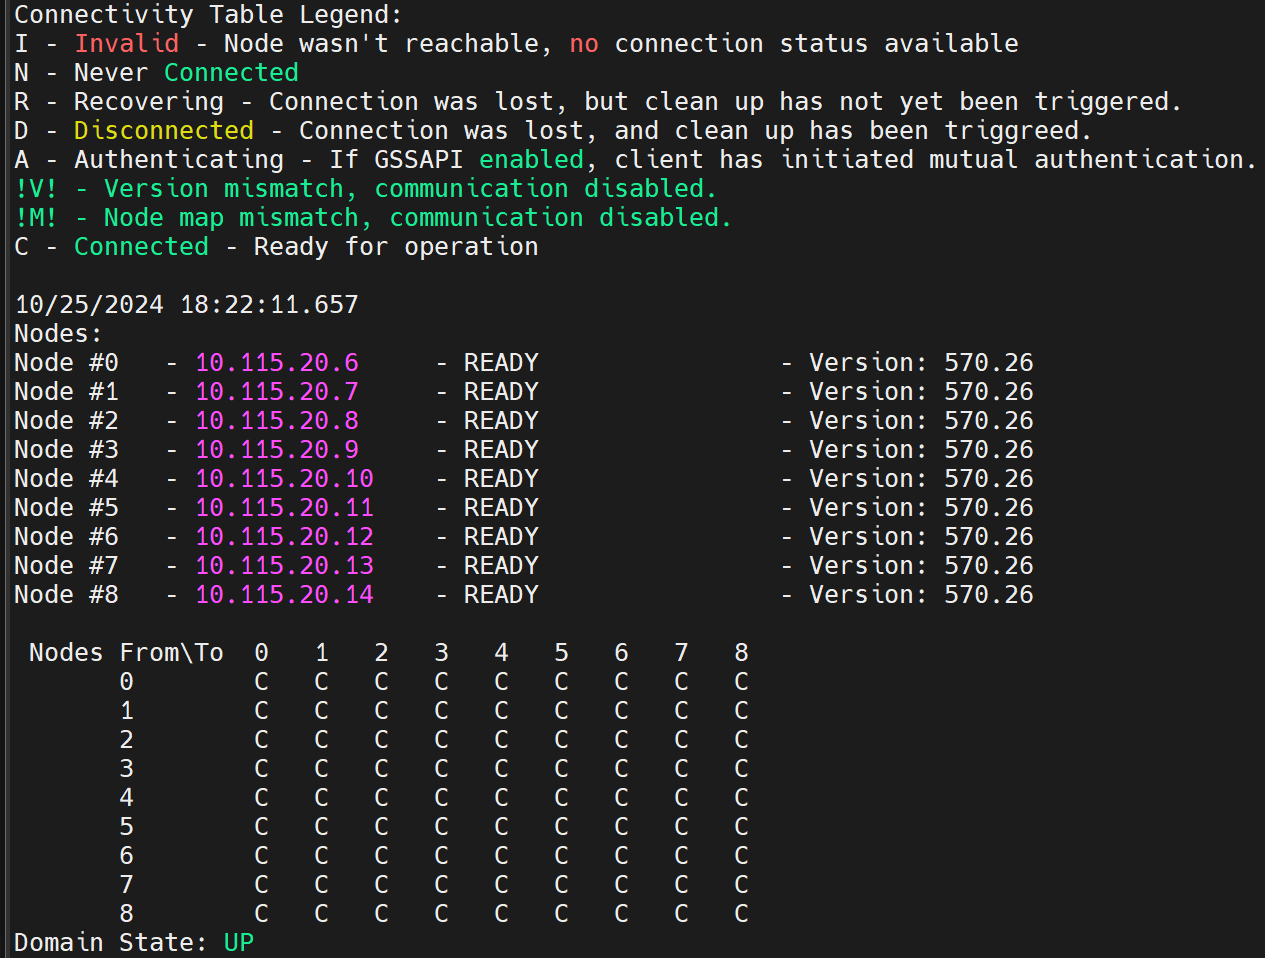
Figure 10 NVIDIA IMEX ctl command#
Tip
Refer to the NVIDIA IMEX User’s Guide for more information.
Switch Tray Verification#
This section describes health checks for the NVLink switch trays.
System Health#
Verify the health of each switch tray with the command nv show system health.
Control Plane Check#
Verify the NMX-C and NMX-T applications are running on the NVLink switch.
Important
NMX-C and NMX-T can only run on a single switch in an NVLink domain.
$ nv show cluster apps
Name            ID             Version
--------------  -------------  ----------------------
nmx-controller  nmx-c-nvos     0.8.0_2024-11-27_11-25
nmx-telemetry   nmx-telemetry  0.8.3
$ nv show cluster apps running
Name            Status  Reason  Additional Information
--------------  ------  ------  ------------------------------
nmx-controller  ok              CONTROL_PLANE_STATE_CONFIGURED
nmx-telemetry   ok
NMX-T Health Check#
Run the NMX-T health check to verify the NMX-T application.
curl http://0.0.0.0:9350/healthcheck
The normal response is
{"status":0,"message":"OK"}
Display the NMX-T statistics with the command:
curl http://0.0.0.0:9352/management/statistics
Display the NMX-T management status with the command:
curl http://0.0.0.0:9352/management/check_status