

Checking Your Customization Job Metrics
After completing a customization job, you can monitor its performance through training and validation metrics. You can access these metrics in three ways:
- Using the API
- Through MLflow (optional)
- Using Weights & Biases (optional)
The time to complete this tutorial is approximately 10 minutes.
Prerequisites
New to using NeMo Platform?
All platform resources—models, datasets, and more—must belong to a workspace. Workspaces provide organizational and authorization boundaries for your work. Within a workspace, you can optionally use projects to group related resources.
If you’re new to the platform, start with the Setup guide to learn how to deploy and evaluate models, and optimize agents using the platform end-to-end.
If you’re already familiar with workspaces and how to upload datasets to the platform, you can proceed directly with this tutorial.
For more information, see Workspaces and Projects.
Platform Setup Requirements and Environment Variables
Before starting, make sure you have:
- NeMo Platform installed and deployed (see Setup)
- The PyPI
nemo-platformwrapper package installed (pip install "nemo-platform[all]"). If you are working from a source checkout, runmake bootstrapfrom the repository root instead. - (Optional) Weights & Biases account and API key for enhanced visualization
Set up environment variables:
Initialize the SDK:
Tutorial-Specific Prerequisites
- Completed customization job with a valid job name
- (Optional) A job created with
spec.integrations.mlflowand access to its configured MLflow tracking server
Available Metrics
A customization job tracks every numeric metric its backend reports. The two you will always find are:
- Training Loss (
train_loss): recorded every step the training framework logs one - Validation Loss (
val_loss): recorded on every validation pass
Alongside those you will typically see train_lr (learning rate) and
train_grad_norm, plus whatever else the algorithm produces — a DPO job also
reports train_preference_loss and val_accuracy, for example.
An algorithm that scores validation on something other than a loss reports no
val_loss, and the series stays empty rather than filling with zeros.
How Metrics Are Named
Each metric is named <phase>_<metric>, where the phase is train or val and
the metric keeps whatever name the training framework gave it. A metric reported
during both training and validation therefore stays separate: DPO’s accuracy
becomes train_accuracy and val_accuracy rather than one interleaved series.
train_loss and val_loss are simply what this rule produces for a metric named
loss.
Where Metrics Appear
Each metric shows up in two places in a training task’s status_details:
- The latest value, as a top-level field under its full name (
train_loss,train_lr, …). Present only when the metric was actually reported, so a missing field means no value rather than a zero. - The full history, under
metrics, as a list of{step, epoch, value}points per metric. This is what the loss curves in the UI are drawn from.
Non-numeric values a framework emits alongside the scalars — histograms, tables, nested dictionaries — are not charted and do not appear in either place.
How Often Metrics Are Sent
Recording and sending are separate, and only the second is throttled.
Every value your training framework logs is recorded, at full resolution. What is limited is how often the accumulated set is sent to the platform, because each update carries the whole history and is written more than once server-side. Reports are buffered in memory and sent at most once every ten seconds by default; a buffered report loses nothing, since its points travel with the next one that goes. The final values are always sent when the job finishes.
The practical effect is that a chart may lag the run by a few seconds, and the curve you eventually read is complete.
Controlling Metric Detail
Two optional fields under schedule.progress_reporting change this. Most jobs
need neither.
min_report_interval_seconds(default10): the least time between updates reaching the platform. Raise it to spend less training time on reporting; lower it — or set0, which sends every logged step — for a progress bar that moves more often. Recording is unaffected either way.time_series_metrics: which metrics keep a history rather than only a latest value. Names are the full ones you read back, so they carry the phase prefix, and glob patterns are accepted:["*_loss", "*_lr"]. Omit the field to take your backend’s default, which keeps the loss, learning rate and gradient norm. Use["*"]to keep a history of everything the backend reports.
A metric left out of time_series_metrics is still reported as a latest value
on every update — only its history is dropped. That keeps throughput counters
like train_tps costing one number instead of several hundred points.
Set them in the schedule block when you create the job:
These control what the platform stores. They are unrelated to the training
framework’s own logging cadence — Unsloth’s schedule.logging_steps, for
example — which decides how often your framework produces a value in the first
place, and drives its stdout and any W&B or MLflow run.
Viewing Your Metrics
Using the API
Get job status and training metrics through the platform Jobs service:
To read the curves rather than the latest values, use the metrics payload. It
carries every metric the job reported, so iterating it picks up backend-specific
ones without naming them in advance:
Using MLflow
If your customization job was created with an integrations.mlflow configuration (see MLflow Integration):
- Access the MLflow UI at the configured
tracking_uri - Locate the configured
experiment_name(defaults to the output model name) - Find the configured run
name(defaults to the customization job ID) - View detailed metrics, including training and validation loss curves, under the “Metrics” tab
MLflow tracking is requested per job through spec.integrations.mlflow; it is not automatically enabled for every job in a cluster. The tracking server can be selected with tracking_uri in the job spec or the platform-side MLFLOW_TRACKING_URI environment variable. Contact your administrator if you need access to that server.
Using Weights & Biases
If your customization job was created with W&B integration enabled (see Weights & Biases Integration):
- Go to wandb.ai and navigate to your project
- Find the run corresponding to your customization job
- View training and validation loss curves, learning rate schedules, and other metrics under the run’s dashboard
The api_key_secret field references a stored secret containing your WANDB_API_KEY.
Use the secret name (e.g., "my-wandb-key") to resolve it from the request workspace.
To create the secret, see Weights & Biases Keys.
Then view your results at wandb.ai under your project.
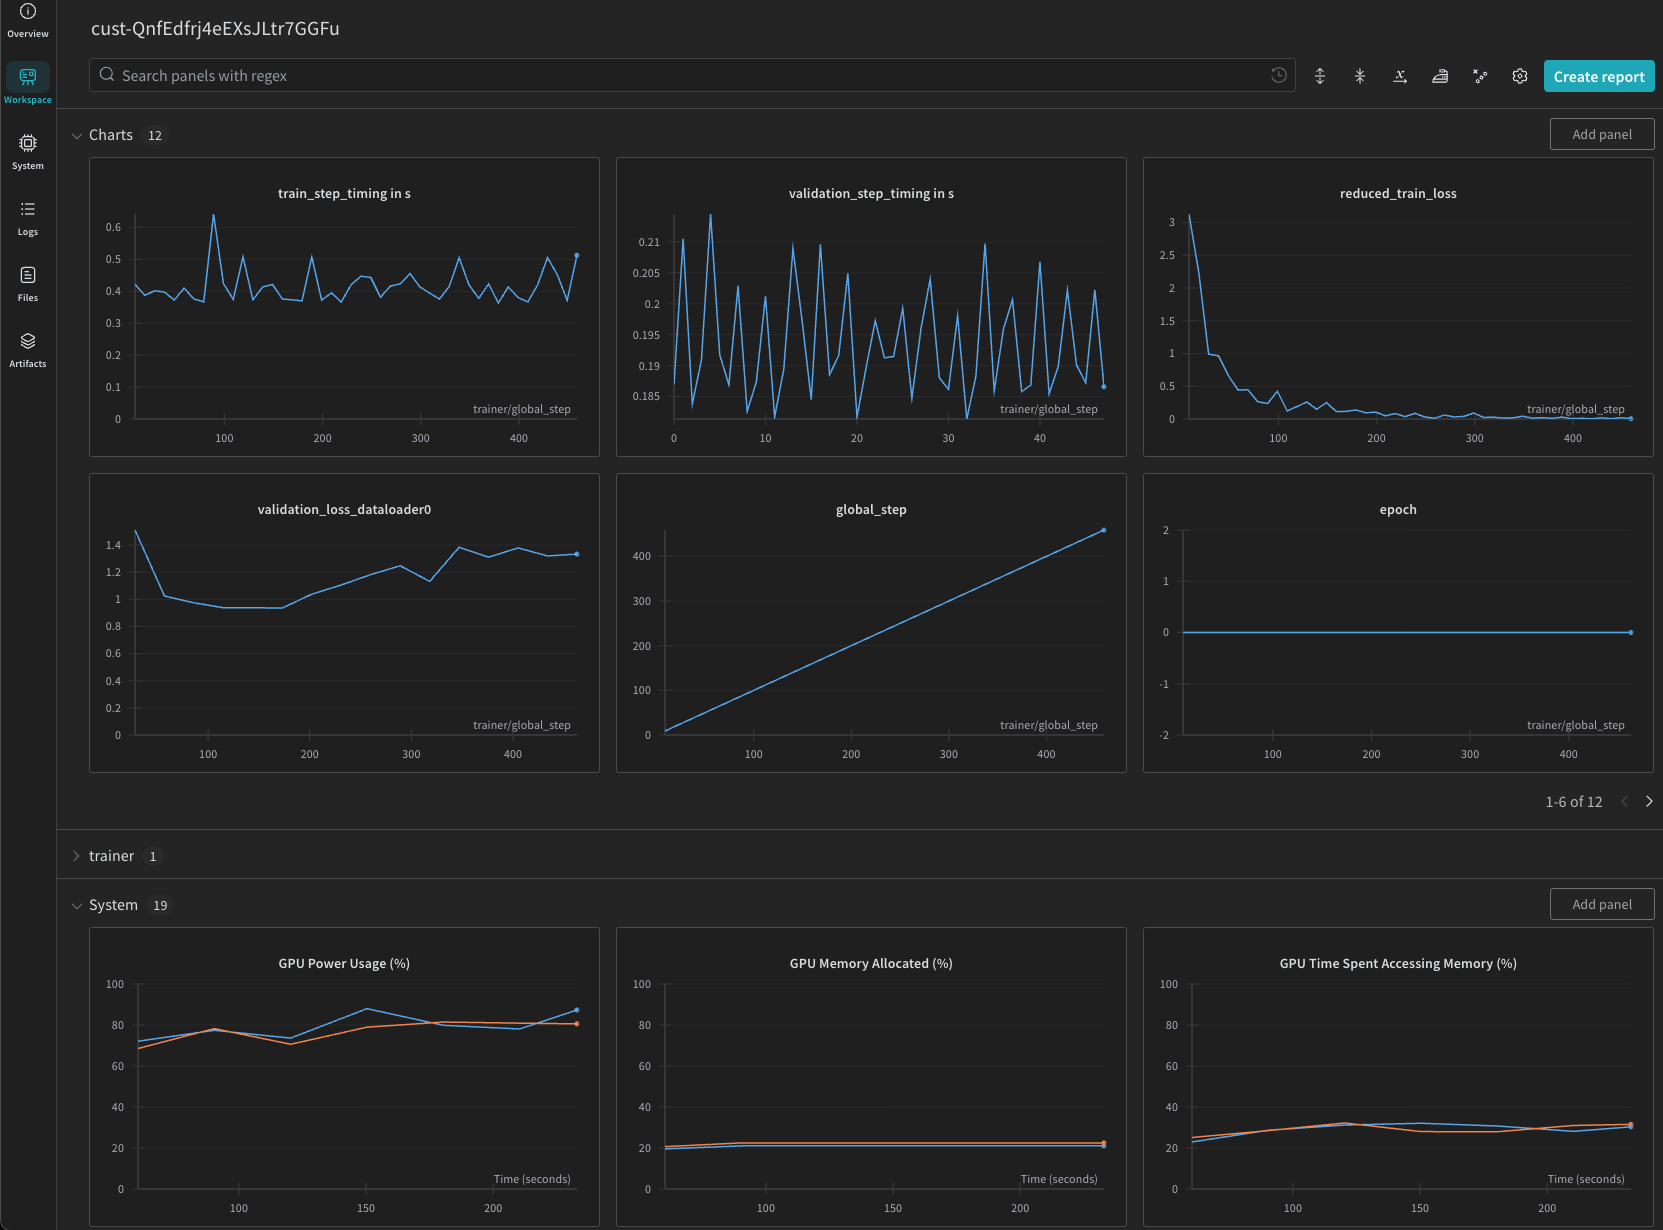
The W&B integration is optional and must be configured when creating the customization job. When enabled, training metrics are sent to W&B using your API key. While we encrypt your API key and don’t log it internally, please review W&B’s terms of service before use.