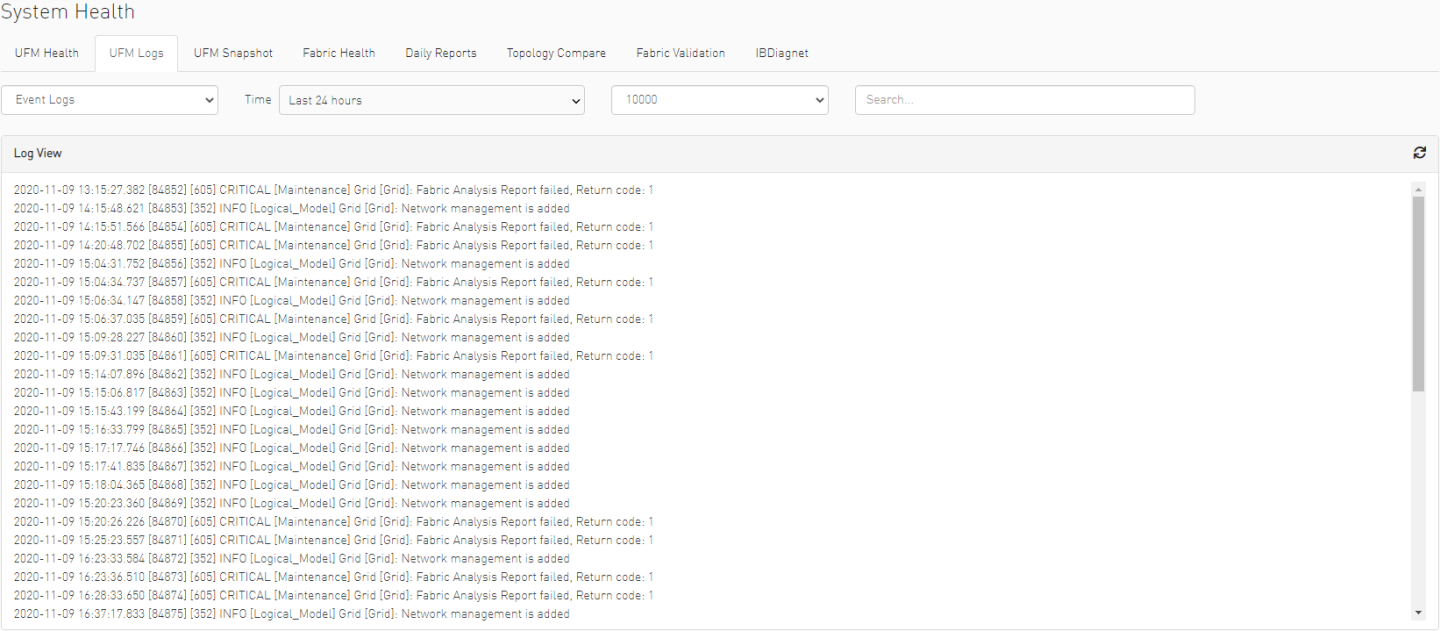
UFM Logs Tab
UFM logging records events and actions that can serve to identify fabric and UFM server issues and assist in troubleshooting.
The logs are categorized into three files according to the activities they record: Event logs, SM logs, and UFM logs.
To view the log files, select the desired log file from the drop-down menu. Log data will be displayed:

In the Logs window, you can do the following:
Refresh the data using the Refresh button on the right-hand side of the screen
Search for a specific value using the Search bar
Limit the display to a specific time period using the Time drop-down menu
Limit the display to a specific number of lines using the drop-down menu (use "All" option to display all lines)
Control the display of log occurrences by either showing all lines or hiding the duplicated ones.
Event Logs show the history of fabric events detected and initiated by the UFM server. The timestamp and severity of an event is indicated as well as the cause of the event and additional relevant information. The Event log is kept on the UFM server in the /opt/ufm/log/events.log file. Events can be configured whether to appear in the log files under the Events Policy tab in the Settings window. For more information, see Events Policy.
See "Appendix - Supported Port Counters and Events" for a comprehensive list of Events.
SM Logs show messages of the Subnet Manager and communication plug-in.
The log verbosity is defined by selecting the Log Levels in the Subnet Manager tab under Settings window. For more information, see Subnet Manager Tab.
UFM Logs is a general log of UFM Server. The log saves a history of user actions, events, polling results and other server activities and errors. Log verbosity is defined on start-up in the configuration file /opt/ufm/conf/gv.cfg:
            [Logging]
# optional logging levels
#CRITICAL, ERROR, WARNING, INFO, DEBUG
level = WARNING
The default verbosity level is WARNING.