IB Link Resiliency Plugin
The primary objective of the IB Link Resiliency (IBLR) plugin is to enhance cluster availability and improve the rate of job completion.
This objective is accomplished by combining different mechanisms, both ML-based and rule-based, for identifying problematic links. Then, the plugin autonomously applies corrective measures to these links with the aim of restoring their normal function.
For cluster topologies where no redundancy exists at the level of access links, the plugin will only execute a mitigation procedure for trunk links.
The IBLR plugin execution cycle is composed of the following tasks:
Collects telemetry data from the UFM secondary telemetry service, which by default collects telemetry data every 5 minutes.
Employs ML-based prediction models and rule-based detection logic to alert on problematic ports.
Based on the alerts issued by the different alert engines, determines which measures should be taken:
Which links are underperforming and should be isolated from the fabric.
Which isolated links have recovered following the mitigation process, and hence should be reinstated to the fabric.
Applies the required actions through the UFM and reports to the UFM events table.
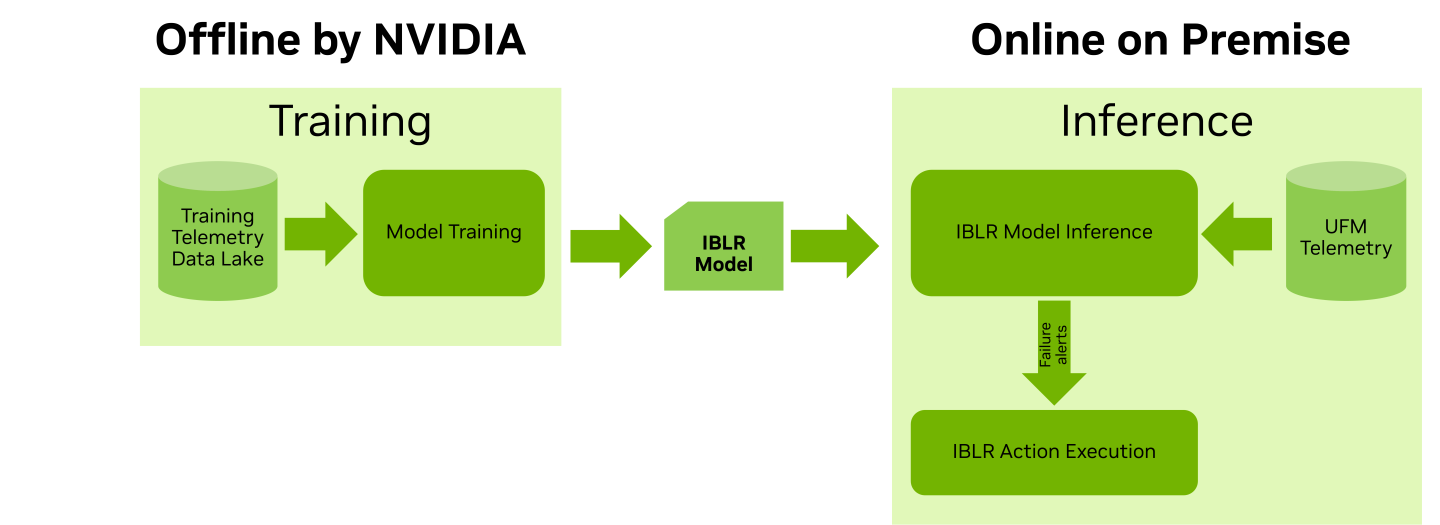
Schematic Flow: External View

Schematic Flow: Internal View

The plugin collects its telemetry data from the secondary telemetry endpoint, a low-frequency UFM Telemetry service which collects a large set of counters. Secondary telemetry is enabled by default, and in case it is being de-activated by the user, the plugin will not be able to operate.
In addition to telemetry data, the plugin periodically reads from the UFM the cluster topology information in order to align its internal logic with any changes that has taken place in the cluster.
Main Collected Counters
Name | Description |
| FEC histogram counters. Counter hist{i} is incremented by one every time a FEC block is arrives with i bit errors. |
| Number of FEC blocks that could not be corrected (8 or more errors for FEC8 algorithm). |
| Number of symbols dropped due to errors. |
| Number of data blocks dropped due to errors. |
| Number of received data blocks. |
| Module temperature. |
| Module voltage. |
| Number of times the link was down. |
The alert generation block is composed of four independent engines, each employing either ML-based or rule-based logic in order to identify problematic links:
Failure prediction
Failure detection
Link flaps detection
Operating conditions violation
Per each alert engine, each port can be configured to operate in one of two modes:
Shadow mode: the plugin will not act upon this link based on alerts from this engine.
Active mode: the plugin is allowed to automatically execute mitigation steps upon this link in case an alert was raised from this engine.
Alert Engine Operation Mode Configurations
Name | Type | Values | Default Value | Description |
| str | shadow, active | shadow | This configuration assigns the default operation mode for the respective alert engine. |
| List[str] | List of port identifiers (node guid and port number) | empty | Ports included in the exception list are operating in the mode opposite to that indicated in the This enables to define a subset of the ports that will operate differently from the remainder of the cluster. |
Failure Prediction
The port failure prediction logic is based on a binary classification ML model, trained to predict ahead of time cases where physical layer issues will eventually result in data loss.
The model relies mainly on the error histogram counters of the Forward Error Correction (FEC) block.
The model was validated to provide valuable predictions on both HDR and NDR generation clusters.
Failure Prediction Configurations
Name | Type | Values | Default Value | Description |
| float | (0, 1) | 0.8 | The decision threshold of the binary classification model. If the model's output probability exceeds this threshold an alert is triggered. The recommended value range is 0.65-0.8, with lower values favoring high recall and higher values favoring high precision. |
Failure Detection
The failure detection module is comprised of two distinct rules, aimed at detecting based on post-FEC errors when a link is not meeting the desired performance specifications:
Packet drop rate: calculates the rate of dropped packets (local and remote errors) vs. successfully received packets.
Symbol errors: calculates the rate of symbol errors during two different time intervals (12 minutes and 125 minutes). If the threshold is exceeded for either interval, the rule triggers the failure detection alert.
This rule is only supported in NDR clusters, and is ignored in HDR clusters.
In case either of the rules exceeds its respective threshold, a failure detection alert will be raised.
Failure Detection Configurations
Name | Type | Default Value | Description |
| bool | True | Flag indicating whether the packet drop rate rule is enabled. If disabled, alerts will not be generated based on this rule. |
| bool | True | Flag indicating whether the symbol errors rule is enabled. If disabled, alerts will not be generated based on this rule. |
| float | 1e-12 | The threshold for the packet drop rate rule. |
| float | 2.88 | The threshold for the symbol errors rule, 12 minutes interval. |
| float | 3 | The threshold for the symbol errors rule, 125 minutes interval. |
Link Flaps Detection
A heuristic for detection of link flap events is being utilized. This rule defines a link flap as a scenario where link down occurred on both ends of the link more times than defined by the link flap threshold.
By setting the right threshold, this rule is meant to capture unintentional link flaps, and filter out links that were intentionally reset or sufferred from a rare link down event.
Link Flaps Detection Configurations
Name | Type | Default Value | Description |
| int | 15 | The minimal number of link down events considered a link flap, for switch-switch links. |
| int | 15 | The minimal number of link down events considered a link flap, for host-switch links. |
Operating Conditions Violation
A module aimed at validating that the ports are within their nominal operating conditions. Configurable lower and upper thresholds are used to indicate whether the voltage and temperature of the port are exceeding the desired range.
Operating Conditions Violation Configurations
Name | Type | Default Value | Description |
| int | 70 | The temperature upper threshold value, in °C. |
| int | -10 | The temperature lower threshold value, in °C. |
| int | 3500 | The voltage upper threshold value, in mV. |
| int | 3100 | The voltage lower threshold value, in mV. |
The action execution block processes inputs from the alert generation module, the UFM and the internal port state table in order to determine which links should undergo isolation or de-isolation.
Then, it executes the actions via a UFM API, and finally it updates both on the actions that were and were not taken via messages to the UFM events table.
Action Execution Flow
The action execution flow is comprised of 6 main modules (below image, right side), which can be aggregated into three main steps:
Update of the internal port state DB, based on data collected from the alert generation module and from the UFM.
Based on the ports' state as captured by the port state DB, run two decision processes to determine which links should be isolated and which should be de-isolated.
Apply the neccessary actions through the UFM.
Once a link is selected for action, it enters a mitigation cycle as outlined below.
Isolation and de-isolation of links is done via updating the UFM Unhealthy Ports file. This file is submitted by the UFM to the SM, triggering the update of the routing tables throughout the fabric.
Notably, even while the link is isolated and no application traffic flows through it, the physical layer remains active hence we are able to keep monitoring the state of the link using the same aforementioned alert engines.
This enables the the decision process to determine if the link has successfully recovered following the mitigation procedure, and if so reinstate it back into the network.

Link State Transition Diagram
The below diagram depicts the link state mahcine managed by the IBLR plugin.
Application traffic will flow through the link only if it is in Healthy state. In all other states, the link is isolated and traffic is redirected to other parallel links.
The black arrows in the diagram indicate state transitions triggered by the plugin, while the red dotted arrows indicate state transitions triggered outside the plugin (e.g. by the user).
While the main flow of isolating a problematic link, waiting for it to recover and reinstating it is fully operated by the plugin, there are two additional flows that require user intervention:
If a link that was isolated by the plugin has not recovered within a pre-determined period, it will be moved into the unrecoverable state.
This comes to suggest that the network operator should inspect the link, attempt to recover it, and if successfull de-isolate the link to signal the link was maintained.
If a link was isolated outside the scope of the plugin, the plugin will not de-isolate the link automatically as it has insufficient knowledge with repect to the isolation reason.
In that case, de-isolation should also be handled by the user or external system that isolated the link.

Action Execution Checkpoints
The action execution decison process includes a set of configurable checkpoints, that provide the user the ability to determine under what conditions actions will be taken.
These configurable checkpoints can be broadly divided into the following groups:
Isolation and de-isolation rate limit constraints.
Topology-dependent constraints that prevent isolations in case this will lead to insufficient redundancy in the fabric.
Isolated links' time limits to qualifying for de-isolation or be considered unrecoverable.
The below tables describe the main configuration parameters used by the decision process checkpoints.
Isolation Checkpoints Configurations
Name | Type | Description |
| int | The maximum number of distinct links allowed to be isolated within a specific time window. |
| int | The minimum number of healthy links between two switches, when reached no further isolations will be allowed. |
| int | The minimum number of active ports per switch, when reached no further isolations will be allowed. |
De-isolation Checkpoints Configurations
Name | Type | Description |
| int | The maximum number of distinct links allowed to be de-isolated within an hour. |
| int | The minimum period in minutes that a link has to be clean of alerts in order to be qualified for de-isolation. |
| int | The maximum period in hours that a link is granted for recovery and de-isolation, before declaring it as unrecoverable. |
Reporting
Customers may be looking to extend or replace the plugin's mitigation procedure with their private business logic.
For that purpose, the action execution module reports both on actions it has taken, as well as on actions it has not taken due to the decision process failing at one of the checkpoints.
Reporting is done via sending event-specific messages to the UFM events table.
Event Messages: Indication of Action
Event | Message Format | Comments |
Isolation |
| |
De-isolation |
| Isolation reasons are the alerts that triggered the initial isolation |
Declaring unrecoverable port |
| Threshold is configurable, the plugin will not deisolate unrecoverable ports |
Event Messages: Indication of Action Not Taken
Event | Message Format | Comments |
Total alerts count exceeding alert threshold per iteration |
| Threshold is configurable |
Access link alert |
| |
Shadow mode preventing isolation |
| |
Shadow mode preventing de-isolation |
| Only if mode changed from active to shadow while port is isolated |
Exceeding isolation count per time |
| Time frame is in (hour, day, week, month), each has a configurable threshold |
Exceeding de-isolation count per time |
| Time frame is hour, threshold is configurable |
Insufficient redundancy in the connectivity between the switches |
| Threshold is configurable |
Insufficient number of active ports in the switch |
| Threshold is configurable, validated for the two switches which the link connects |
The IB Link Resiliency plugin can be deployed using the following methods:
On the UFM Appliance
On the UFM Software
To deploy the plugin, follow these steps:
Download the ufm-plugin-ib-link-resiliency-image from DockerHub.
Load the downloaded image onto the UFM server. This can be done either by using the UFM GUI by navigating to the
Settings -> Plugins Managementtab or by loading the image via the following instructions:Log in to the UFM server terminal.
Run:
docker load -i <path_to_image>
After successfully loading the plugin image, the plugin should become visible within the plugins management table within the UFM GUI. To initiate the plugin’s execution, simply right-click on the respective line in the table.

The supported InfiniBand hardware technologies are HDR and NDR.
After the successful deployment of the plugin, a new item is shown in the UFM side menu for the IB Link Resiliency plugin:

Current State
This page displays the Current State table presenting the cluster status, outlining the following counts:
Number of ports.
Number of isolated ports.
Number of ports operating in active/shadow mode, per each of the alert engines.
Number of predicted failures, reflecting ports which were recently flagged by the ML model as having a high probability of failure.

The Port Level Status table is displayed below and shows the status of the cluster ports, as stored in the port state DB.

The user can filter the Port Level Status table by clicking on any value in the Current State table.
For example, if the user clicks on the number of isolated switch-to-switch ports, the Port Level Status table will display only the isolated switch-to-switch ports.

Configuration
This page displays a subset of the aforementioned IBLR configuration parameters.
Below are representative screenshots showing some of the configuration parameters accessible through the UI:
Action execution configurations:

Failure prediction operating mode configurations:
