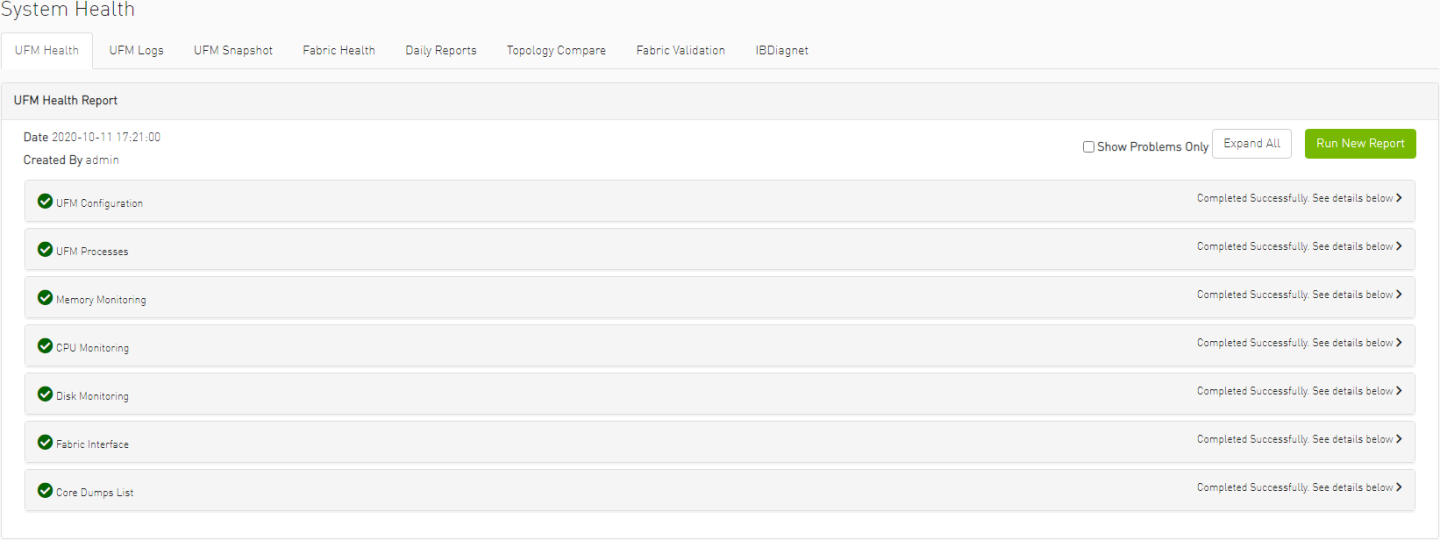
UFM Health Tab
Through UFM Health tab, you can create reports that run a series of checks on the UFM server.
Each check that is run for a report triggers a corresponding event. Events are also triggered when a report starts and ends. For more information, see Events & Alarms.
To run a new report, click “Run New Report”. Results will be displayed inline automatically.

You can expand the results of each check or expand the results of all checks at once by clicking the "Expand All" button.
To view only the errors of the report results, click the "Show Problems Only" checkbox.
The following tables describe the checks included in the report.
UFM Health Report Checks
|
UFM Configuration |
|
|
Check |
Description |
|
Release Number |
UFM software version and build. |
|
License Type |
Type of license, permanent or evaluation. |
|
License Customer Number |
The customer number provided by NVIDIA. |
|
License UID |
The UFM serial number provided by NVIDIA. |
|
License Expiration Date |
License expiration date for limited licenses. |
|
License Functionality |
Level of functionality enabled for the end-user, standard or advanced. |
|
License Devices Limit |
The maximum number of devices that UFM is licensed to manage. Note that it displays the current active and valid UFM licenses (not the sum of all valid licenses devices) |
|
Running Mode |
UFM running mode, Standalone or High Availability (HA). When UFM is in HA mode, additional information is displayed for the master and standby servers. |
|
UFM Processing |
|
|
Check |
Description |
|
OpenSM |
Status of the OpenSM service. |
|
ibpm |
Status of the ibpm (Performance Manager) service. |
|
ModelMain |
Status of the main UFM service. |
|
httpd |
Status of the httpd service. |
|
MySql |
Status of the MySql service. |
|
Memory Monitoring |
|
|
Check |
Description |
|
Total memory usage |
Percentage of total memory usage. |
|
UFM memory usage |
Percentage of UFM memory usage |
|
CPU Monitoring |
|
|
Check |
Description |
|
Total CPU Capacity |
Percentage of CPU capacity available |
|
CPUs Number |
Number of CPUs |
|
Total CPU utilization |
Percentage of total CPU utilization. |
|
UFM CPU utilization |
Percentage of UFM CPU utilization. |
|
Disk Monitoring |
|
|
Check |
Description |
|
Disk <diskname> |
Percentage of disk usage. |
|
Fabric Interface |
|
|
Check |
Description |
|
Fabric Interface |
Name and state of fabric interface. |