Fabric Health Tab
Through Fabric Health tab, you can create reports that run a series of checks on the fabric.
Each check that is run for a report triggers a corresponding event. Events are also triggered when a report starts and ends. For more information, see Events & Alarms.

To run a new report, do the following:
Click “Run New Report."

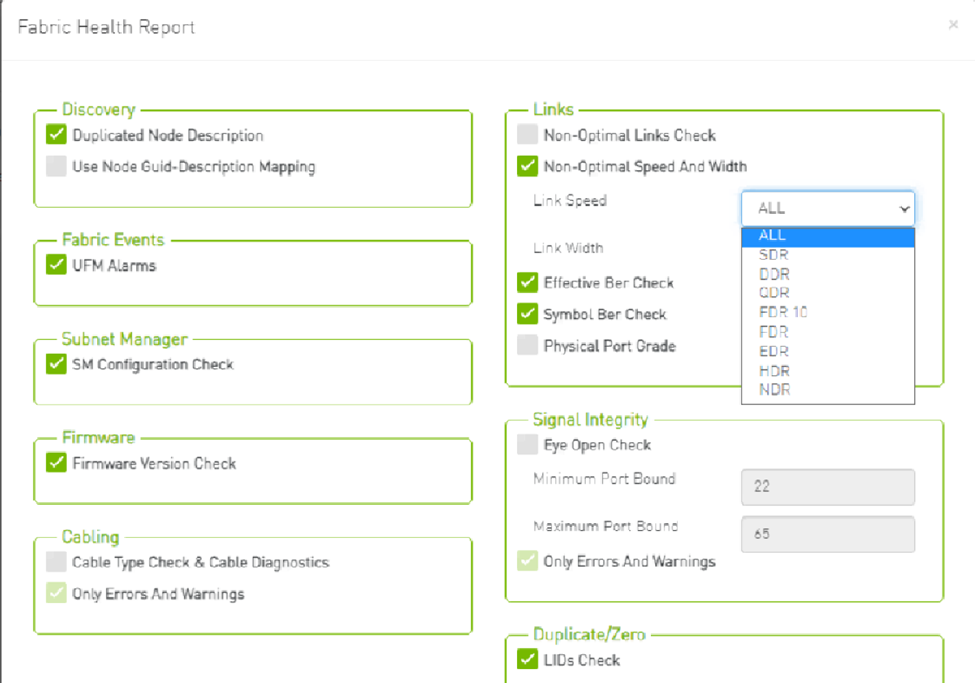
Select the desired fabric health checks to run in the Fabric Health Report window and click “Run Report."

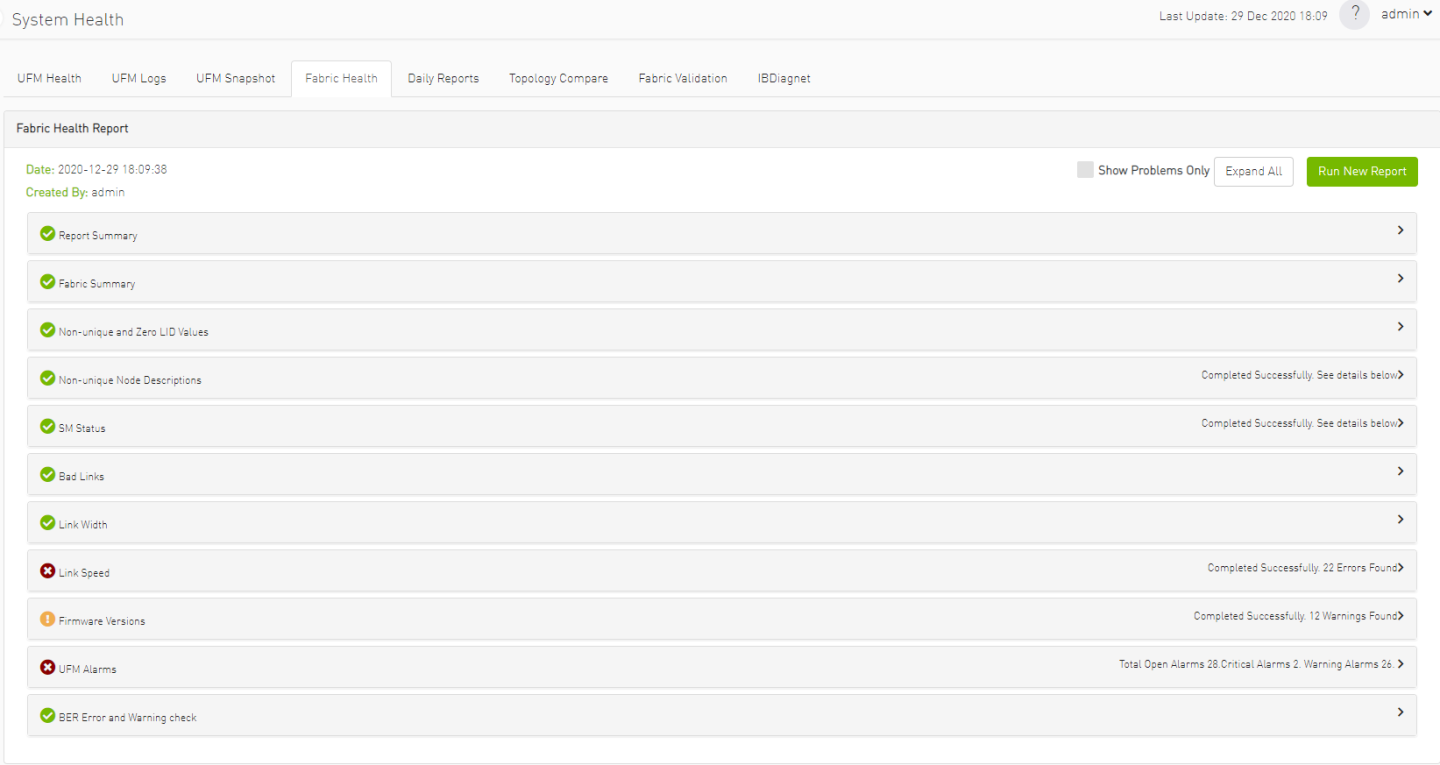
Results will be displayed automatically:

The report displays, the following:
A report summary table of the errors and warnings generated by the report.
A fabric summary of the devices and ports in the fabric.
Details of the results of each check run by the report.
You can expand the view of each check or expand the view of all checks at once by clicking “Expand All."
To view only the errors of the report results, click the "Show Problems Only" checkbox.

The following table describes the checks included in the report.
Fabric Health Report Checks
|
Check |
Description |
To run, select: |
|
Duplicate/Zero LID Check |
Lists all ports with same LID or zero LID value. |
LIDs Check Default: Selected |
|
Duplicated Node Description |
Lists all nodes with same node description. Does not include switches with the same description. |
Duplicated Node Description Default: Selected |
|
Use Node GUID-Description Mapping |
Enables the usage of a mapping file (between node GUID and node description) when running duplicate node description analysis of the fabric. This file is located on the UFM server side at: conf/sm_guid_desc_mapping.cfg, and uses the following format (node_guid → description): 0x248a070300702710 "Desc1" 0x248a0703007026f0 "Desc2" 0x0002c90300494100 "Desc3" |
Use Node GUID-Description Mapping Default: Unchecked Note: In order for this checkbox to be available, the Duplicated Node Description checkbox should also be selected. Otherwise, this checkbox will be greyed-out. |
|
SM Check |
Checks that:
The report lists all SMs in the fabric with their attributes. |
SM Configuration Check Default: Selected |
|
Bad Links Check |
Performs a full-fabric discovery and reports “non-responsive” ports with their path. |
Non-Optimal Links Check Default: Selected |
|
Link Width |
Checks if link width is optimally used.
|
None-Optimal Speed and Width Default: Selected Link Width: The default is ALL. |
|
Link Speed |
Checks if link speed is optimally used.
|
None-Optimal Speed and Width Default: Selected Link Speed: The default is ALL. |
|
Effective Ber Check |
Provides a BER test for each port, calculates BER for each port and check no BER value has exceeded the BER thresholds. In the results, this section will display all ports that has exceeded the BER thresholds. Note that there are two levels of threshold: Warning threshold (default=1e-13) and Error threshold (default=1e-8). |
Effective Ber Check Default: Selected |
|
Effective Port Grade |
Provides a grade per port lane in the fabric, which indicates the current port lane quality. |
Physical Port Grade Default: Not Selected |
|
Firmware Check |
Checks for firmware inconsistencies. For each device model in the fabric, the test finds the latest installed version of the firmware and reports devices with older versions. |
Firmware Version Check Default: Selected |
|
Eye Open Check |
(For QDR only) Lists Eye-Opener information for each link. When minimum and maximum port bounds are specified, the report lists the links with eye size outside of the specified bounds. |
Eye Open Check Default: Selected Minimum and Maximum port bound: By default no bounds are defined. |
|
Cable Information |
Reports cable information as stored in EPROM on each port: cable vendor, type, length and serial number. |
Cable Type Check & Cable Diagnostics Default: NOT selected because this test might take a long time to complete (40 msec per port) |
|
UFM Alarms |
Lists all open alarms in UFM. |
UFM Alarms Default: Selected |