UFM Telemetry Manager (UTM) Plugin
Managed telemetry is a mode of high availability and improved performance of UFM Telemetry processes.
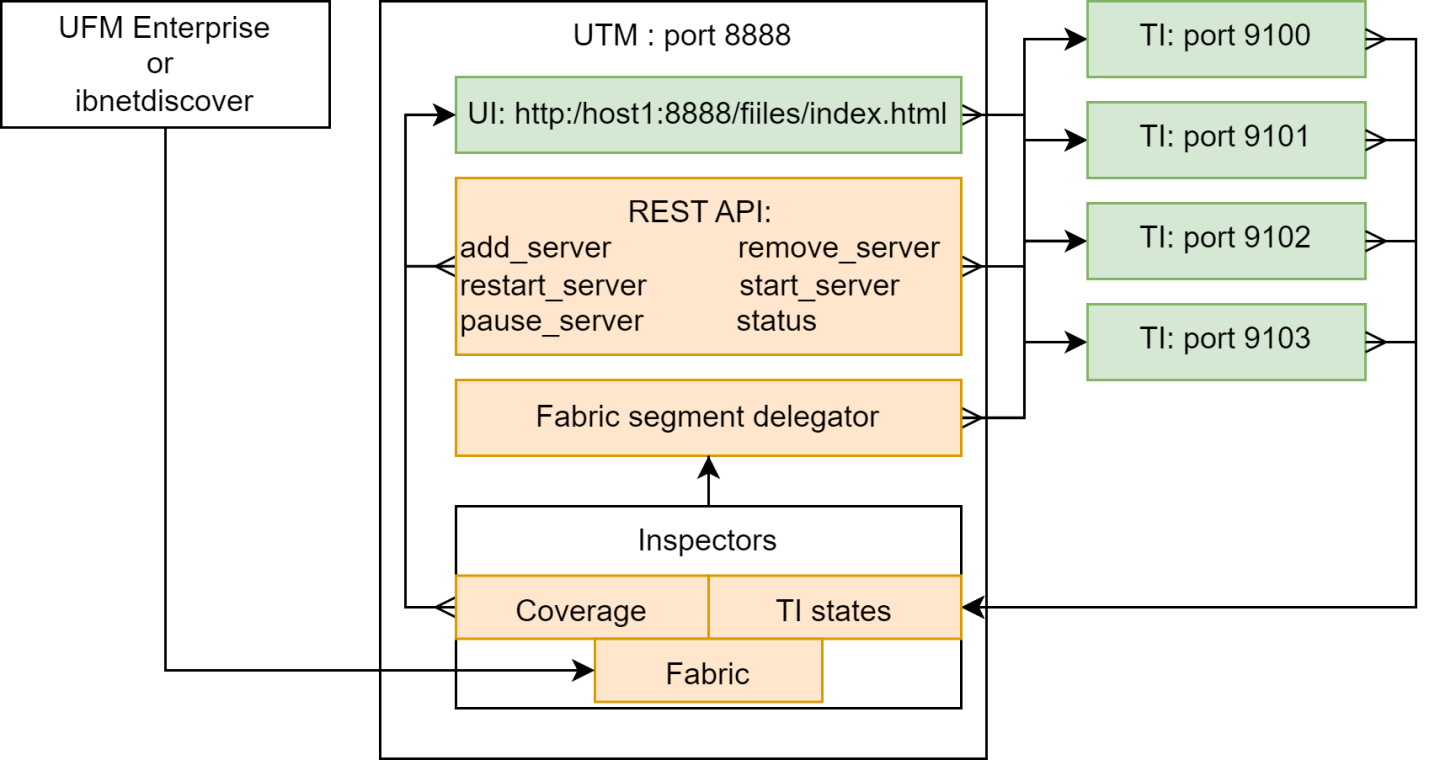
Governed by UFM Telemetry Manager (UTM) several UFM Telemetry Instances (TIs) run on one or more machines, each collecting a subset of the cluster fabric.
UTM manages the following aspects:
monitoring of TI states: down, initializing, running, paused
TI management commands: add, remove, pause, start, restart
partitioning of fabric based on TIs health and fabric changes
assigning fabric segments to TIs
telemetry coverage check of a cluster
The UFM Telemetry Manager (UTM) Plugin facilitates managed telemetry in high availability mode, enhancing the performance of UFM Telemetry operations.
Under the governance of UFM Telemetry Manager (UTM), multiple UFM Telemetry Instances (TIs) are executed on one or more machines, with each TI responsible for collecting a specific portion of the cluster fabric.
Key functionalities managed by UTM include:
Monitoring TI statuses: down, initializing, running, paused
Execution of TI management commands: add, remove, pause, start, restart
Fabric partitioning based on TI health and fabric changes
Assigning fabric segments to TIs
Verification of telemetry coverage across the cluster

As a first step, get the UTM image:
Get UTM image
docker pull mellanox/ufm-plugin-utm
The UTM plugin is designed to operate either as a UFM plugin or independently or in standalone mode.
In both setups, it is advisable to utilize UTM deployment scripts. These scripts streamline the process by enabling the deployment or cleanup of the entire setup with just a single command. This includes UTM, host TIs, and preparation of the Switch Telemetry image.
UTM Deployment Scripts
Get deployment scripts and examples by mounting the local folder UTM_DEPLOYMENT_SCRIPTS (/tmp/utm_deployment_scripts in this example) and running get_deployment_scripts.sh :
Get UTM deployment scripts
            $ export UTM_DEPLOYMENT_SCRIPTS=/tmp/utm_deployment_scripts
$ docker run -v "$UTM_DEPLOYMENT_SCRIPTS:/deployment_scripts" --rm --name utm-deployment-scripts -ti mellanox/ufm-plugin-utm:latest /bin/sh /get_deployment_scripts.sh
The content of the script folder consists of:
Examples - Contains run/stop scripts for both standalone and UFM plugin modes. Each example script is an example of actual deployment script usage.
hostlist.txt - Specifies the hosts, ports, and HCAs for TIs to be deployed
Scripts - Contains actual deployment scripts. Entry-point script deploy_managed_telemetry.sh triggers the rest two scripts, depending on input arguments.
deployment scripts folder
            $ cd $UTM_DEPLOYMENT_SCRIPTS
$ tree
.
├── examples
│   ├── run_standalone.sh
│   ├── run_with_plugin.sh
│   ├── stop_standalone.sh
│   └── stop_with_plugin.sh
├── hostlist.txt
├── README.md
└── scripts
    ├── deploy_bringup.sh
    ├── deploy_managed_telemetry.sh
    └── deploy_ufm_telemetry.sh
All example/deployment scripts should run from the UTM_DEPLOYMENT_SCRIPTS folder.
Hostlist File
Please note the following:
The hostlist.txt file should be set before running any script.
The hostname and port will be used for communication and HCA for telemetry collection.
To ensure optimal functionality, UTM only supports a single fabric for managed TIs, even if different HCAs on the same machine are connected to different fabrics.
Both local and remote hosts are supported for TI deployments.
deployment help
            $ cat hostlist.txt


# List lines in the following format:
# host:port:hca
#
# where:
#  - host is IP or hostname. Use localhost or 127.0.0.1 for local deployment
#  - port to run telemetry on.
#  - hca is the target host device from which telemetry collects. Run `ssh $host ibstat`
#        to find the active device on the target host.

localhost:8123:mlx5_0
localhost:8124:mlx5_0
Main Deployment Script
For a more customizable setup beyond what the example scripts offer, users have the option to manually run ./scripts/deploy_managed_telemetry.sh. This primary deployment script can deploy multiple TIs and optionally UTM as well.
Use deploy_managed_telemetry.sh --help to get help.
deployment help
            ./deploy_managed_telemetry.sh --help
./deploy_managed_telemetry.sh options:     mandatory:

    mandatory:
        --hostlist-file=     Path to a file that lists hostname:port:hca lines
    mandatory run options (use only one at the same time):
        -r,  --run           Deploy and run managed telemetry setup
        -s,  --stop          Stop all processes and cleanup
    mandatory telemetry deployment options (use only one at the same time):
        -t=, --ufmt-image=   UFM telemetry docker image or tgz/tar.gz-image
      or:
        --bringup-package=   Bringup tar.gz package
    optional:
        -m=, --utm-image=       UTM docker image or tgz/tar.gz-image. Runs UTM only if it is set. Configures UTM according hostlist file
        --utm-as-plugin=        if UTM runs as a plugin, set this flag
        -d=, --data-root=       Root directory for run data   |  Default: '/tmp/managed_telemetry/'
        --switch-telem-image=   Switch telemetry image (tar.gz-file or docker image). UTM will be able to deploy it to managed switches if set
        --common-data-dir=      Common data folder for TIs
    -h,  --help              Print this message
UFM Plugin Mode
Upload the UTM Docker image to the Docker registry on the machine running UFM Enterprise.
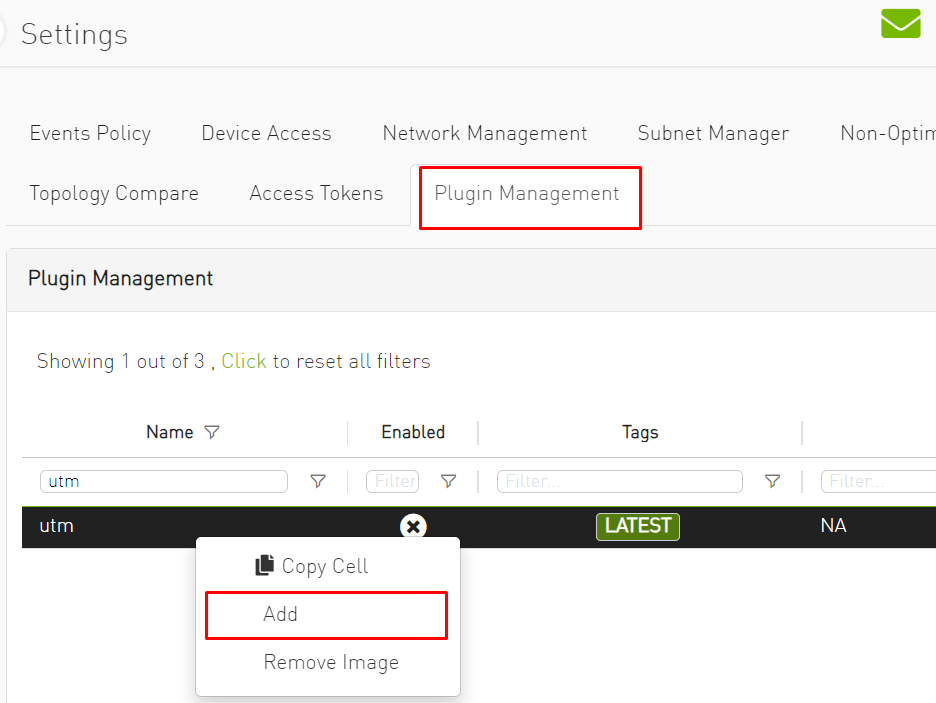
Navigate to the UFM web UI and click on "Settings" in the left panel.
Go to the "Plugin Management" tab.
Right-click on the UTM plugin row and select "Add."

Go to the option on the left called "Telemetry Status" to see the UTM UI page.
Prepare TI setup using utm_deployment_scripts example scripts:
Change directory:
cd $UTM_DEPLOYMENT_SCRIPTS
Open and configure hostlist.txt
Deploy and run TIs according to hostlist.txt and set these TIs to be monitored by UTM:
sudo ./examples/run_with_plugin.sh
To stop and cleanup TIs setup and unset TIs to be monitored by UTM:
sudo ./examples/stop_with_plugin.sh
NoteThis script does not stop UTM plugin!
To stop the UTM plugin, go to "Plugin Management", right-click on the UTM plugin line and click on disable.
Default UFM Telemetry Monitoring
UFM Telemetry has high and low-frequency (Primary and Secondary, respectively) TIs that are running by default.
To enable meaningful monitoring:
Set plugin_env_CLX_EXPORT_API_SHOW_STATISTICS=1 in the config files:
deployment help
            /opt/ufm/files/conf/telemetry_defaults/launch_ibdiagnet_config.ini
/opt/ufm/files/conf/secondary_telemetry_defaults/launch_ibdiagnet_config.ini
Restart telemetry instances with the new config. If UFM Enterprise runs as a docker container, this command should be executed inside the container.
deployment help
/etc/init.d/ufmd ufm_telemetry_restart
Give TIs some time to update performance metrics. The time depends on the update interval of default TIs.
Standalone Mode
In standalone mode, UTM periodically tracks fabric changes by itself and does not require UFM Enterprise.
Deploy via example scripts:
Change directory
cd $UTM_DEPLOYMENT_SCRIPTS
Open and configure hostlist.txt
Deploy and run TIs according to hostlist.txt and run UTM:
sudo ./examples/run_standalone.sh
To stop and cleanup TIs setup and UTM, run:
sudo ./examples/stop_standalone.sh
Manual Deployment
This section provides detailed instructions for manually deploying UTM and managed TIs to ensure coverage of all potential corner cases where the convenience script may not be effective.
UTM Deployment
UTM can be started with two docker run commands.
Set utm_config, utm_data, utm_log, and utm_image variables.
Initialize UTM config:
Initialize UTM
docker run -
v$utm_config:/config \ -v$utm_data:/data \ --rm--name utm-init \ --device=/dev/infiniband/ \ $utm_image /init.shRun UTM
Run UTM
docker run -d --net=host \ --security-opt seccomp=unconfined --cap-add=SYS_ADMIN \ --device=/dev/infiniband/ \ -
v$utm_config:/config \ -v$utm_data:/data \ -v$utm_log:/log \ --rm--name utm $utm_image
Managed/Standalone TIs Manual deployment
TI can be represented either as a UFM Telemetry docker container or as a UFM Telemetry Bring-up package.
To run the docker container in managed mode, launch_ibdiagnet_config.ini should have the following flags enabled:
TI docker config
            plugin_env_CLX_EXPORT_API_SHOW_STATISTICS=1
plugin_env_UFM_TELEMETRY_MANAGED_MODE=1
To run UFM Telemetry with Distributed Telemetry, enable its receiver and specify HCA to work on:
TI docker config
            plugin_env_CLX_EXPORT_API_RUN_DT_RECEIVER=1
plugin_env_CLX_EXPORT_API_DT_RECEIVER_HCA=$HCA
To run bringup in managed mode, create enable_managed.ini file with the same flags and use custom_config option of collection_start:
TI bringup config
collection_start custom_config=./enable_managed.ini
UTM Configuration File
The UTM configuration file utm_config.ini is placed under the configuration folder (which is referred to asUTM_CONFIG later on this document).
In the case of UFM plugin mode, UTM_CONFIG= /opt/ufm/files/conf/plugins/utm/.
In the case of standalone mode, the default value is UTM_CONFIG =/tmp/managed_telemetry/utm/config and can be changed via --data-root argument of deployment script.
When changes are made to the configuration file, UTM initiates a restart of its main process to implement the updated configuration.
Users may wish to adjust timeout and update rate configurations based on their specific setups. However, it is important to note that the remaining configurations are tailored to enable UTM to function as a UFM plugin and should not be modified.
Distributed Telemetry
To enable distributed telemetry set dt_enable=1 in the corresponding section.
Distributed Telemetry requires Switch Telemetry docker image tagged as switch-telemetry:{version} and placed under $UTM_CONFIG/telem_files/ as switch-telemetry_{version}.tar.gz
UTM scans this file at its start.
Example deployment scripts handle it for both UFM plugin and standalone modes.
For more details refer to NVIDIA UFM Telemetry Documentation→ Distributed Telemetry - Switch Telemetry Agent
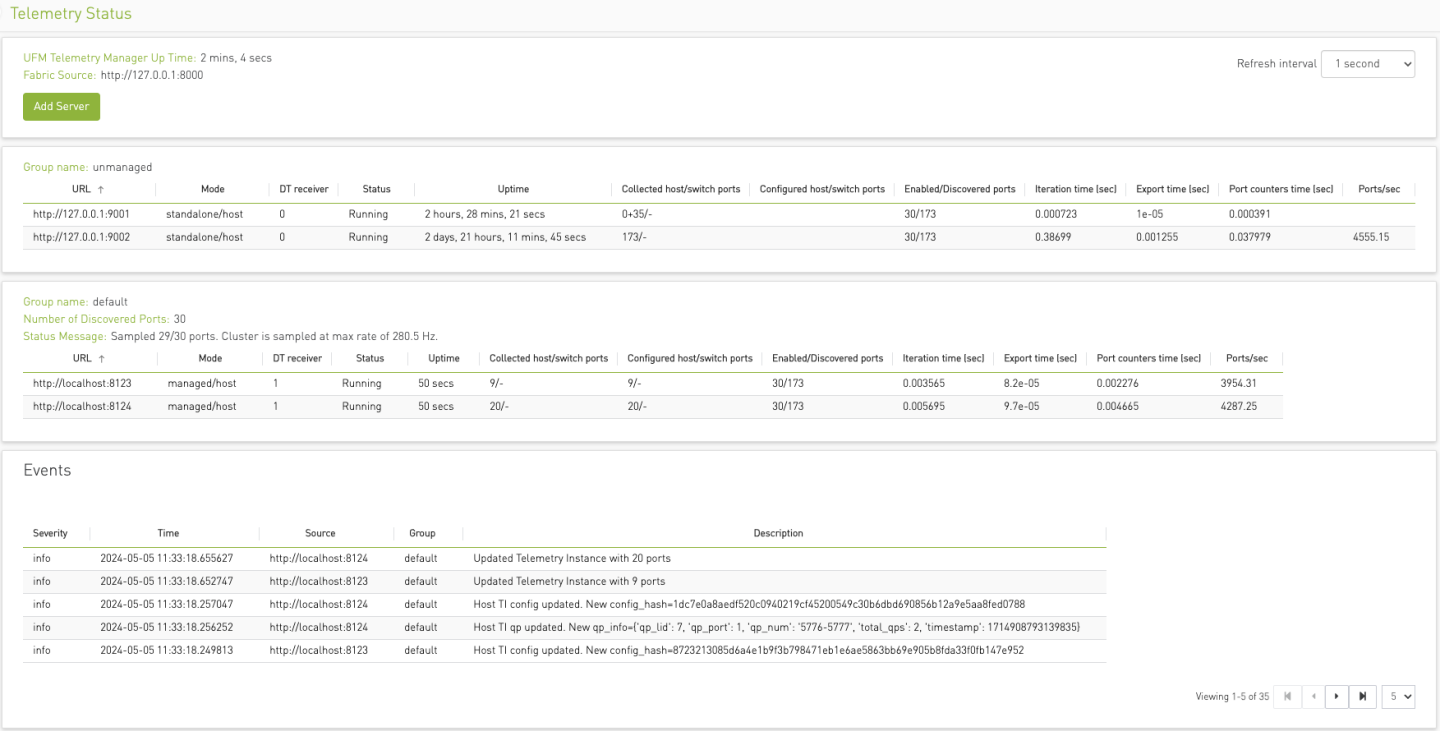
To access the GUI within the UFM web UI, navigate to the Telemetry status section in the left panel.
The UI is accessible whether it is running as a part of UFM Enterprise or standalone via the endpoint: http://127.0.0.1:8888/files/index.html.
The GUI comprises several zones:
The top pane displays general information and provides options to add a server name/IP and port for monitoring. Users can set the GUI refresh interval in the top right corner.
The middle panes showcase TI groups, with the default group being basic. Unmanaged (standalone) TIs can be monitored and are placed in the "Unmanaged" group.
Each group pane presents monitoring information for each TI.
The bottom pane exhibits system events. Utilize the bottom right menu to navigate through the events history.

TI Management
In managed mode, UTM has the capability to dispatch commands to TIs. By right-clicking on the TI line, users can:
Pause a currently running TI. This action redistributes fabric sharding among the active TIs.
Resume a paused TI.
Exclude a TI from monitoring. Although the TI remains on the machine, it enters a paused state and is removed from its group. It's important to note that empty TI groups are automatically removed.
Telemetry status fields
The table below lists each column of a Telemetry Group panel:
|
Field Name |
Description |
|
URL |
TI URL in format http://{hostname}:{port} or http://{IP}:{port} |
|
Mode |
standalone or managed / platform |
|
DT receiver |
With or without a Distributed Telemetry receiver. If 0, cannot receive DT data from a switch TI |
|
Status |
Down, Running, Initializing, Paused, or Restarting |
|
Uptime |
TI uptime in human-readable format |
|
Collected host/switch ports |
Ports collected from the host/switch. By default data that did not change from the last sample is not being re-exported. Such data is shown in the host part ad +num_old_ports. In the screenshot above. first TI of the "unmanaged" group sampled 0 new data samples and found 35 old ones. Nothing is being sampled from Distributed Telemetry, because this TI runs without DT receiver. The resulting format is: 0+35/- |
|
Configured host/switch ports |
Ports configured to be sampled from a host and corresponding switches in total. For more details refer to Distributed Telemetry documentation. |
|
Enabled/discovered ports |
Enabled and discovered ports of the Fabric. |
|
Iteration time |
Total iteration time of UFM Telemetry data collection |
|
Export time |
Export time in the last iteration of UFM Telemetry data collection. Included to Iteration time |
|
Port counters time |
Time spent only on port counters telemetry collection. Included to Iteration time |
|
Ports/sec |
Speed of new port counters data collection during the last iteration of UFM Telemetry. |
All the GUI features including TI management and monitoring can be accessed via REST API.
To access the REST API command list in UFM plugin mode via UFM proxy:
Standalone UTM help
curl -s -k https://{UFM_HOST_IP}/ufmRest/plugin/utm/help -u {user}:{pass}
By default , UTM runs on port 8888. To access the command list in standalone mode directly list use:
Standalone UTM help
curl -s http://127.0.0.1:8888/help
Get the status of the monitored TIs in JSON format:
Standalone UTM help
curl http://127.0.0.1:8888/status
Add TI http://127.0.0.1:8123 to the my_group monitoring group:
Standalone UTM help
curl
'http://127.0.0.1:8888/add_server?url=http://127.0.0.1:8123&group=my_group'Add TI http://127.0.0.1:8123 to default monitoring group:
Standalone UTM help
curl http://127.0.0.1:8888/add_server?url=http://127.0.0.1:8123
Remove TI from monitoring (running TI will be paused):
Standalone UTM help
curl http://127.0.0.1:8888/remove_server?url=http://127.0.0.1:8123
Pause running TI:
Standalone UTM help
curl http://127.0.0.1:8888/pause_server?url=http://127.0.0.1:8123
Resume paused TI:
Standalone UTM help
curl http://127.0.0.1:8888/start_server?url=http://127.0.0.1:8123