UFM Events Grafana Dashboard Plugin
This plugin monitors and parses UFM events from the event.log file using Fluentd. It pushes the logs to a Loki server and visualizes them through Grafana dashboards.
Install Plugin on UFM.
Access Grafana Dashboard at:
http://<IP>:3002(default credentials:admin/admin).
Fluentd: Parses
event.logfile, extracts relevant fields, and pushes logs to Loki.Loki: Aggregates and stores logs.
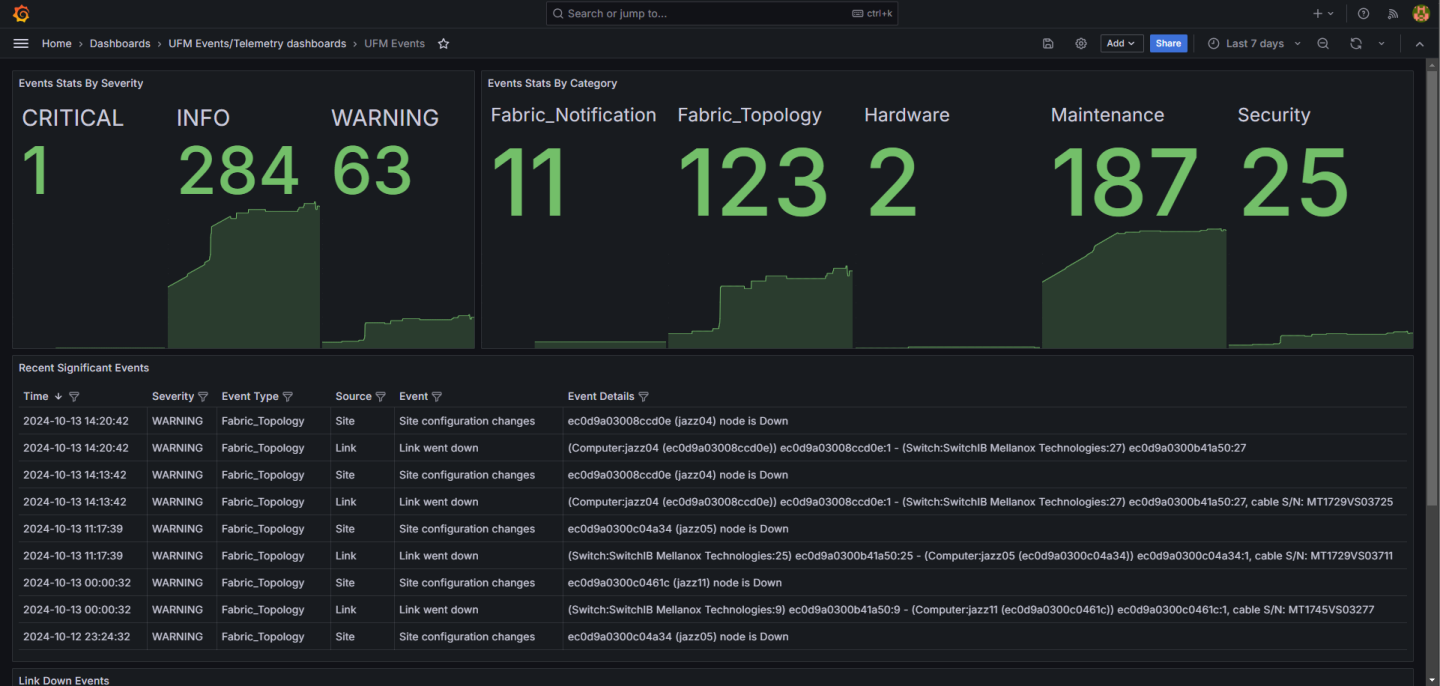
Grafana: Visualizes logs with predefined panels (e.g., Events Stats, Topology Changes, Hardware Events).
Fluentd:
/opt/ufm/files/conf/plugins/ufm_events_grafana_dashboard/fluentd/fluentd.confLoki:
/opt/ufm/files/conf/plugins/ufm_events_grafana_dashboard/loki/loki-local-config.yamlGrafana:
/opt/ufm/files/conf/plugins/ufm_events_grafana_dashboard/grafana/grafana.ini
Plugin logs are stored in /opt/ufm/files/log/plugins/ufm_events_grafana_dashboard/.
Navigate to Grafana -> Dashboards -> UFM Events to view predefined panels or create custom queries under the Explore section.