Telemetry
UFM Telemetry allows for tracking the network bandwidth, congestion, errors, and latency. UFM offers the following telemetry features:
Real-time monitoring views
Multiple attributes monitoring
Intelligent Counters: provide error and congestion counters
InfiniBand port-based error counters
InfiniBand congestion XmitWait counter-based congestion measurement
InfiniBand port-based bandwidth data
The following actions may be taken with the telemetry session panels:
Rearranging – using a simple drag and drop function
Resizing – by hovering over the panel's border
It is also possible to get a larger view of a telemetry session by clicking the pop-out button on the top right-hand corner of each panel.
Telemetry Session Objects and Attributes
Monitored objects may be ports or devices in the fabric.
Monitored attributes can be raw counters or calculated counters:
A raw attribute is a simple attribute to be monitored (e.g. Port TX Wait)
A calculated attribute is an attribute that has been calculated based on one or more counters (e.g. PortXmitPktsRate)
Telemetry contains multiple views, and the user can create, edit and delete views.
Telemetry supports two types of panels, time-series which show the relationship between time and counter value for a specific device, and topX which show all ports with pick by counter greater than topX value.
TopX is not supported in case of ibpm telemetry provider. The telemetry provider is hidden in this case.

The panel can be created by filling the following model:

The user can select one of the following telemetry session modes:
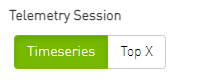
Timeseries: Provide the user with historical/live timeseries graphs of the selected counters for the selected devices/ports.
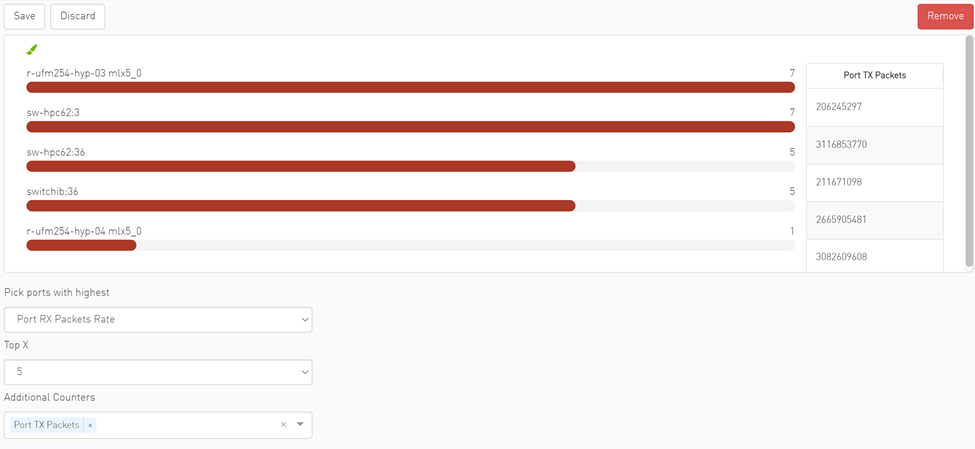
Top X: Provides the user with Top X ports by the selected counters (where X is 5, 10, 15, 20).
You can select the members grouping type; Devices or Ports:

In case the selected telemetry session is Top-X, only the ports are supported.
The user can select one or more counters from the counters dropdown menu:
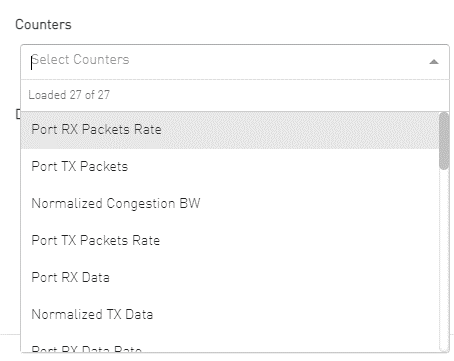
Or alternatively, the user can get a full view of all the supported counters and select one or more by clicking on the "All Counters" button:

The user can select one or more devices/ports from the relevant dropdown menu:
Devices:

Or alternatively, the user can choose to get a full view of the devices by clicking on the "All Devices" button:

Ports:
After switching the from "Devices" to "Ports", you user is able to view the ports’ dropdown menu:
Or alternatively, the user can choose to get a full-view ofthe ports by clicking on the "All Ports" button.
Data aggregation can be changed in timeseries panel by grouping the members by device or ports, and this functionality is an option in the context menu. Therefore, if the timeseries panel is created with the "Devices" members, the panel shows each port in an individual line by right-clicking and then grouping by ports.


The Telemetry obtains live data from the server's each specific interval which equals the default session interval. The interval can be changed from the sampling rate option in the context menu.

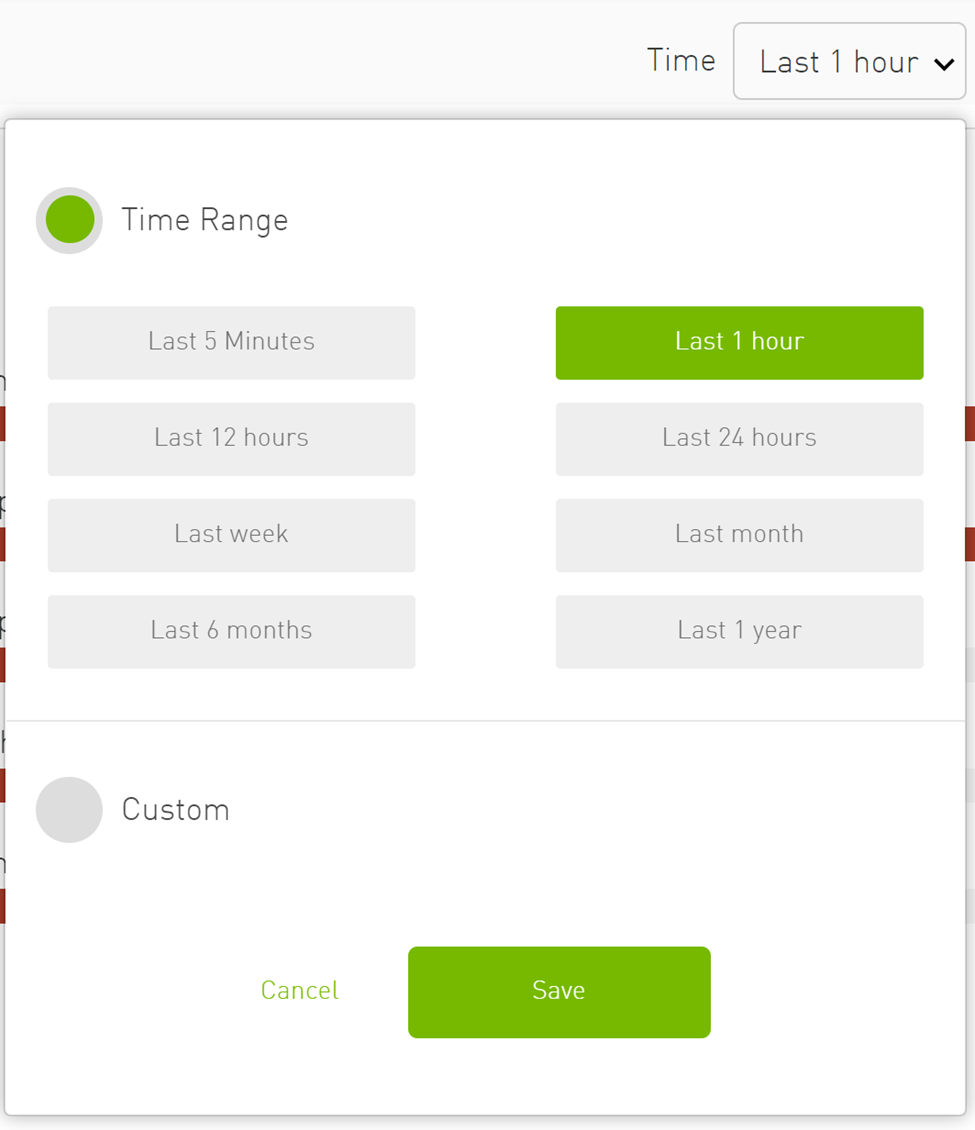
The starting time of timeseries panel can be changed from the time calendar at the top of the page, time can be "Time Range" or "Custom". In case the "Custom" option is chosen, only history data is shown.
The panel can be edited by changing members, members' type and grouping. The changes can be discarded or saved. The panel can also be deleted.


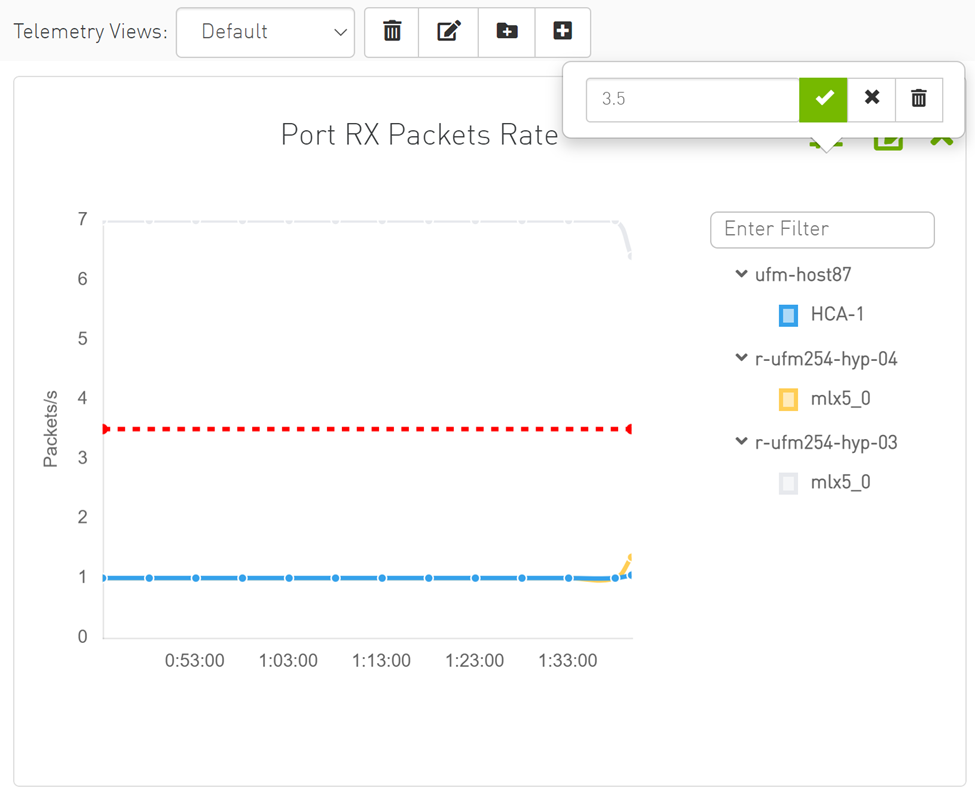
The threshold is supported in Telemetry as a line drawn at the threshold value.
In the Devices table, the user can see telemetry data for one or multiple devices as timeseries chart by clicking on the monitoring option in the context menu.


Setting up telemetry deploys UFM Telemetry as bare metal on the same machine. Historical data is sent to SQLite database on the server and live data becomes available via UFM UI or REST API.
The UFM Telemetry feature is enabled by default and the provider is the UFM Telemetry. The user may change the provider via flag in conf/gv.cfg
The user may also disable the History Telemetry feature in the same section.
            [Telemetry]
# possible values:telemetry, ibpm
telemetry_provider=telemetry
history_enabled=True
There is an option to configure parameters on a telemetry configuration file which takes effect after restarting the UFM or failover in HA mode.
The launch_ibdiagnet_config.ini default file is located under conf/telemetry_defaults and is copied to the old configuration location with the run of UFM start.
All values taken from the default file take effect at the deployed configuration file except for the following:
hca
scope_file
plugin_env_PROMETHEUS_ENDPOINT
plugin_env_PROMETHEUS_INDEXES
config_watch_enabled=true;
plugin_env_PROMETHEUS_CSET_DIR
num_iterations
plugin_env_CLX_RESTART_FILE
the following attributes are configurable from the gv.cfg:
sample_rate (dashboard _interval) – only if manual_config is set to false
prometheus_port