After a Process is Connected#
After a process is connected, it is ready to be analyzed. For some activities a default set of windows will come up that offer an impactful set of tools for analysis that pertains to the activity. You can also add additional windows to the application by selecting a view from the menu with the same name as the activity.
The Graphics Capture and the GPU Trace Profiler activities are used to create static report files, which are inspected from the Documents window. In the case of Graphics Capture, a button available from capture document launches the Graphics Debugger, which functions like an activity.
See the Activities section for more information about how to use each activity.
Choose Window To Debug#
If your application has multiple windows, each with a graphics context, you can choose the window that you want to focus your debugging and profiling efforts on. For instance, if your application has 3 different windows, each with its own view of the scene, you can easily select the window of interest to capture. When multiple windows are detected, there will be a new “Select Window” control on the top toolbar. The combo box to the right will be populated with the detected windows, including the window name and size to aid in determing the correct window.
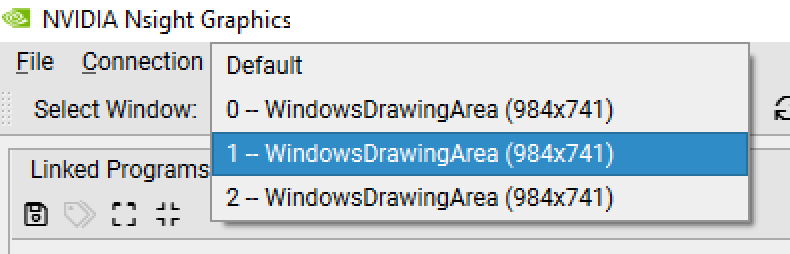
Any time that you are not currently in an active Capture/Replay, you can use the control to specify the window to capture. If you select “Default,” the most recent window to present the back buffer will be selected as the window to capture. This option is available with the OpenGL Frame Debugger activity.
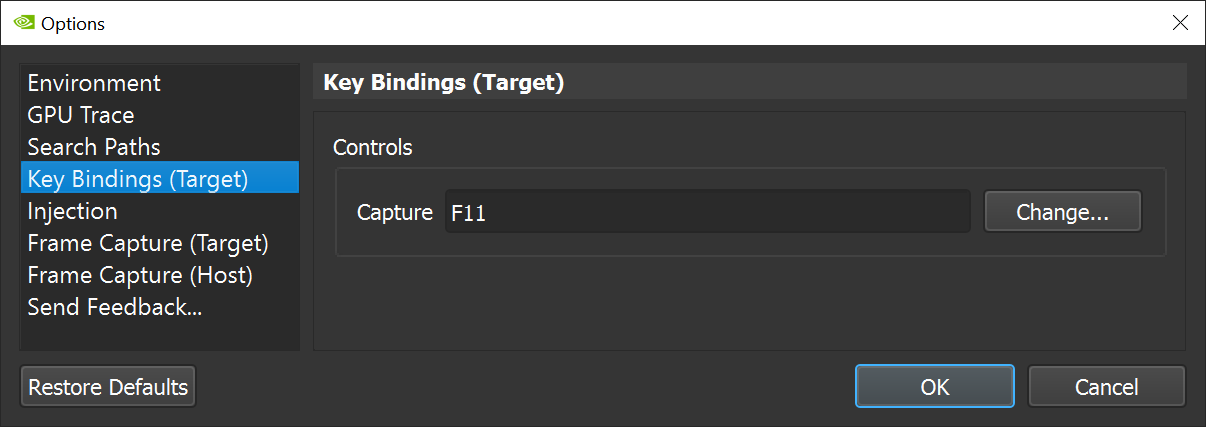
Target application capture hotkey#
Activities support triggering capture from the Nsight Graphics UI or directly from the target application. The default capture hotkey is F11. This may be configured also in Tools > Options.