


Options#
The Options dialog, accessed via the Tools > Options… menu, allows you to configure Nsight Graphics in a number of different ways. Each section is detailed below. The options selected are persisted in user settings for the next time you run the tool.
Fonts, Colors, and Environment#
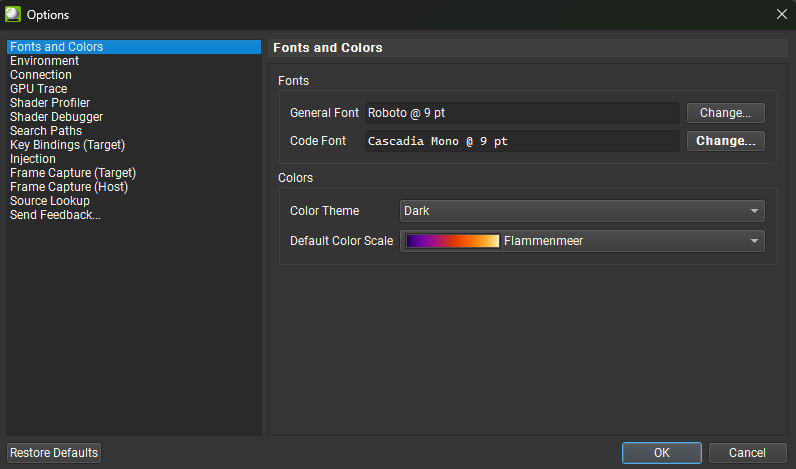
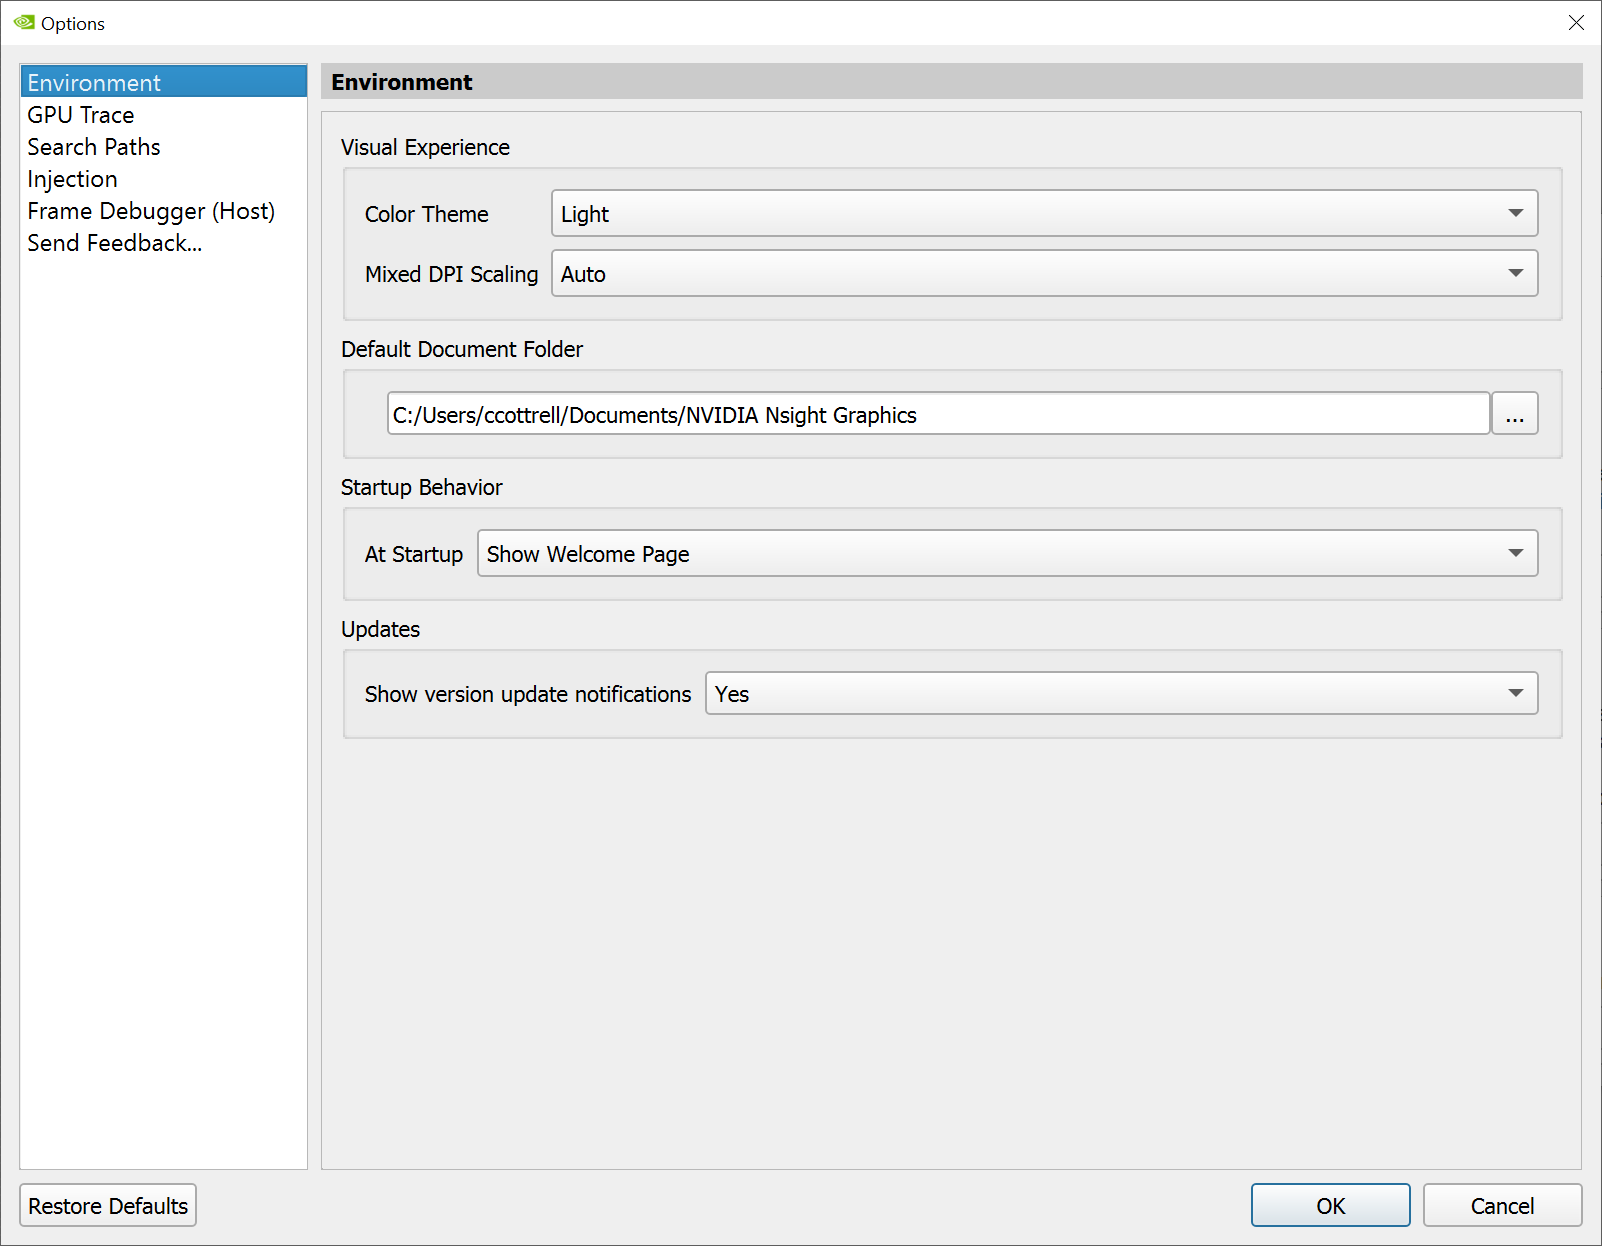
On these tabs, select whether to use the light or dark theme, font selection, the default document folder for Nsight Graphics to use, and your preferred startup behavior.
GPU Trace#
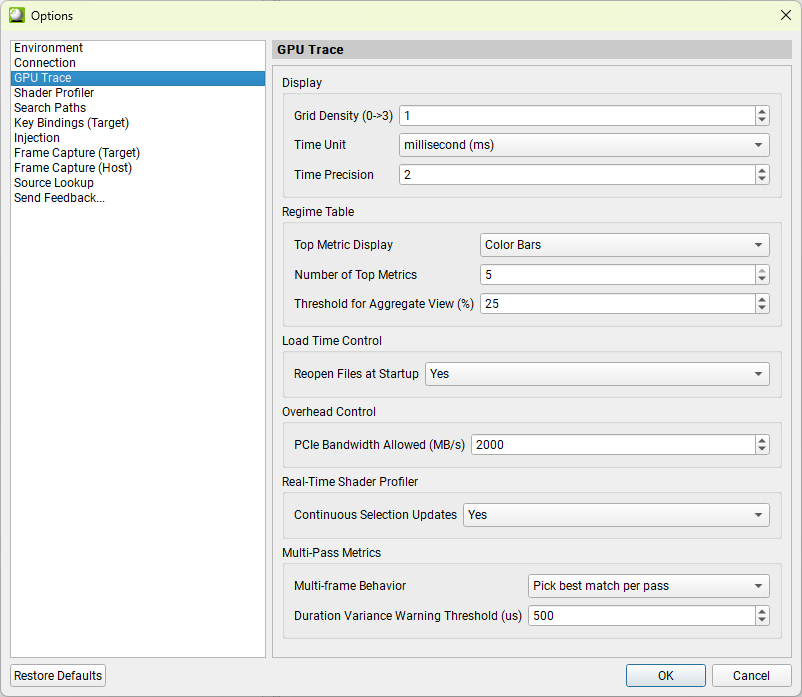
On the GPU Trace tab, you can configure report display options, the aggregate-view variance threshold, whether files reopen at startup, and supported multi-pass behavior.
Shader Profiler#
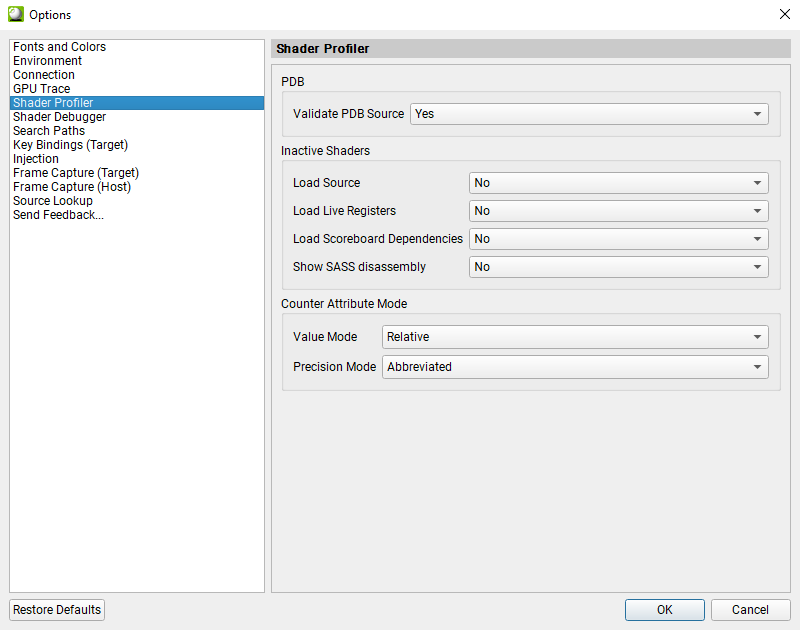
On the Shader Profiler tab, you can change the shader bytecode loading behavior, inactive shader displaying mode, and counter display mode.
PDB when setting to
Yes, shader debug information is loaded from the PDB file, even if the PDB file doesn’t match the bytecode.Inactive Shaders controls if the shader source, live registers or scoreboard dependencies are loaded for inactive shaders (shaders that has 0 PC samples). Setting to
Nofor better performance of opening Shader Profiler reports.Counter Attribute Mode controls the ways to display counters.
Value Mode:
Relativemode displays counters as percentage.Absolutemode displays counters as absolute values.Precision Mode:
Abbreviatedmode displays counters as human-readable numbers.Fullmode displays the raw counter values. This option is only valid if Value Mode is set toAbsolute.
Search Paths#
On the Search Paths tab, you can configure search path settings for shader and application debug files used by the NVIDIA Nsight Aftermath GPU Crash Dump Inspector, NVIDIA Nsight Graphics Capture, NVIDIA Nsight Graphics OpenGL Frame Debugger, and other tools.
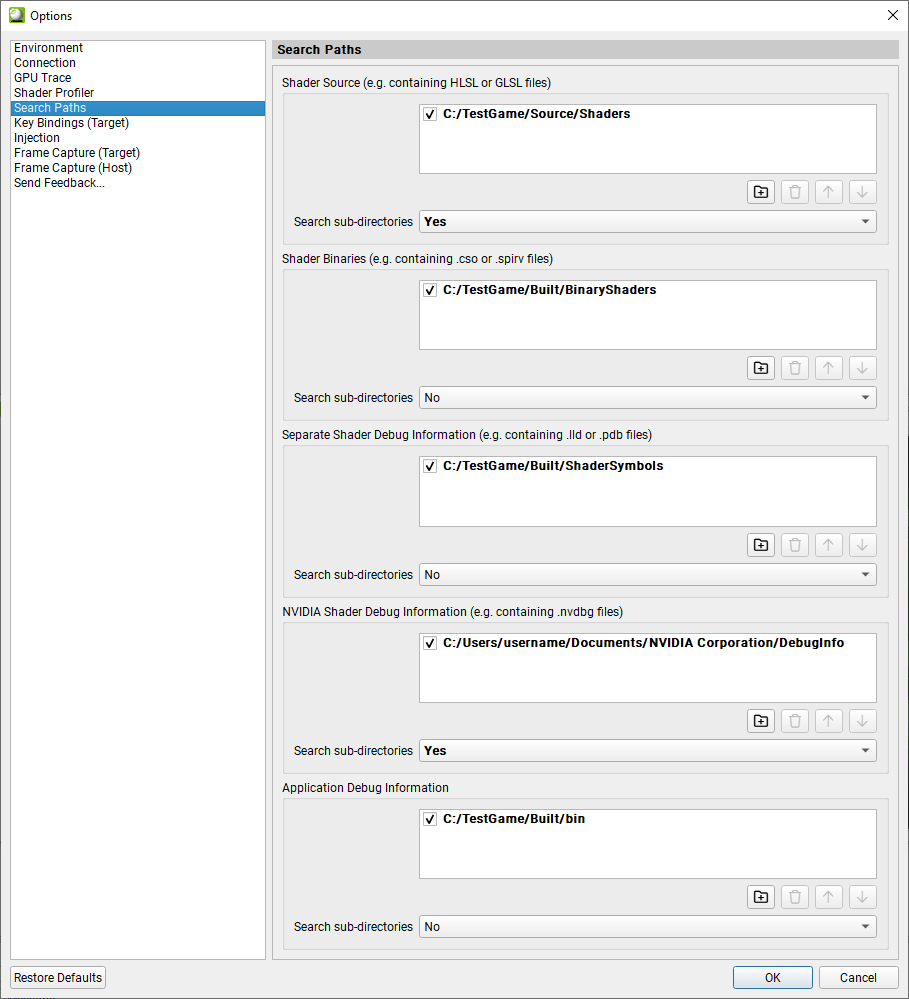
Shader Binaries specifies a list of directories where pre-compiled binary shader objects (DirectX shader binary files generated by the HLSL compiler, SPIR-V shader binaries, etc.) can be found. For example, when opening an Nsight Aftermath GPU crash dump, those paths are searched for the shader binary matching the shader hash to access the DXIL/SPIR-V instructions or retrieve source mapping information.
Separate Shader Debug Information specifies a list of directories where shader debug information files separate from the shader binary can be found. These are the shader debug information files that may have been produced by your compiler toolchain when compiling the shader binaries (
.lldor.pdbfiles generated bydxc.exefor instance).NVIDIA Shader Debug Information specifies a list of directories where external NVIDIA shader debug information files can be found. These are the shader debug information files generated by the Nsight Aftermath GPU Crash Dump Monitor (
.nvdbgfiles) or the files created based on the data provided by the shader debug information callback for applications that are instrumented with the GPU crash dump collection feature of the Nsight Aftermath SDK. With R615 and later NVIDIA graphics drivers, crash-relevant NVIDIA shader debug information will also be embedded directly into the GPU crash dump. Nsight Graphics uses embedded NVIDIA shader debug information before searching the configured directories. Shader debug information is identified by a unique shader debug information identifier embedded into the crash dump file. The shader debug information identifier is used to search for an external shader debug information file when the dump does not contain matching embedded NVIDIA shader debug information, or when analyzing crash dumps captured with earlier drivers.Shader Source specifies a list of directories where shader source files can be found. This option is used to associate the high-level shader (HLSL, GLSL, etc.) source files that are used in your application to the file names that are embedded in shader objects by your shader compiler. In many cases, source files are already be embedded into the shader binaries, in which case this path is not required to display source information. However in some cases only relative source file paths may be available in the shader binaries, thus requiring resolution to the final source file using this setting.
Application Debug Information specifies a list of directories where CPU code debug information (e.g., PDB files or shared object files with debug information) for the application that is analyzed and the dynamic libraries it has loaded can be found. This is necessary to resolve application call stacks in several views such as the GPU Crash Dump Viewer.
For all of the above paths, it is possible to recursively search the configured directories by enabling the Search sub-directories option that is associated with each.
Injection#
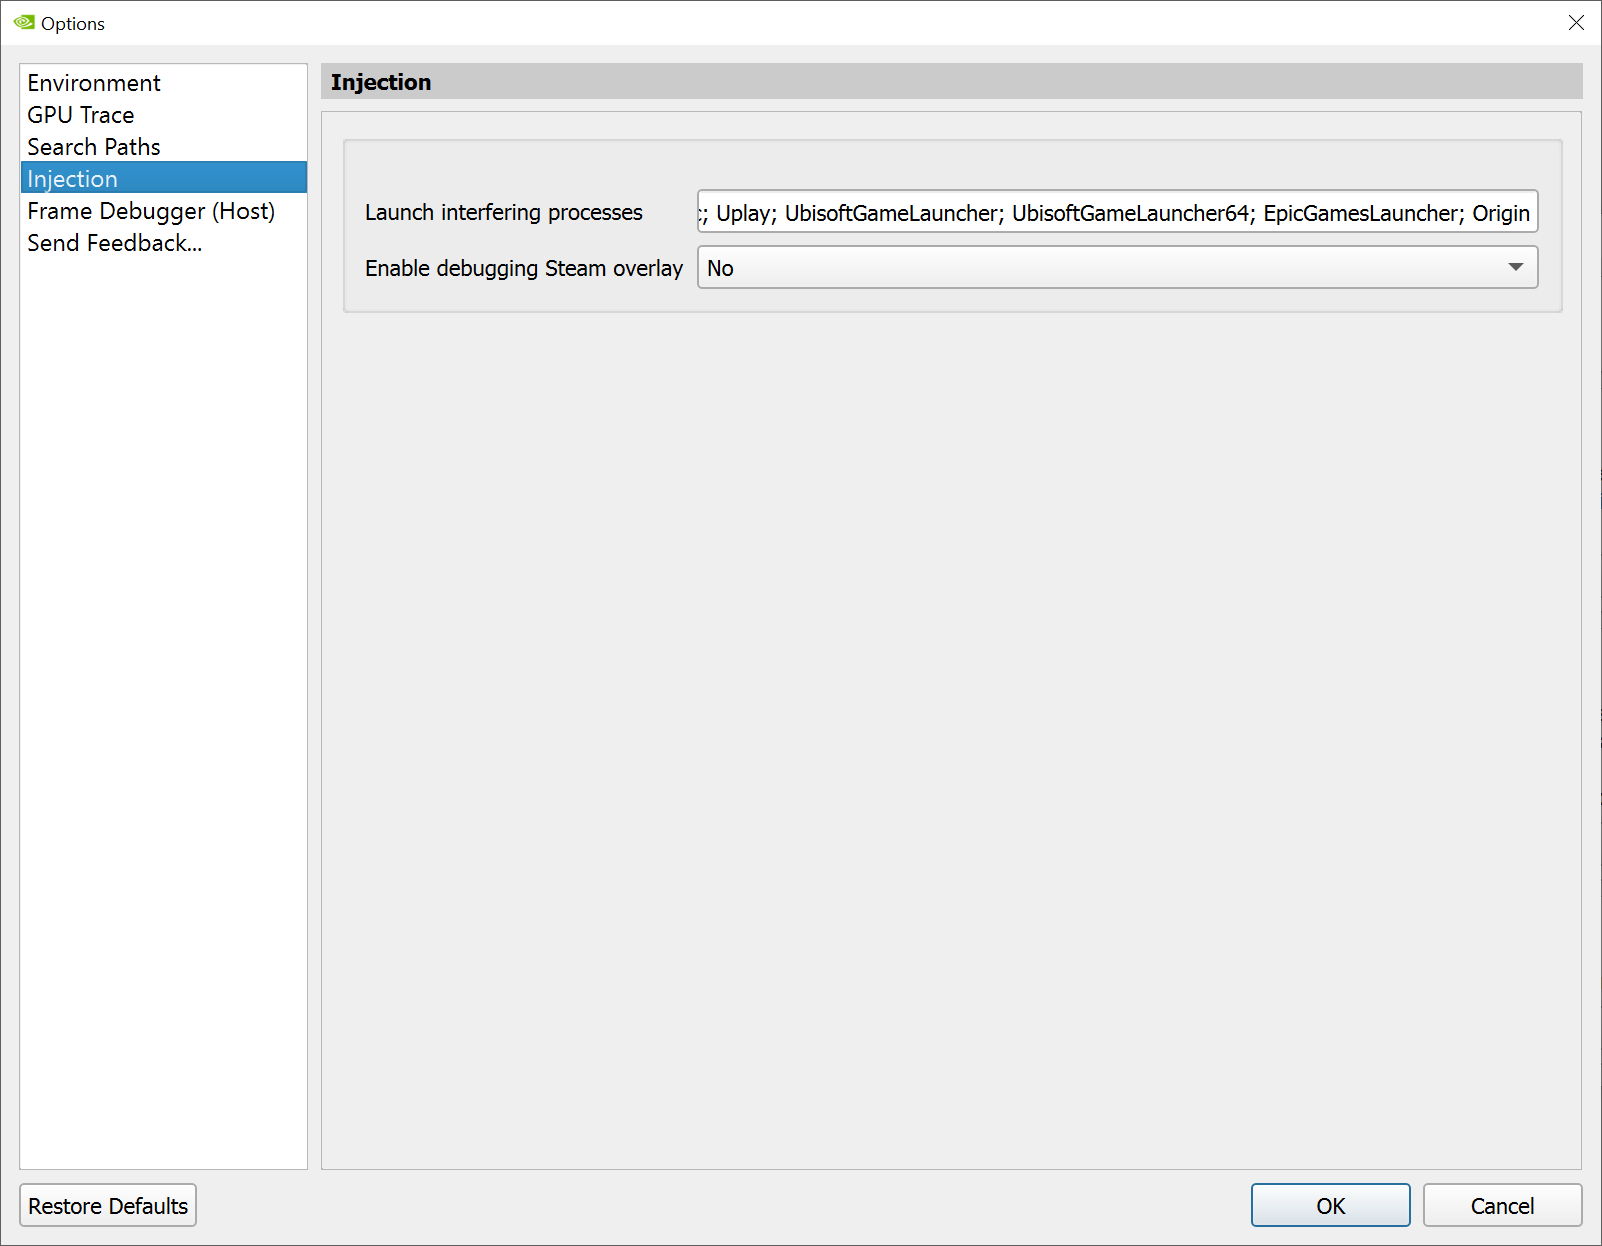
On the Injection tab, select whether to enable or disable debugging Steam overlay.
OpenGL Frame Debugger (Host)#
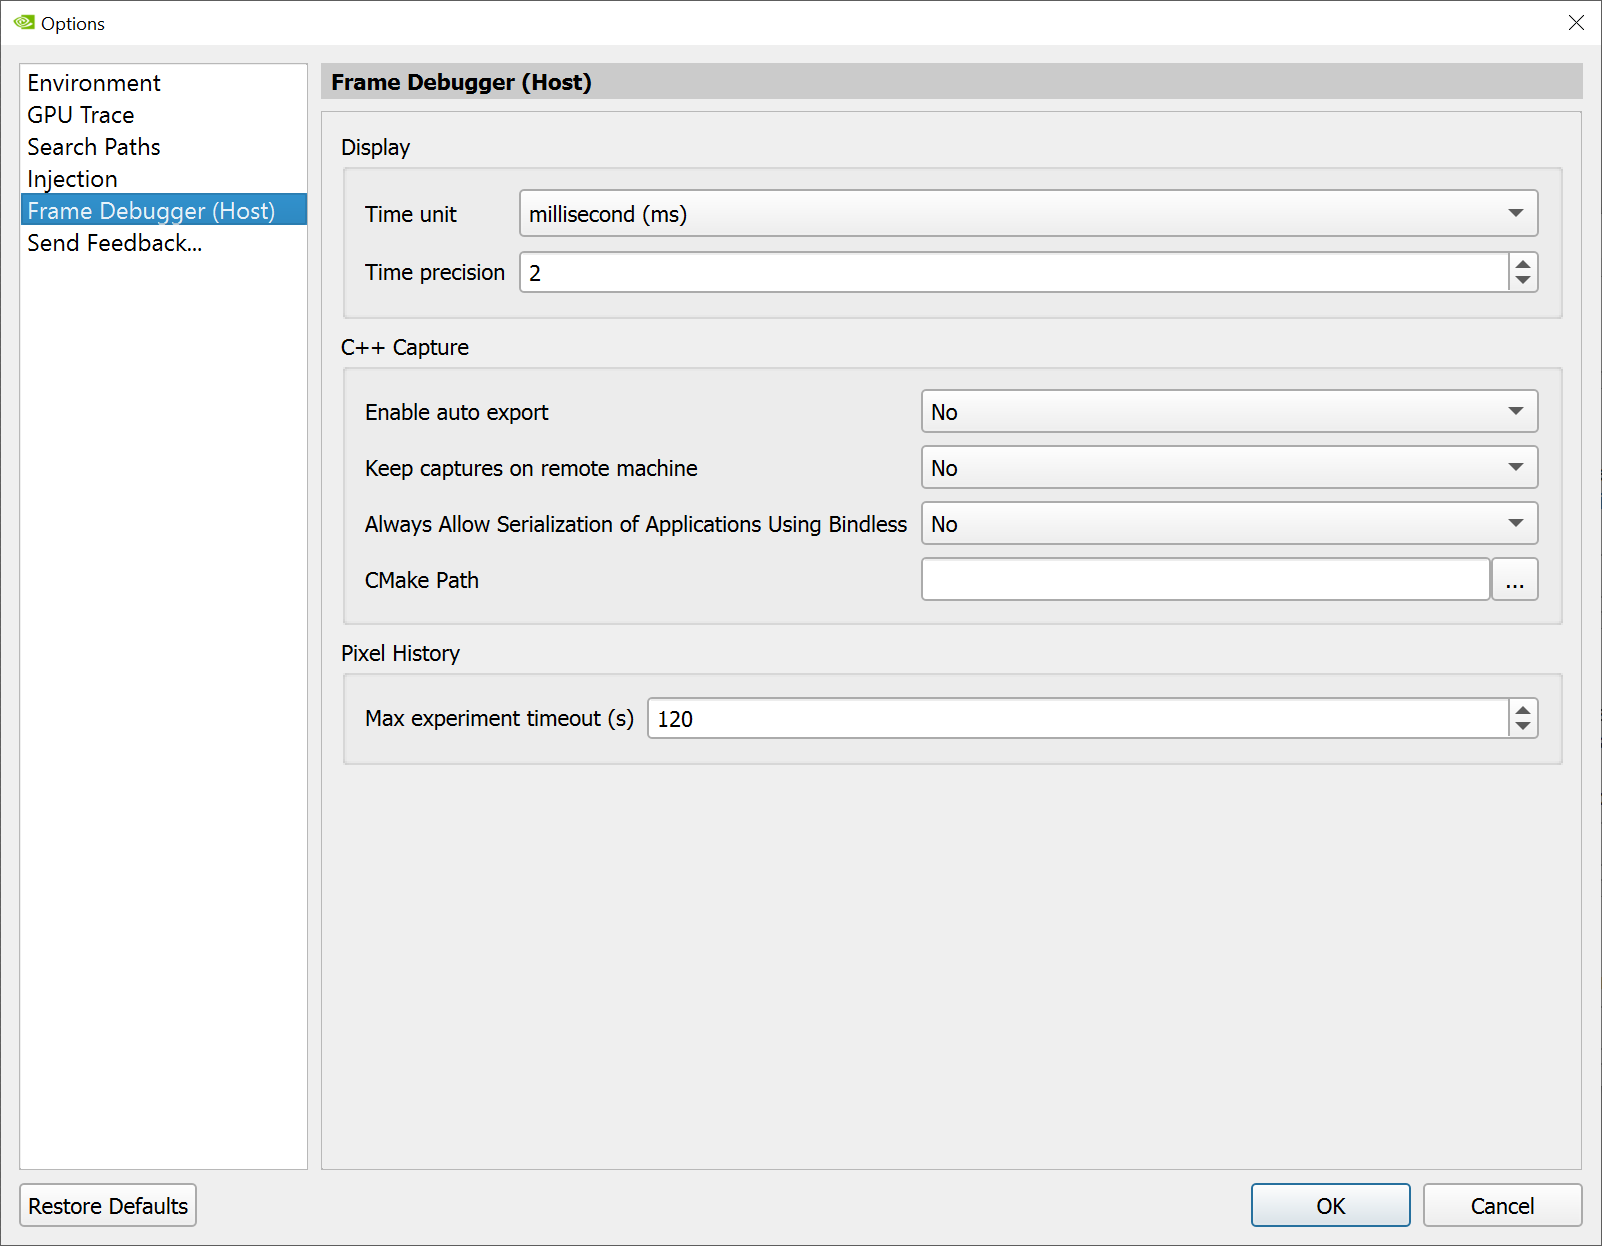
On the Frame Debugger tab, you can configure the time unit and precision settings for the host display, settings for C++ Capture, and set the timeout for a Pixel History.
Feedback#
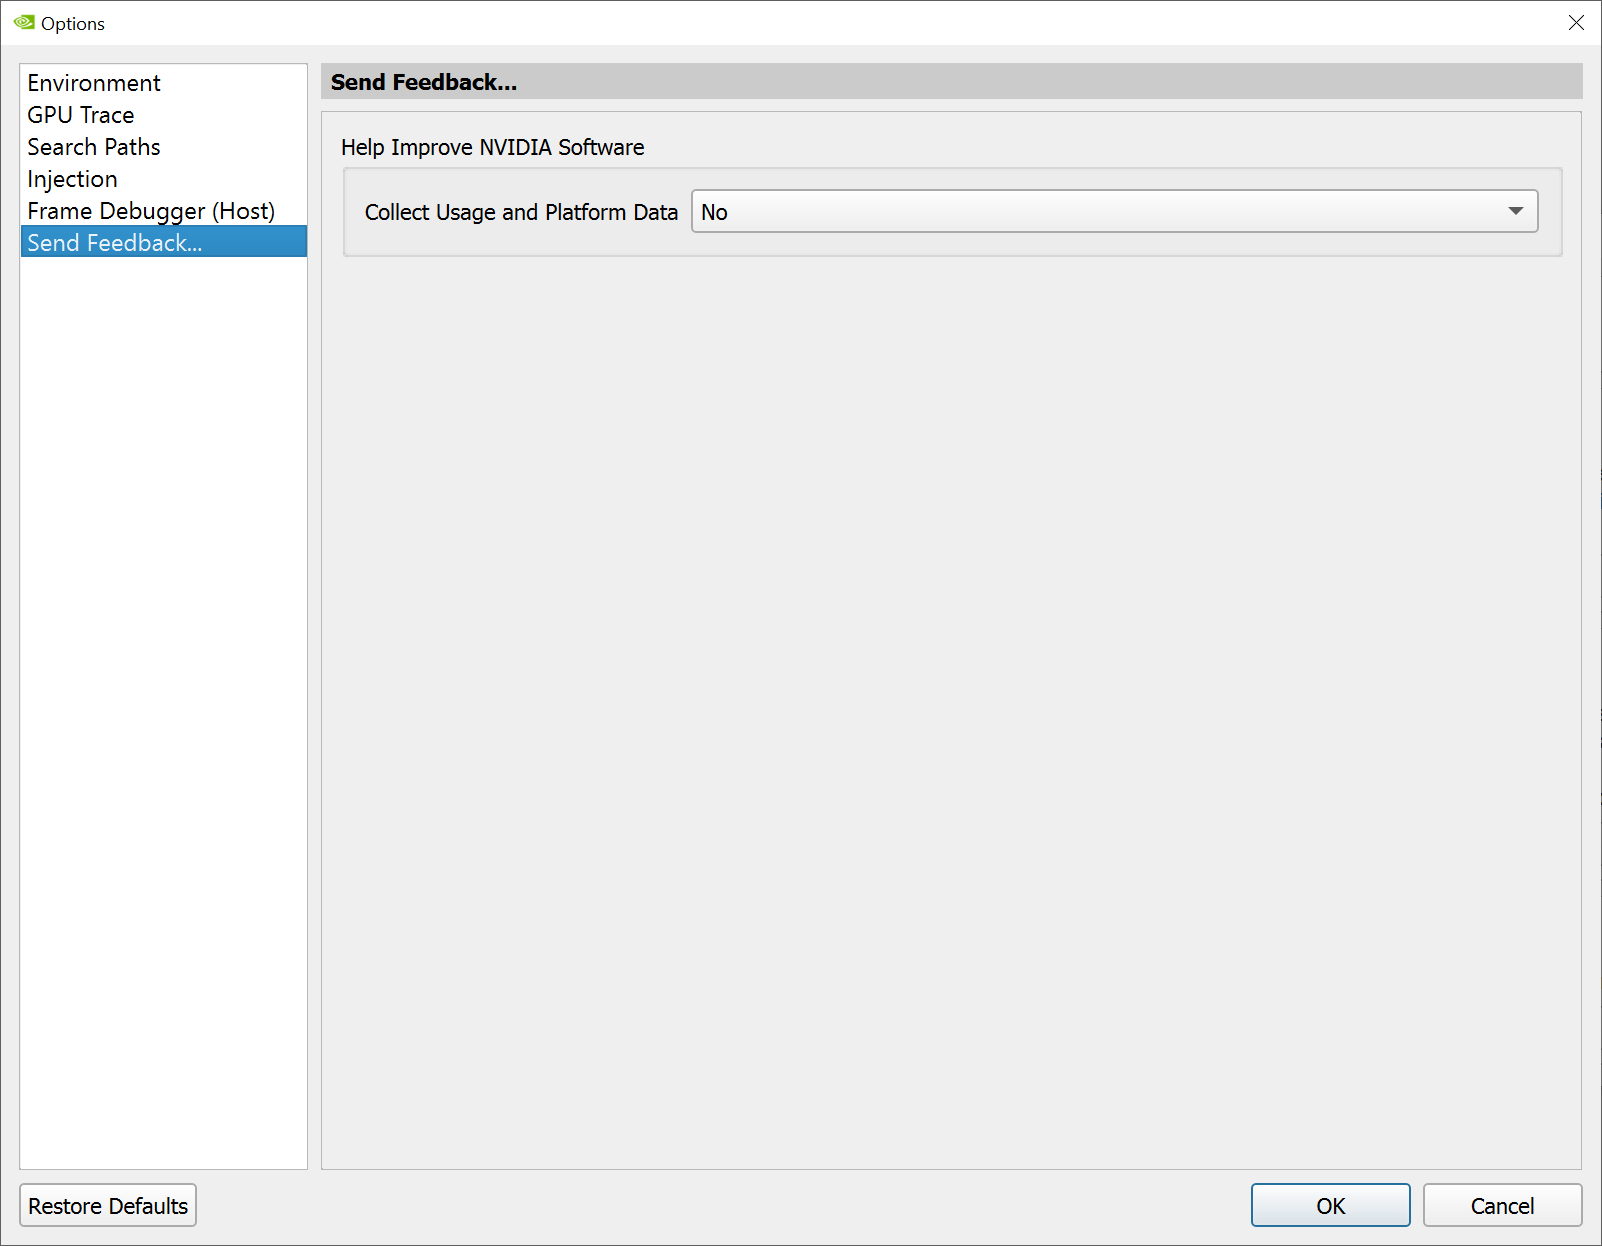
On the Feedback tab, choose whether or not you wish to allow Nsight Graphics to collect usage and platform data.