Post-Collection Analysis Guide#
NVIDIA Nsight Systems Analysis guide.
Overview#
Once you have profiled using Nsight Systems there are many options for analyzing the collected data, as well as to output it in various formats. These options are available from the CLI or the GUI.
Statistical Analysis#
Statistical Reports Shipped With Nsight Systems#
The Nsight Systems development team created and maintains a set of report scripts for some of the commonly requested statistical reports. These scripts will be updated to adapt to any changes in SQLite schema or internal data structures.
These scripts are located in the Nsight Systems package in the Target-<architecture>/reports directory. The following standard reports are available:
Note
The ability to display mangled names is a recent addition to the report file format, and requires that the profile data be captured with a recent version of Nsight Systems. Re-exporting an existing report file is not sufficient. If the raw, mangled kernel name data is not available, the default demangled names will be used.
Note
All time values given in nanoseconds by default. If you wish to output the results using a different time unit, use the --timeunit option when running the recipe.
cuda_api_gpu_sum[:nvtx-name][:base|:mangled] – CUDA Summary (API/Kernels/MemOps)#
Arguments
nvtx-name : Optional argument, if given, will prefix the kernel name with the name of the innermost enclosing NVTX range.
base - Optional argument, if given, will cause summary to be over the base name of the kernel, rather than the templated name.
mangled - Optional argument, if given, will cause summary to be over the raw mangled name of the kernel, rather than the templated name.
Note
The ability to display mangled names is a recent addition to the report file format, and requires that the profile data be captured with a recent version of Nsight Systems. Re-exporting an existing report file is not sufficient. If the raw, mangled kernel name data is not available, the default demangled names will be used.
Output: All time values default to nanoseconds
Time : Percentage of “Total Time”
Total Time : Total time used by all executions of this kernel
Instances : Number of executions of this kernel
Avg : Average execution time of this kernel
Med : Median execution time of this kernel
Min : Smallest execution time of this kernel
Max : Largest execution time of this kernel
StdDev : Standard deviation of execution time of this kernel
Category : Category of the operation
Operation : Name of the kernel
This report provides a summary of CUDA API calls, kernels and memory operations, and their execution times. Note that the “Time” column is calculated using a summation of the “Total Time” column, and represents that API call’s, kernel’s, or memory operation’s percent of the execution time of the APIs, kernels and memory operations listed, and not a percentage of the application wall or CPU execution time.
This report combines data from the cuda_api_sum, cuda_gpu_kern_sum, and
cuda_gpu_mem_size_sum reports. It is very similar to profile section of
nvprof --dependency-analysis.
cuda_api_sum – CUDA API Summary#
Arguments - None
Output: All time values default to nanoseconds
Time : Percentage of “Total Time”
Total Time : Total time used by all executions of this function
Num Calls : Number of calls to this function
Avg : Average execution time of this function
Med : Median execution time of this function
Min : Smallest execution time of this function
Max : Largest execution time of this function
StdDev : Standard deviation of the time of this function
Name : Name of the function
This report provides a summary of CUDA API functions and their execution times. Note that the “Time” column is calculated using a summation of the “Total Time” column, and represents that function’s percent of the execution time of the functions listed, and not a percentage of the application wall or CPU execution time.
cuda_api_trace – CUDA API Trace#
Arguments - None
Output: All time values default to nanoseconds
Start : Timestamp when API call was made
Duration : Length of API calls
Name : API function name
Result : Return value of API call
CorrID : Correlation used to map to other CUDA calls
Pid : Process ID that made the call
Tid : Thread ID that made the call
T-Pri : Run priority of call thread
Thread Name : Name of thread that called API function
This report provides a trace record of CUDA API function calls and their execution times.
cuda_gpu_kern_gb_sum[:nvtx-name][:base|:mangled] – CUDA GPU Kernel/Grid/Block Summary#
Arguments
nvtx-name - Optional argument, if given, will prefix the kernel name with the name of the innermost enclosing NVTX range.
base - Optional argument, if given, will cause summary to be over the base name of the kernel, rather than the templated name.
mangled - Optional argument, if given, will cause summary to be over the raw mangled name of the kernel, rather than the templated name.
Note
The ability to display mangled names is a recent addition to the report file format, and requires that the profile data be captured with a recent version of Nsight Systems. Re-exporting an existing report file is not sufficient. If the raw, mangled kernel name data is not available, the default demangled names will be used.
Output: All time values default to nanoseconds
Time : Percentage of “Total Time”
Total Time : Total time used by all executions of this kernel
Instances : Number of calls to this kernel
Avg : Average execution time of this kernel
Med : Median execution time of this kernel
Min : Smallest execution time of this kernel
Max : Largest execution time of this kernel
StdDev : Standard deviation of the time of this kernel
GridXYZ : Grid dimensions for kernel launch call
BlockXYZ : Block dimensions for kernel launch call
Name : Name of the kernel
This report provides a summary of CUDA kernels and their execution times. Kernels are sorted by grid dimensions, block dimensions, and kernel name. Note that the “Time” column is calculated using a summation of the “Total Time” column, and represents that kernel’s percent of the execution time of the kernels listed, and not a percentage of the application wall or CPU execution time.
cuda_gpu_kern_sum[:nvtx-name][:base|:mangled] – CUDA GPU Kernel Summary#
Note
In recent versions of Nsight Systems, this report was expanded to include and sort by CUDA grid and block dimensions. This change was made to accommodate developers doing a certain type of optimization work. Unfortunately, this change caused an unexpected burden for developers doing a different type of optimization work. In order to service both use-cases, this report has been returned to the original form, without grid or block information. A new report, called cuda_gpu_kern_gb_sum, has been created that retains the grid and block information.
Arguments
nvtx-name - Optional argument, if given, will prefix the kernel name with the name of the innermost enclosing NVTX range.
base - Optional argument, if given, will cause summary to be over the base name of the kernel, rather than the templated name.
mangled - Optional argument, if given, will cause summary to be over the raw mangled name of the kernel, rather than the templated name.
Note
The ability to display mangled names is a recent addition to the report file format, and requires that the profile data be captured with a recent version of Nsight Systems. Re-exporting an existing report file is not sufficient. If the raw, mangled kernel name data is not available, the default demangled names will be used.
Output: All time values default to nanoseconds
Time : Percentage of “Total Time”
Total Time : Total time used by all executions of this kernel
Instances : Number of calls to this kernel
Avg : Average execution time of this kernel
Med : Median execution time of this kernel
Min : Smallest execution time of this kernel
Max : Largest execution time of this kernel
StdDev : Standard deviation of the time of this kernel
Name : Name of the kernel
This report provides a summary of CUDA kernels and their execution times. Note that the “Time” column is calculated using a summation of the “Total Time” column, and represents that kernel’s percent of the execution time of the kernels listed, and not a percentage of the application wall or CPU execution time.
cuda_gpu_mem_size_sum – CUDA GPU MemOps Summary (by Size)#
Arguments - None
Output:
Total : Total memory utilized by this operation
Count : Number of executions of this operation
Avg : Average memory size of this operation
Med : Median memory size of this operation
Min : Smallest memory size of this operation
Max : Largest memory size of this operation
StdDev : Standard deviation of the memory size of this operation
Operation : Name of the operation
This report provides a summary of GPU memory operations and the amount of memory they utilize.
cuda_gpu_mem_time_sum – CUDA GPU MemOps Summary (by Time)#
Arguments - None
Output: All time values default to nanoseconds
Time : Percentage of “Total Time”
Total Time : Total time used by all executions of this operation
Count : Number of operations to this type
Avg : Average execution time of this operation
Med : Median execution time of this operation
Min : Smallest execution time of this operation
Max : Largest execution time of this operation
StdDev : Standard deviation of execution time of this operation
Operation : Name of the memory operation
This report provides a summary of GPU memory operations and their execution times. Note that the “Time” column is calculated using a summation of the “Total Time” column, and represents that operation’s percent of the execution time of the operations listed, and not a percentage of the application wall or CPU execution time.
cuda_gpu_sum[:nvtx-name][:base|:mangled] – CUDA GPU Summary (Kernels/MemOps)#
Arguments
nvtx-name - Optional argument, if given, will prefix the kernel name with the name of the innermost enclosing NVTX range.
base - Optional argument, if given, will cause summary to be over the base name of the kernel, rather than the templated name.
mangled - Optional argument, if given, will cause summary to be over the raw mangled name of the kernel, rather than the templated name.
Note
The ability to display mangled names is a recent addition to the report file format, and requires that the profile data be captured with a recent version of Nsight Systems. Re-exporting an existing report file is not sufficient. If the raw, mangled kernel name data is not available, the default demangled names will be used.
Output: All time values default to nanoseconds
Time : Percentage of “Total Time”
Total Time : Total time used by all executions of this kernel
Instances : Number of executions of this kernel
Avg : Average execution time of this kernel
Med : Median execution time of this kernel
Min : Smallest execution time of this kernel
Max : Largest execution time of this kernel
StdDev : Standard deviation of execution time of this kernel
Category : Category of the operation
Operation : Name of the kernel
This report provides a summary of CUDA kernels and memory operations, and their execution times. Note that the “Time” column is calculated using a summation of the “Total Time” column, and represents that kernel’s or memory operation’s percent of the execution time of the kernels and memory operations listed, and not a percentage of the application wall or CPU execution time.
This report combines data from the cuda_gpu_kern_sum and
cuda_gpu_mem_time_sum reports. This report is very similar to output of
the command nvprof --print-gpu-summary.
cuda_gpu_trace[:nvtx-name][:base|:mangled] – CUDA GPU Trace#
Arguments
nvtx-name - Optional argument, if given, will prefix the kernel name with the name of the innermost enclosing NVTX range.
base - Optional argument, if given, will display the base name of the kernel, rather than the templated name.
mangled - Optional argument, if given, will display the raw mangled name of the kernel, rather than the templated name.
Note
The ability to display mangled names is a recent addition to the report file format, and requires that the profile data be captured with a recent version of Nsight Systems. Re-exporting an existing report file is not sufficient. If the raw, mangled kernel name data is not available, the default demangled names will be used.
Output: All time values default to nanoseconds
Start : Timestamp of start time
Duration : Length of event
CorrId : Correlation ID
GrdX, GrdY, GrdZ : Grid values
BlkX, BlkY, BlkZ : Block values
Reg/Trd : Registers per thread
StcSMem : Size of Static Shared Memory
DymSMem : Size of Dynamic Shared Memory
Bytes : Size of memory operation
Throughput : Memory throughput
SrcMemKd : Memcpy source memory kind or memset memory kind
DstMemKd : Memcpy destination memory kind
Device : GPU device name and ID
Ctx : Context ID
GreenCtx: Green context ID
Strm : Stream ID
Name : Trace event name
This report displays a trace of CUDA kernels and memory operations. Items are sorted by start time.
cuda_kern_exec_sum[:nvtx-name][:base|:mangled] – CUDA Kernel Launch & Exec Time Summary#
Arguments
nvtx-name - Optional argument, if given, will prefix the kernel name with the name of the innermost enclosing NVTX range.
base - Optional argument, if given, will cause summary to be over the base name of the kernel, rather than the templated name.
mangled - Optional argument, if given, will cause summary to be over the raw mangled name of the kernel, rather than the templated name.
Note
The ability to display mangled names is a recent addition to the report file format, and requires that the profile data be captured with a recent version of Nsight Systems. Re-exporting an existing report file is not sufficient. If the raw, mangled kernel name data is not available, the default demangled names will be used.
Output: All time values default to nanoseconds
PID : Process ID that made kernel launch call
TID : Thread ID that made kernel launch call
DevId : CUDA Device ID that executed kernel (which GPU)
Count : Number of kernel records
QCount : Number of kernel records with positive queue time
Average, Median, Minimum, Maximum, and Standard Deviation for:
TAvg, TMed, TMin, TMax, TStdDev : Total time
AAvg, AMed, AMin, AMax, AStdDev : API time
QAvg, QMed, QMin, QMax, QStdDev : Queue time
KAvg, KMed, KMin, KMax, KStdDev : Kernel time
API Name : Name of CUDA API call used to launch kernel
Kernel Name : Name of CUDA Kernel
This report provides a summary of the launch and execution times of CUDA kernels. The launch and execution is broken down into three phases: “API time,” the execution time of the CUDA API call on the CPU used to launch the kernel; “Queue time,” the time between the launch call and the kernel execution; and “Kernel time,” the kernel execution time on the GPU. The “total time” is not a just sum of the other times, as the phases sometimes overlap. Rather, the total time runs from the start of the API call to end of the API call or the end of the kernel execution, whichever is later.
The reported queue time is measured from the end of the API call to the start of the kernel execution. The actual queue time is slightly longer, as the kernel is enqueue somewhere in the middle of the API call, and not in the final nanosecond of function execution. Due to this delay, it is possible for kernel execution to start before the CUDA launch call returns. In these cases, no queue time will be reported. Only kernel launches with positive queue times are included in the queue average, minimum, maximum, and standard deviation calculations. The “QCount” column indicates how many launches had positive queue times (and how many launches were involved in calculating the queue time statistics). Subtracting “QCount” from “Count” will indicate how many kernels had no queue time.
Be aware that having a queue time is not inherently bad. Queue times indicate that the GPU was busy running other tasks when the new kernel was scheduled for launch. If every kernel launch is immediate, without any queue time, that _may_ indicate an idle GPU with poor utilization. In terms of performance optimization, it should not necessarily be a goal to eliminate queue time.
cuda_kern_exec_trace[:nvtx-name][:base|:mangled] – CUDA Kernel Launch & Exec Time Trace#
Arguments
nvtx-name - Optional argument, if given, will prefix the kernel name with the name of the innermost enclosing NVTX range.
base - Optional argument, if given, will cause summary to be over the base name of the kernel, rather than the templated name.
mangled - Optional argument, if given, will cause summary to be over the raw mangled name of the kernel, rather than the templated name.
Note: the ability to display mangled names is a recent addition to the report file format, and requires that the profile data be captured with a recent version of Nsight Systems. Re-exporting an existing report file is not sufficient. If the raw, mangled kernel name data is not available, the default demangled names will be used.
Output: All time values default to nanoseconds
API Start : Start timestamp of CUDA API launch call
API Dur : Duration of CUDA API launch call
Queue Start : Start timestamp of queue wait time, if it exists
Queue Dur : Duration of queue wait time, if it exists
Kernel Start : Start timestamp of CUDA kernel
Kernel Dur : Duration of CUDA kernel
Total Dur : Duration from API start to kernel end
PID : Process ID that made kernel launch call
TID : Thread ID that made kernel launch call
DevId : CUDA Device ID that executed kernel (which GPU)
API Function : Name of CUDA API call used to launch kernel
GridXYZ : Grid dimensions for kernel launch call
BlockXYZ : Block dimensions for kernel launch call
Kernel Name : Name of CUDA Kernel
This report provides a trace of the launch and execution time of each CUDA kernel. The launch and execution is broken down into three phases: “API time,” the execution time of the CUDA API call on the CPU used to launch the kernel; “Queue time,” the time between the launch call and the kernel execution; and “Kernel time,” the kernel execution time on the GPU. The “total time” is not a just sum of the other times, as the phases sometimes overlap. Rather, the total time runs from the start of the API call to end of the API call or the end of the kernel execution, whichever is later.
The reported queue time is measured from the end of the API call to the start of the kernel execution. The actual queue time is slightly longer, as the kernel is enqueue somewhere in the middle of the API call, and not in the final nanosecond of function execution. Due to this delay, it is possible for kernel execution to start before the CUDA launch call returns. In these cases, no queue times will be reported.
Be aware that having a queue time is not inherently bad. Queue times indicate that the GPU was busy running other tasks when the new kernel was scheduled for launch. If every kernel launch is immediate, without any queue time, that _may_ indicate an idle GPU with poor utilization. In terms of performance optimization, it should not necessarily be a goal to eliminate queue time.
dx11_pix_sum – DX11 PIX Range Summary#
Arguments - None
Output: All time values default to nanoseconds
Time : Percentage of “Total Time”
Total Time : Total time used by all instances of this range
Instances : Number of instances of this range
Avg : Average execution time of this range
Med : Median execution time of this rage
Min : Smallest execution time of this range
Max : Largest execution time of this range
StdDev : Standard deviation of execution time of this range
Range : Name of the range
This report provides a summary of D3D11 PIX CPU debug markers, and their execution times. Note that the “Time” column is calculated using a summation of the “Total Time” column, and represents that range’s percent of the execution time of the ranges listed, and not a percentage of the application wall or CPU execution time.
dx12_gpu_marker_sum – DX12 GPU Command List PIX Ranges Summary#
Arguments - None
Output: All time values default to nanoseconds
Time : Percentage of “Total Time”
Total Time : Total time used by all instances of this range
Instances : Number of instances of this range
Avg : Average execution time of this range
Med : Median execution time of this range
Min : Smallest execution time of this range
Max : Largest execution time of this range
StdDev : Standard deviation of execution time of this range
Range : Name of the range
This report provides a summary of DX12 PIX GPU command list debug markers, and their execution times. Note that the “Time” column is calculated using a summation of the “Total Time” column, and represents that range’s percent of the execution time of the ranges listed, and not a percentage of the application wall or CPU execution time.
dx12_pix_sum – DX12 PIX Range Summary#
Arguments - None
Output: All time values default to nanoseconds
Time : Percentage of “Total Time”
Total Time : Total time used by all instances of this range
Instances : Number of instances of this range
Avg : Average execution time of this range
Med : Median execution time of this range
Min : Smallest execution time of this range
Max : Largest execution time of this range
StdDev : Standard deviation of execution time of this range
Range : Name of the range
This report provides a summary of D3D12 PIX CPU debug markers, and their execution times. Note that the “Time” column is calculated using a summation of the “Total Time” column, and represents that range’s percent of the execution time of the ranges listed, and not a percentage of the application wall or CPU execution time.
mpi_event_sum – MPI Event Summary#
Arguments - None
Output: All time values default to nanoseconds
Time : Percentage of “Total Time”
Total Time : Total time used by all instances of this event
Instances : Number of instances of this event
Avg : Average execution time of this event
Med : Median execution time of this event
Min : Smallest execution time of this event
Max : Largest execution time of this event
StdDev : Standard deviation of execution time of this event
Source: Original source class of event data
Name : Name of MPI event
This report provides a summary of all recorded MPI events. Note that the “Time” column is calculated using a summation of the “Total Time” column, and represents that event’s percent of the total execution time of the listed events, and not a percentage of the application wall or CPU execution time.
mpi_event_trace – MPI Event Trace#
Arguments - None
Output: All time values default to nanoseconds
Start : Start timestamp of event
End : End timestamp of event
Duration : Duration of event
Event : Name of event type
Pid : Process Id that generated the event
Tid : Thread Id that generated the event
Tag : MPI message tag
Rank : MPI Rank that generated event
PeerRank : Other MPI rank of send or receive type events
RootRank : Root MPI rank for broadcast type events
Size : Size of message for uni-directional operations (send & recv)
CollSendSize : Size of sent message for collective operations
CollRecvSize : Size of received message for collective operations
This report provides a trace record of all recorded MPI events.
Note that MPI_Sendrecv events with different rank, tag, or size values are broken up into two separate report rows, one reporting the send, and one reporting the receive. If only one row exists, the rank, tag, and size can assumed to be the same.
mpi_msg_size_sum – MPI Message Size Summary#
Arguments - None
Output: Message size values are in bytes
Total Message Volume : Aggregated message size from all instances of this API function
Instances : Number of instances of this API function
Avg : Average message size of this API function
Med : Median message size of this API function
Min : Smallest message size of this API function
Max : Largest message size of this API function
StdDev : Standard deviation of message size for this API function
Source : Message source (p2p, coll_send, coll_recv)
Name : Name of the MPI API function
This report provides a message size summary of all collective and point-to-point MPI calls.
Note that for MPI collectives the report presents the sent message with Source
equal to coll_send and the received message with Source equal to coll_recv.
network_congestion[:ticks_threshold=<ticks_per_ms>] – Network Devices Congestion#
Arguments
ticks_threshold=<ticks_per_ms> - Threshold in ticks/ms above which we report congestion. Default is 10000.
Output: All time values default to nanoseconds
Start : Start timestamp of congestion interval
End : End timestamp of congestion interval
Duration : Duration of congestion interval
Send wait rate: Rate of congestion during the interval
GUID : The device GUID
Name : The device name
This report displays congestion events with a high send wait rate. By default, only events with a send wait rate above 10000 ticks/ms are shown, but a custom threshold value can be set.
Each event defines a period of time when the device experienced some level of congestion. The level of congestion is defined by the send wait rate, given in time ticks per millisecond (ticks/ms). The specific duration of a tick is device specific, but can be assumed to be nanoseconds in scale. Congestion is measured by counting the number of ticks during which the port had data to transmit, but no data was sent because of insufficient credits or because of lack of arbitration. The presented value of send wait rate is the amount of ticks counted during an event, normalized over the event’s duration. Higher send wait rate values indicate more congestion.
Because the specific duration of a tick is device dependent, analysis should focus on the relative send wait rates of events generated by the same device. Comparing absolute send wait rates across devices is only meaningful if the time tick duration is known to be similar.
For IB Switch metrics, we do not present the device name, only the GUID.
nvtx_gpu_proj_sum – NVTX GPU Projection Summary#
Arguments - None
Output: All time values default to nanoseconds
Range : Name of the NVTX range
Style : Range style; Start/End or Push/Pop
Total Proj Time: Total projected time used by all instances of this range name
Total Range Time: Total original NVTX range time used by all instances of this range name
Range Instances : Number of instances of this range
Proj Avg : Average projected time for this range
Proj Med : Median projected time for this range
Proj Min : Minimum projected time for this range
Proj Max : Maximum projected time for this range
Proj StdDev : Standard deviation of projected times for this range
Total GPU Ops : Total number of GPU ops
Avg GPU Ops : Average number of GPU ops
Avg Range Lvl : Average range stack depth
Avg Num Child : Average number of children ranges
This report provides a summary of NVTX time ranges projected from the CPU to the GPU. Each NVTX range contains one or more GPU operations. A GPU operation is considered to be “contained” by the NVTX range if the CUDA API call used to launch the operation is within the NVTX range. Only ranges that start and end on the same thread are taken into account.
The projected range will have the start timestamp of the start of the first enclosed GPU operation and the end timestamp of the end of the last enclosed GPU operation. This report then summarizes all the range instances by name and style. Note that in cases when one NVTX range might enclose another, the time of the child(ren) range(s) is not subtracted from the parent range. This is because the projected times may not strictly overlap like the original NVTX range times do. As such, the total projected time of all ranges might exceed the total sampling duration.
nvtx_gpu_proj_trace – NVTX GPU Projection Trace#
Arguments - None
Output: All time values default to nanoseconds
Name : Name of the NVTX range
Projected Start : Projected range start timestamp
Projected Duration : Projected range duration
Orig Start : Original NVTX range start timestamp
Orig Duration : Original NVTX range duration
Style : Range style; Start/End or Push/Pop
PID : Process ID
TID : Thread ID
NumGPUOps : Number of enclosed GPU operations
Lvl : Stack level, starts at 0
NumChild : Number of children ranges
RangeId : Arbitrary ID for range
ParentId : Range ID of the enclosing range
RangeStack : Range IDs that make up the push/pop stack
This report provides a trace of NVTX time ranges projected from the CPU onto the GPU. Each NVTX range contains one or more GPU operations. A GPU operation is considered to be “contained” by an NVTX range if the CUDA API call used to launch the operation is within the NVTX range. Only ranges that start and end on the same thread are taken into account.
The projected range will have the start timestamp of the first enclosed GPU operation and the end timestamp of the last enclosed GPU operation, as well as the stack state and relationship to other NVTX ranges.
nvtx_kern_sum[:base|:mangled] – NVTX Range Kernel Summary#
Arguments
base - Optional argument, if given, will cause summary to be over the base name of the CUDA kernel, rather than the templated name.
mangled - Optional argument, if given, will cause summary to be over the raw mangled name of the kernel, rather than the templated name.
Note
The ability to display mangled names is a recent addition to the report file format, and requires that the profile data be captured with a recent version of Nsight Systems. Re-exporting an existing report file is not sufficient. If the raw, mangled kernel name data is not available, the default demangled names will be used.
Output: All time values default to nanoseconds
NVTX Range : Name of the range
Style : Range style; Start/End or Push/Pop
PID : Process ID for this set of ranges and kernels
TID : Thread ID for this set of ranges and kernels
NVTX Inst : Number of NVTX range instances
Kern Inst : Number of CUDA kernel instances
Total Time : Total time used by all kernel instances of this range
Avg : Average execution time of the kernel
Med : Median execution time of the kernel
Min : Smallest execution time of the kernel
Max : Largest execution time of the kernel
StdDev : Standard deviation of the execution time of the kernel
Kernel Name : Name of the kernel
This report provides a summary of CUDA kernels, grouped by NVTX ranges. To compute this summary, each kernel is matched to one or more containing NVTX range in the same process and thread ID. A kernel is considered to be “contained” by an NVTX range if the CUDA API call used to launch the kernel is within the NVTX range. The actual execution of the kernel may last longer than the NVTX range. A specific kernel instance may be associated with more than one NVTX range if the ranges overlap. For example, if a kernel is launched inside a stack of push/pop ranges, the kernel is considered to be “contained” by all of the ranges on the stack, not just the deepest range. This becomes very confusing if NVTX ranges appear inside other NVTX ranges of the same name.
Once each kernel is associated to one or more NVTX range(s), the list of ranges and kernels grouped by range name, kernel name, and PID/TID. A summary of the kernel instances and their execution times is then computed. The “NVTX Inst” column indicates how many NVTX range instances contained this kernel, while the “Kern Inst” column indicates the number of kernel instances in the summary line.
nvtx_pushpop_sum – NVTX Push/Pop Range Summary#
Arguments - None
Output: All time values given in nanoseconds
Time : Percentage of “Total Time”
Total Time : Total time used by all instances of this range
Instances : Number of instances of this range
Avg : Average execution time of this range
Med : Median execution time of this range
Min : Smallest execution time of this range
Max : Largest execution time of this range
StdDev : Standard deviation of execution time of this range
Range : Name of the range
This report provides a summary of NV Tools Extensions Push/Pop Ranges and their execution times. Note that the “Time” column is calculated using a summation of the “Total Time” column, and represents that range’s percent of the execution time of the ranges listed, and not a percentage of the application wall or CPU execution time.
nvtx_pushpop_trace – NVTX Push/Pop Range Trace#
Arguments - None
Output: All time values default to nanoseconds
Start : Range start timestamp
End : Range end timestamp
Duration : Range duration
DurChild : Duration of all child ranges
DurNonChild : Duration of this range minus child ranges
Name : Name of the NVTX range
PID : Process ID
TID : Thread ID
Lvl : Stack level, starts at 0
NumChild : Number of children ranges
RangeId : Arbitrary ID for range
ParentId : Range ID of the enclosing range
RangeStack : Range IDs that make up the push/pop stack
NameTree : Range name prefixed with level indicator
This report provides a trace of NV Tools Extensions Push/Pop Ranges, their execution time, stack state, and relationship to other push/pop ranges.
nvtx_startend_sum – NVTX Start/End Range Summary#
Arguments - None
Output: All time values default to nanoseconds
Time : Percentage of “Total Time”
Total Time : Total time used by all instances of this range
Instances : Number of instances of this range
Avg : Average execution time of this range
Med : Median execution time of this range
Min : Smallest execution time of this range
Max : Largest execution time of this range
StdDev : Standard deviation of execution time of this range
Range : Name of the range
This report provides a summary of NV Tools Extensions Start/End Ranges and their execution times. Note that the “Time” column is calculated using a summation of the “Total Time” column, and represents that range’s percent of the execution time of the ranges listed, and not a percentage of the application wall or CPU execution time.
nvtx_sum – NVTX Range Summary#
Arguments - None
Output: All time values default to nanoseconds
Time : Percentage of “Total Time”
Total Time : Total time used by all instances of this range
Instances : Number of instances of this range
Avg : Average execution time of this range
Med : Median execution time of this range
Min : Smallest execution time of this range
Max : Largest execution time of this range
StdDev : Standard deviation of execution time of this range
Style : Range style; Start/End or Push/Pop
Range : Name of the range
This report provides a summary of NV Tools Extensions Start/End and Push/Pop Ranges, and their execution times. Note that the “Time” column is calculated using a summation of the “Total Time” column, and represents that range’s percent of the execution time of the ranges listed, and not a percentage of the application wall or CPU execution time.
nvvideo_api_sum – NvVideo API Summary#
Arguments - None
Output: All time values default to nanoseconds
Time : Percentage of “Total Time”
Total Time : Total time used by all executions of this function
Num Calls : Number of calls to this function
Avg : Average execution time of this function
Med : Median execution time of this function
Min : Smallest execution time of this function
Max : Largest execution time of this function
StdDev : Standard deviation of the time of this function
Event Type : Which API this function belongs to
Name : Name of the function
This report provides a summary of NvVideo API functions and their execution times. Note that the “Time” column is calculated using a summation of the “Total Time” column, and represents that function’s percent of the execution time of the functions listed, and not a percentage of the application wall or CPU execution time.
openacc_sum – OpenACC Summary#
Arguments - None
Output: All time values default to nanoseconds
Time : Percentage of “Total Time”
Total Time : Total time used by all executions of event type
Count : Number of event type
Avg : Average execution time of event type
Med : Median execution time of event type
Min : Smallest execution time of event type
Max : Largest execution time of event type
StdDev : Standard deviation of execution time of event type
Name : Name of the event
This report provides a summary of OpenACC events and their execution times. Note that the “Time” column is calculated using a summation of the “Total Time” column, and represents that event type’s percent of the execution time of the events listed, and not a percentage of the application wall or CPU execution time.
opengl_khr_gpu_range_sum – OpenGL KHR_debug GPU Range Summary#
Arguments - None
Output: All time values default to nanoseconds
Time : Percentage of “Total Time”
Total Time : Total time used by all instances of this range
Instances : Number of instances of this range
Avg : Average execution time of this range
Med : Median execution time of this range
Min : Smallest execution time of this range
Max : Largest execution time of this range
StdDev : Standard deviation of execution time of this range
Range : Name of the range
This report provides a summary of OpenGL KHR_debug GPU PUSH/POP debug Ranges, and their execution times. Note that the “Time” column is calculated using a summation of the “Total Time” column, and represents that range’s percent of the execution time of the ranges listed, and not a percentage of the application wall or CPU execution time.
opengl_khr_range_sum – OpenGL KHR_debug Range Summary#
Arguments - None
Output: All time values default to nanoseconds
Time : Percentage of “Total Time”
Total Time : Total time used by all instances of this range
Instances : Number of instances of this range
Avg : Average execution time of this range
Med : Median execution time of this range
Min : Smallest execution time of this range
Max : Largest execution time of this range
StdDev : Standard deviation of execution time of this range
Range : Name of the range
This report provides a summary of OpenGL KHR_debug CPU PUSH/POP debug Ranges, and their execution times. Note that the “Time” column is calculated using a summation of the “Total Time” column, and represents that range’s percent of the execution time of the ranges listed, and not a percentage of the application wall or CPU execution time.
openmp_sum – OpenMP Summary#
Arguments - None
Output: All time values default to nanoseconds
Time : Percentage of “Total Time”
Total Time : Total time used by all executions of event type
Count : Number of event type
Avg : Average execution time of event type
Med : Median execution time of event type
Min : Smallest execution time of event type
Max : Largest execution time of event type
StdDev : Standard deviation of execution time of event type
Name : Name of the event
This report provides a summary of OpenMP events and their execution times. Note that the “Time” column is calculated using a summation of the “Total Time” column, and represents that event type’s percent of the execution time of the events listed, and not a percentage of the application wall or CPU execution time.
osrt_sum – OS Runtime Summary#
Arguments - None
Output: All time values default to nanoseconds
Time : Percentage of “Total Time”
Total Time : Total time used by all executions of this function
Num Calls : Number of calls to this function
Avg : Average execution time of this function
Med : Median execution time of this function
Min : Smallest execution time of this function
Max : Largest execution time of this function
StdDev : Standard deviation of execution time of this function
Name : Name of the function
This report provides a summary of operating system functions and their execution times. Note that the “Time” column is calculated using a summation of the “Total Time” column, and represents that function’s percent of the execution time of the functions listed, and not a percentage of the application wall or CPU execution time.
syscall_sum – Syscall Summary#
Arguments - None
Output: All time values default to nanoseconds
Time : Percentage of “Total Time”
Total Time : Total time used by all executions of this syscall
Num Calls : Number of calls to this syscall
Avg : Average execution time of this syscall
Med : Median execution time of this syscall
Min : Smallest execution time of this syscall
Max : Largest execution time of this syscall
StdDev : Standard deviation of execution time of this syscall
Name : Name of the syscall
This report provides a summary of syscalls and their execution times. Note that the “Time” column is calculated using a summation of the “Total Time” column, and represents that syscall’s percent of the execution time of the syscalls listed, and not a percentage of the application wall or CPU execution time.
um_cpu_page_faults_sum – Unified Memory CPU Page Faults Summary#
Arguments - None
Output:
CPU Page Faults : Number of CPU page faults that occurred CPU Instruction Address : Address of the CPU instruction that caused the CPU page faults
This report provides a summary of CPU page faults for unified memory.
um_sum[:rows=<limit>] – Unified Memory Analysis Summary#
Arguments
rows=<limit> - Maximum number of rows returned by the query. Default is 10.
Output:
Virtual Address : Virtual base address of the page(s) being transferred
HtoD Migration Size : Bytes transferred from Host to Device
DtoH Migration Size : Bytes transferred from Device to Host
CPU Page Faults : Number of CPU page faults that occurred for the virtual base address
GPU Page Faults : Number of GPU page faults that occurred for the virtual base address
Migration Throughput : Bytes transferred per second
This report provides a summary of data migrations for unified memory.
um_total_sum – Unified Memory Totals Summary#
Arguments - None
Output:
Total HtoD Migration Size : Total bytes transferred from host to device
Total DtoH Migration Size : Total bytes transferred from device to host
Total CPU Page Faults : Total number of CPU page faults that occurred
Total GPU Page Faults : Total number of GPU page faults that occurred
Minimum Virtual Address : Minimum value of the virtual address range for the pages transferred
Maximum Virtual Address : Maximum value of the virtual address range for the pages transferred
This report provides a summary of all the page faults for unified memory.
vulkan_api_sum – Vulkan API Summary#
Arguments - None
Output: All time values default to nanoseconds
Time : Percentage of “Total Time”
Total Time : Total time used by all executions of this function
Num Calls: Number of calls to this function
Avg : Average execution time of this function
Med : Median execution time of this function
Min : Smallest execution time of this function
Max : Largest execution time of this function
StdDev : Standard deviation of the time of this function
Name : Name of the function
This report provides a summary of Vulkan API functions and their execution times. Note that the “Time” column is calculated using a summation of the “Total Time” column, and represents that function’s percent of the execution time of the functions listed, and not a percentage of the application wall or CPU execution time.
vulkan_api_trace – Vulkan API Trace#
Arguments - None
Output: All time values default to nanoseconds
Start : Timestamp when API call was made
Duration : Length of API calls
Name : API function name
Event Class : Vulkan trace event type
Context : Trace context ID
CorrID : Correlation used to map to other Vulkan calls
Pid : Process ID that made the call
Tid : Thread ID that made the call
T-Pri : Run priority of call thread
Thread Name : Name of thread that called API function
This report provides a trace record of Vulkan API function calls and their execution times.
vulkan_gpu_marker_sum – Vulkan GPU Range Summary#
Arguments - None
Output: All time values default to nanoseconds
Time : Percentage of “Total Time”
Total Time : Total time used by all instances of this range
Instances : Number of instances of this range
Avg : Average execution time of this range
Med : Median execution time of this range
Min : Smallest execution time of this range
Max : Largest execution time of this range
StdDev : Standard deviation of execution time of this range
Range : Name of the range
This report provides a summary of Vulkan GPU debug markers, and their execution times. Note that the “Time” column is calculated using a summation of the “Total Time” column, and represents that range’s percent of the execution time of the ranges listed, and not a percentage of the application wall or CPU execution time.
vulkan_marker_sum – Vulkan Range Summary#
Arguments - None
Output: All time values default to nanoseconds
Time : Percentage of “Total Time”
Total Time : Total time used by all instances of this range
Instances : Number of instances of this range
Avg : Average execution time of this range
Med : Median execution time of this range
Min : Smallest execution time of this range
Max : Largest execution time of this range
StdDev : Standard deviation of execution time of this range
Range : Name of the range
This report provides a summary of Vulkan debug markers on the CPU, and their execution times. Note that the “Time” column is calculated using a summation of the “Total Time” column, and represents that range’s percent of the execution time of the ranges listed, and not a percentage of the application wall or CPU execution time.
wddm_queue_sum – WDDM Queue Utilization Summary#
Arguments - None
Output: All time values default to nanoseconds
Utilization : Percent of time when queue was not empty
Instances : Number of events
Avg : Average event duration
Med : Median event duration
Min : Minimum event duration
Max : Maximum event duration
StdDev : Standard deviation of event durations
Name : Event name
Q Type : Queue type ID
Q Name : Queue type name
PID : Process ID associated with event
GPU ID : GPU index
Context : WDDM context of queue
Engine : Engine type ID
Node Ord : WDDM node ordinal ID
This report provides a summary of the WDDM queue utilization. The utilization is calculated by comparing the amount of time when the queue had one or more active events to total duration, as defined by the minimum and maximum event time for a given Process ID (regardless of the queue context).
Report Formatters Shipped With Nsight Systems#
The following formats are available in Nsight Systems
Column#
Usage:
column[:nohdr][:nolimit][:nofmt][:<width>[:<width>]...]
Arguments
nohdr: Do not display the header.nolimit: Remove 100 character limit from auto-width columns Note: This can result in extremely wide columns.nofmt: Do not reformat numbers.<width>...: Define the explicit width of one or more columns. If the value.is given, the column will auto-adjust. If a width of 0 is given, the column will not be displayed.
The column formatter presents data in vertical text columns. It is primarily designed to be a human-readable format for displaying data on a console display.
Text data will be left-justified, while numeric data will be right-justified. If the data overflows the available column width, it will be marked with a “…” character, to indicate the data values were clipped. Clipping always occurs on the right-hand side, even for numeric data.
Numbers will be reformatted to make easier to visually scan and understand. This
includes adding thousands-separators. This process requires that the string
representation of the number is converted into its native representation
(integer or floating point) and then converted back into a string representation
to print. This conversion process attempts to preserve elements of number
presentation, such as the number of decimal places, or the use of scientific
notation, but the conversion is not always perfect (the number should always be
the same, but the presentation may not be). To disable the reformatting process,
use the argument nofmt.
If no explicit width is given, the columns auto-adjust their width based off the header size and the first 100 lines of data. This auto-adjustment is limited to a maximum width of 100 characters. To allow larger auto-width columns, pass the initial argument nolimit. If the first 100 lines do not calculate the correct column width, it is suggested that explicit column widths be provided.
Table#
Usage:
table[:nohdr][:nolimit][:nofmt][:<width>[:<width>]...]
Arguments
nohdr: Do not display the header.nolimit: Remove 100 character limit from auto-width columns Note: This can result in extremely wide columns.nofmt: Do not reformat numbers.<width>...: Define the explicit width of one or more columns. If the value.is given, the column will auto-adjust. If a width of 0 is given, the column will not be displayed.
The table formatter presents data in vertical text columns inside text boxes. Other than the lines between columns, it is identical to the column formatter.
CSV#
Usage:
csv[:nohdr]
Arguments
nohdr: Do not display the header.
The csv formatter outputs data as comma-separated values. This format is commonly used for import into other data applications, such as spread-sheets and databases.
There are many different standards for CSV files. Most differences are in how escapes are handled, meaning data values that contain a comma or space.
This CSV formatter will escape commas by surrounding the whole value in double-quotes.
TSV#
Usage:
tsv[:nohdr][:esc]
Arguments
nohdr: Do not display the header.esc: escape tab characters, rather than removing them.
The TSV formatter outputs data as tab-separated values. This format is sometimes used for import into other data applications, such as spreadsheets and databases.
Most TSV import/export systems disallow the tab character in data values. The formatter will normally replace any tab characters with a single space. If the esc argument has been provided, any tab characters will be replaced with the literal characters “t”.
JSON#
Usage:
json
Arguments: no arguments
The JSON formatter outputs data as an array of JSON objects. Each object represents one line of data, and uses the column names as field labels. All objects have the same fields. The formatter attempts to recognize numeric values, as well as JSON keywords, and converts them. Empty values are passed as an empty string (and not nil, or as a missing field).
At this time the formatter does not escape quotes, so if a data value includes double-quotation marks, it will corrupt the JSON file.
HDoc#
hdoc[:title=<title>][:css=<URL>]
Arguments:
title: string for HTML document title.css: URL of CSS document to include.
The HDoc formatter generates a complete, verifiable (mostly), standalone HTML
document. It is designed to be opened in a web browser, or included in a larger
document via an <iframe>.
HTable#
Usage:
htable
Arguments: no arguments
The HTable formatter outputs a raw HTML <table> without any of the surrounding
HTML document. It is designed to be included into a larger HTML document.
Although most web browsers will open and display the document, it is better to
use the HDoc format for this type of use.
Expert Systems Analysis#
The Nsight Systems expert system is a feature aimed at automatic detection of performance optimization opportunities in an application’s profile. It uses a set of predefined rules to determine if the application has known bad patterns.
Using Expert System from the CLI#
usage:
nsys [global-options] analyze [options]
       [nsys-rep-or-sqlite-file]
If a .nsys-rep file is given as the input file and there is no .sqlite file with the same name in the same directory, it will be generated.
Note
The Expert System view in the GUI will give you the equivalent command line.
Using Expert System from the GUI#
The Expert System View can be found in the same drop-down as the Events View. If there is no .sqlite file with the same name as the .nsys-rep file in the same directory, it will be generated.
The Expert System View has the following components:
Drop-down to select the rule to be run.
Rule description and advice summary.
CLI command that will give the same result.
Table containing results of running the rule.
Settings button that allows users to specify the rule’s arguments.
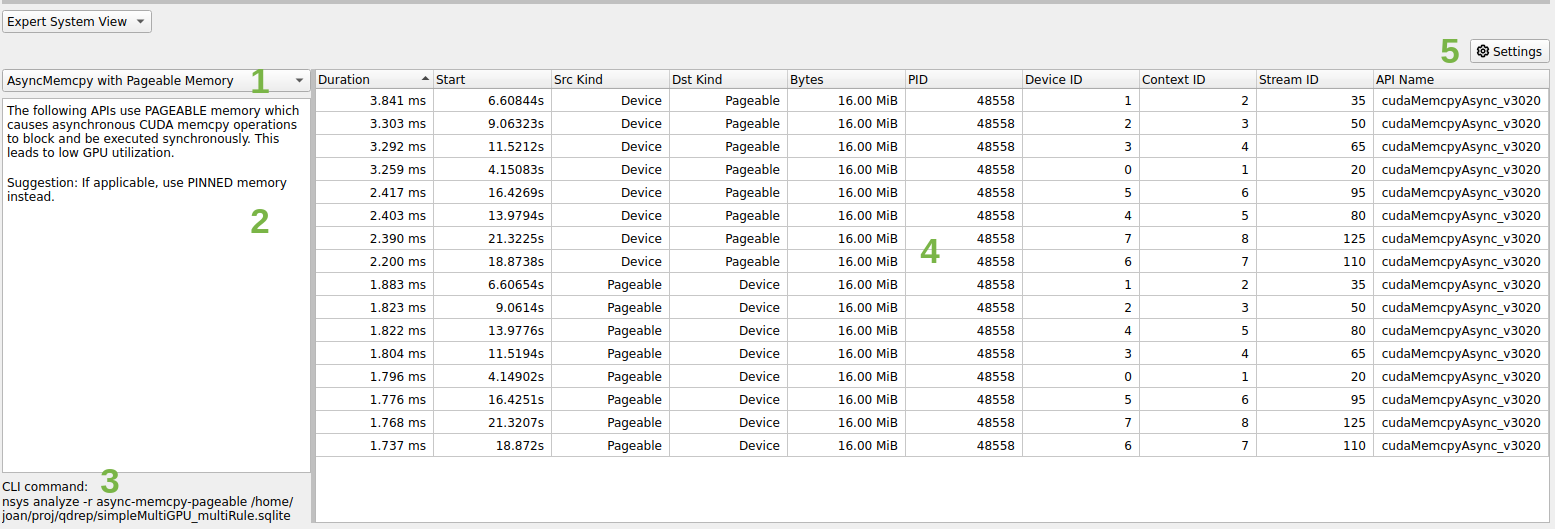
A context menu is available to correlate the table entry with the timeline. The options are the same as the Events View:
Zoom to Selected on Timeline (ctrl+double-click)
The highlighting is not supported for rules that do not return an event but rather an arbitrary time range (e.g., GPU utilization rules).
The CLI and GUI share the same rule scripts and messages. There might be some formatting differences between the output table in GUI and CLI.
Expert System Rules#
Rules are scripts that run on the SQLite DB output from Nsight Systems to find common improvable usage patterns.
Each rule has an advice summary with explanation of the problem found and suggestions to address it. Only the top 50 results are displayed by default.
There are currently six rules in the expert system. They are described below. Additional rules will be made available in a future version of Nsight Systems.
CUDA Synchronous Operation Rules#
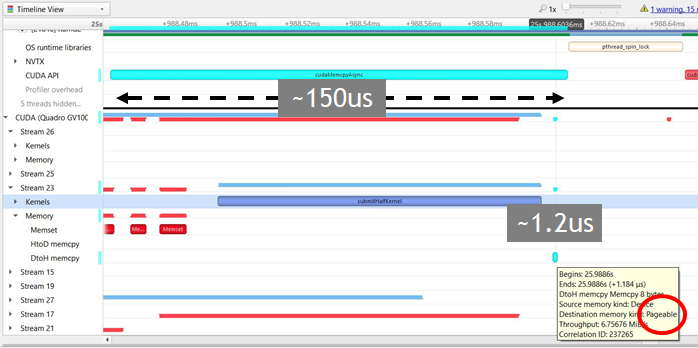
Asynchronous memcpy with pageable memory
This rule identifies asynchronous memory transfers that end up becoming synchronous if the memory is pageable. This rule is not applicable for Nsight Systems Embedded Platforms Edition
Suggestion: If applicable, use pinned memory instead
Synchronous Memcpy
This rule identifies synchronous memory transfers that block the host.
Suggestion: Use cudaMemcpy*Async APIs instead.
Synchronous Memset
This rule identifies synchronous memset operations that block the host.
Suggestion: Use cudaMemset*Async APIs instead.
Synchronization APIs
This rule identifies synchronization APIs that block the host until all issued CUDA calls are complete.
Suggestions: Avoid excessive use of synchronization. Use asynchronous CUDA event calls, such as cudaStreamWaitEvent and cudaEventSynchronize, to prevent host synchronization.
GPU Low Utilization Rules#
Nsight Systems determines GPU utilization based on API trace data in the collection. Current rules consider CUDA, Vulkan, DX12, and OpenGL API use of the GPU.
GPU Starvation
This rule identifies time ranges where a GPU is idle for longer than 500ms. The threshold is adjustable.
Suggestions: Use CPU sampling data, OS Runtime blocked state backtraces, and/or OS Runtime APIs related to thread synchronization to understand if a sluggish or blocked CPU is causing the gaps. Add NVTX annotations to CPU code to understand the reason behind the gaps.
Notes: For each process, each GPU is examined, and gaps are found within the time range that starts with the beginning of the first GPU operation on that device and ends with the end of the last GPU operation on that device. GPU gaps that cannot be addressed by the user are excluded. This includes:
Profiling overhead in the middle of a GPU gap.
The initial gap in the report that is seen before the first GPU operation.
The final gap that is seen after the last GPU operation.
GPU Low Utilization
This rule identifies time regions with low utilization.
Suggestions: Use CPU sampling data, OS Runtime blocked state backtraces, and/or OS Runtime APIs related to thread synchronization to understand if a sluggish or blocked CPU is causing the gaps. Add NVTX annotations to CPU code to understand the reason behind the gaps.
Notes: For each process, each GPU is examined, and gaps are found within the time range that starts with the beginning of the first GPU operation on that device and ends with the end of the last GPU operation on that device. This time range is then divided into equal chunks, and the GPU utilization is calculated for each chunk. The utilization includes all GPU operations as well as profiling overheads that the user cannot address.
The utilization refers to the “time” utilization and not the “resource” utilization. This rule attempts to find time gaps when the GPU is or isn’t being used, but does not take into account how many GPU resources are being used. Therefore, a single running memcpy is considered the same amount of “utilization” as a huge kernel that takes over all the cores. If multiple operations run concurrently in the same chunk, their utilization will be added up and may exceed 100%.
Chunks with an in-use percentage less than the threshold value are displayed. If consecutive chunks have a low in-use percentage, the individual chunks are coalesced into a single display record, keeping the weighted average of percentages. This is why returned chunks may have different durations.
Advanced Report Analysis#
Nsight Systems Advanced Report Analysis is functionality to better support complex statistical analysis across multiple result files. Possible use cases for this functionality include:
Multi-Node Analysis - When you run Nsight Systems across a cluster, it typically generates one result file per rank on the cluster. While you can load multiple result files into the GUI for visualization, this analysis system allows you to run statistical analysis across all of the result files.
Multi-Pass Analysis - Some features in Nsight Systems cannot be run together due to overhead or hardware considerations. For example, there are frequently more CPU performance counters available than your CPU has registers. Using this analysis, you could run multiple runs with different sets of counters and then analyze the results together.
Multi-Run Analysis - Sometimes you want to compare two runs that were not taken at the same time together. Perhaps you ran the tool on two different hardware configurations and want to see what changed. Perhaps you are doing regression testing or performance improvement analysis and want to check your status. Comparing those result files statistically can show patterns.
Complex/multi-phase analysis - Sometimes you may want to perform a complicated, or multi-phase analysis on one or more results files. The helper functionality available in the Advanced Analysis system can simplify common steps.
Complex data output - Sometimes you want to be able to build complex visualizations from your analysis, rather than just tabular data from bare statistics.
Analysis Steps
Note
Prior to using advanced analysis, please make sure that you have installed all required dependencies. See Installing Advanced Analysis System in the Installation Guide for more information.
Generate the reports - Generate the reports as you always have, in fact, you can use reports that you have generated previously.
Set up - Choose the recipe (See Available Recipes, below), give it any required parameters, and run.
Launch Analysis - Nsight Systems will run the analysis, using your local system or Dask, as you have selected.
Output - the output is a directory containing an .nsys-analysis file, which can then be opened within the Nsight Systems GUI.
View the data - depending on your recipe, you can have any number of visualizations, from simple tabular information to Jupyter notebooks which can be opened inside the GUI.
Available Advanced Analysis Recipes#
All advanced analysis recipes are run using the recipe CLI command switch.
usage:
nsys recipe [args] <recipe-name> [recipe args]
Nsight Systems provides several initial analysis recipes, mostly based around making our existing statistics and expert systems rules run multi-report.
These recipes can be found at
<target-linux-x64>/python/packages/nsys-recipe/recipes.
Please note that all recipes are in the form of python scripts. You may alter
the given recipes or write your own to meet your needs. Refer to
Tutorial: Create a User-Defined Recipe for an example of how to do this.
However, be advised that the APIs may change for the next few versions. Additional
recipes will be added on an ongoing basis.
For more information about a specific recipe, including recipe parameters,
please use nsys recipe [recipe name] --help.
List of recipes
Each recipe will be tagged with one or more keywords to help understand its purpose.
Keywords |
Description |
|
|---|---|---|
Expert System |
The recipe originated from the Expert System. A script
with the same name is also available via |
|
Stats System |
The recipe originated from the Stats System. A script
with the same name is also available via |
|
Trace |
The recipe provides a trace record of individual events that are observable in the GUI timeline. |
|
Summary |
The recipe provides a summarized view of events, often representing aggregated data. |
|
Pace |
The recipe provides a detailed analysis of how a specific event progresses across the application. |
|
Heatmap |
The recipe provides a heatmap that visualizes patterns across the application. |
|
- cuda_api_sumCUDA API Summary
This recipe provides a summary of CUDA API functions and their execution times.
Keywords: CUDA, Summary, Stats System
- cuda_api_syncCUDA Synchronization APIs
This recipe identifies synchronization APIs that block the host until the issued CUDA calls are complete.
Keywords: CUDA, Synchronization, Trace, Expert System
- cuda_gpu_kern_histCUDA GPU Kernel Duration Histogram
This recipe represents the probability of the duration of a CUDA kernel among all its instances or all kernels in the program.
Keywords: CUDA, Kernel, Histogram, Duration
- cuda_gpu_kern_paceCUDA GPU Kernel Pacing
This recipe investigates the progress and consistency of a particular CUDA kernel throughout the application.
Keywords: CUDA, Kernel, Pace
- cuda_gpu_kern_sumCUDA GPU Kernel Summary
This recipe provides a summary of CUDA kernels and their execution times.
Keywords: CUDA, Kernel, Summary, Stats System
- cuda_gpu_mem_size_sumCUDA GPU MemOps Summary (by Size)
This recipe provides a summary of GPU memory operations and the amount of memory they utilize.
Keywords: CUDA, Memory, Summary, Stats System
- cuda_gpu_mem_time_sumCUDA GPU MemOps Summary (by Time)
This recipe provides a summary of GPU memory operations and their execution times.
Keywords: CUDA, Memory, Summary, Stats System
- cuda_gpu_time_util_mapCUDA GPU Time Utilization Heatmap
This recipe calculates the percentage of time that CUDA kernels were running.
Keywords: CUDA, Kernel, Heatmap
- cuda_memcpy_asyncCUDA Async Memcpy with Pageable Memory
This recipe identifies asynchronous memory transfers that end up becoming synchronous if the memory is pageable.
Keywords: CUDA, Memcpy, Trace, Expert System
- cuda_memcpy_syncCUDA Synchronous Memcpy
This recipe identifies memory transfers that are synchronous.
Keywords: CUDA, Memcpy, Trace, Expert System
- cuda_memset_syncCUDA Synchronous Memset
This recipe identifies synchronous memset operations with pinned host memory or Unified Memory region.
Keywords: CUDA, Memset, Trace, Expert System
- diffStatistics Diff
This script compares outputs from two runs of the same statistical recipe.
Keywords: Diff, Summary
- dx12_mem_opsDX12 Memory Operations
This recipe flags problematic memory operations with warnings.
Keywords: DX12, Memory, Trace, Expert System
- file_access_sumOS Runtime File Access Summary
This recipe provides a summary of file access functions, including high-level overview of file access patterns across the system.
For details and use cases of this recipe, see file_access_sum Recipe.
Keywords: OSRT, Summary
- gfx_hotspotGraphics Hotspot Analysis
This recipe generates a report of CPU hotspots for graphics applications.
The output format for this recipe is different than other recipes. See gfx_hotspot Recipe.
Keywords: DX12, Vulkan, Summary, Trace
- gpu_gapsGPU Gaps
This recipe identifies time regions where a GPU is idle for longer than a set threshold.
Keywords: CUDA, Utilization, Expert System
- gpu_metric_util_mapGPU Metric Utilization Heatmap
This recipe calculates the percentage of SM Active, SM Issue, and Tensor Active metrics.
Keywords: GPU Metrics, Heatmap
- gpu_metric_util_sumGPU Metrics Utilization Summary
This recipe provides a summary of different GPU metrics. GPU metrics are based on binary inclusion. Any ranges that do not include at least one sampling point are excluded from the output.
Keywords: GPU Metrics, Summary
- gpu_time_utilGPU Time Utilization
This recipe identifies time regions with low GPU utilization.
Keywords: CUDA, Utilization, Expert System
- gpu_vram_usage_traceGPU VRAM Usage Trace
This recipe traces the VRAM usage of GPU workloads, allowing comparison of changes between CPU frames, and identifying issues in resource migration between VRAM and SYSMEM, and with resource allocation & deallocation.
For details and use cases of this recipe, see gpu_vram_usage_trace Recipe - Preview Feature.
Keywords: VRAM, Trace
- mpi_gpu_time_util_mapMPI and GPU Time Utilization Heatmap
This recipe calculates the percentage of time that CUDA kernels were running and MPI communication was active, as well as their overlap.
Keywords: MPI, CUDA, Kernel, Utilization, Heatmap
- mpi_sumMPI Summary
This recipe provides a summary of MPI functions and their execution times.
Keywords: MPI, Summary
- nccl_gpu_overlap_traceNCCL GPU Overlap Trace
This recipe calculates the percentage of overlap for communication and compute kernels. Communication kernels are identified by the ‘nccl’ prefix.
Keywords: NCCL, CUDA, Kernel, Overlap, Trace
- nccl_gpu_proj_sumNCCL GPU Projection Summary
This recipe provides a summary of NCCL functions projected from the CPU onto the GPU, and their execution times.
Keywords: NCCL, CUDA, GPU Projection, Summary
- nccl_gpu_time_util_mapNCCL GPU Time Utilization Heatmap
This recipe calculates the percentage of time that communication and compute kernels were running, as well as their overlap. Communication kernels are identified by the ‘nccl’ prefix.
Keywords: NCCL, CUDA, Kernel, Utilization, Overlap, Heatmap
- nccl_sumNCCL Summary
This recipe provides a summary of NCCL functions and their execution times.
Keywords: NCCL, Summary
- network_map_awsAWS Metrics Heatmap
This recipe displays heatmaps of AWS EFA metrics.
Keywords: Network, AWS, EFA, Heatmap
- network_sumNetwork Traffic Summary
This recipe provides a summary of the network traffic over NICs and InfiniBand Switches.
Keywords: Network, Summary
- network_traffic_mapNetwork Devices Traffic Heatmap
This recipe displays heatmaps of sent traffic, received traffic, and congestion events for network devices.
Keywords: Network, Heatmap
- nvtx_cpu_topdownCPU Topdown methodology metrics correlated to NVTX ranges
This recipe calculates CPU Topdown methodology metrics for NVTX push/pop ranges based on collected PMU core events for NVIDIA CPUs featuring Arm cores.
For details and use cases of this recipe, see nvtx_cpu_topdown Recipe.
Keywords: NVTX, CPU Topdown, Metrics, Summary
- nvlink_sumNVLink Network Throughput Summary
This recipe provides a summary of the NVLink network throughput.
Keywords: NVLink, Summary
- nvtx_gpu_proj_paceNVTX GPU Projection Pacing
This recipe investigates the progress and consistency of a particular NVTX range projected from the CPU onto the GPU, throughout the application.
Keywords: NVTX, GPU Projection, Pace
- nvtx_gpu_proj_sumNVTX GPU Projection Summary
This recipe provides a summary of NVTX time ranges projected from the CPU onto the GPU, and their execution times.
Keywords: NVTX, GPU Projection, Summary, Stats System
- nvtx_gpu_proj_traceNVTX GPU Projection Trace
This recipe provides a trace of NVTX time ranges projected from the CPU onto the GPU.
Keywords: NVTX, GPU Projection, Trace, Stats System
- nvtx_paceNVTX Pacing
This recipe investigates the progress and consistency of a particular NVTX range throughout the application.
Keywords: NVTX, Pace
- nvtx_sumNVTX Range Summary
This recipe provides a summary of NVTX Start/End and Push/Pop Ranges, and their execution times.
Keywords: NVTX, Summary, Stats System
- osrt_sumOS Runtime Summary
This recipe provides a summary of C library functions and their execution times.
Keywords: OSRT, Summary, Stats System
- s3_access_sumS3 Access Summary
This recipe provides a summary of S3 object store access across traced S3 client libraries.
For details and use cases of this recipe, see s3_access_sum Recipe.
Keywords: S3, Storage, Summary
- storage_util_mapStorage Metrics Heatmap
This recipe displays heatmaps of storage devices metrics.
Keywords: Storage, Heatmap
- ucx_gpu_time_util_mapUCX and GPU Time Utilization Heatmap
This recipe calculates the percentage of time that CUDA kernels were running and UCX communication was active, as well as their overlap.
Keywords: UCX, CUDA, Kernel, Heatmap
Recipe Output Examples#
A successful recipe run outputs a directory containing different files. This section gives some common examples of these output types.
Table
Trace or summary data will be stored in data storage formats such as CSV, Parquet, or Arrow. Typically, you can also access the same data within the output Jupyter notebook.
Summary table:
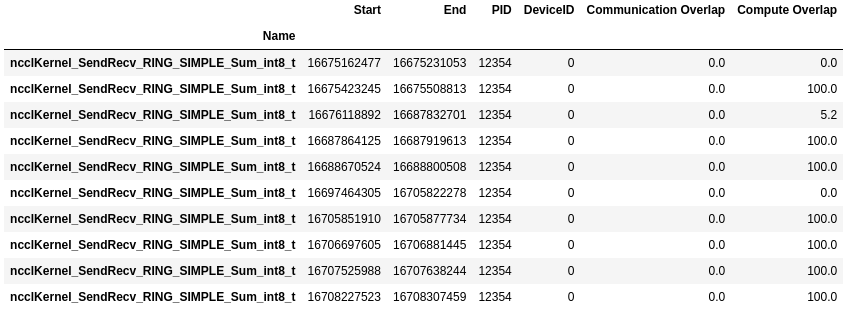
Trace table:
Overlap table:
Visualization
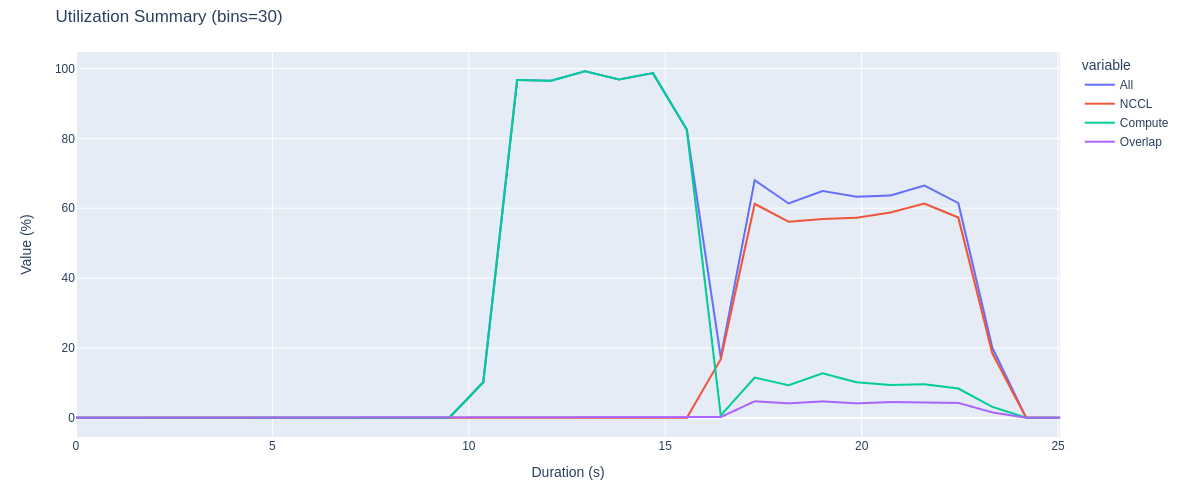
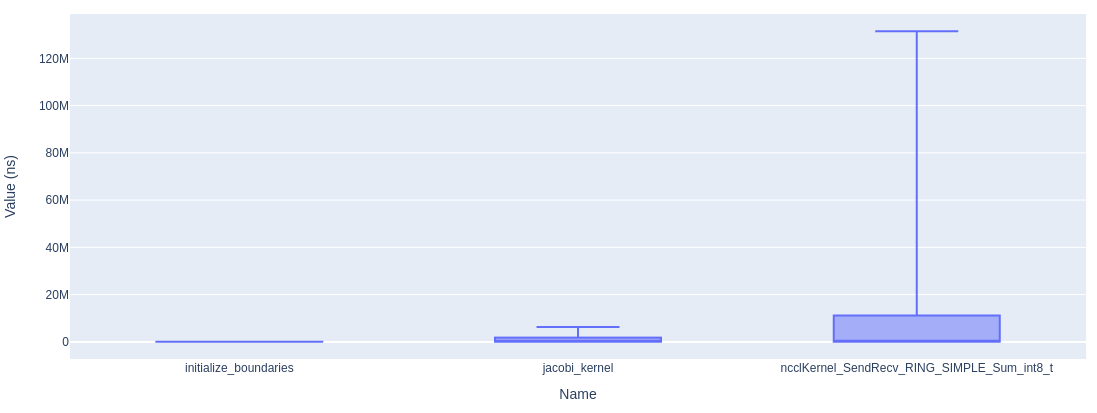
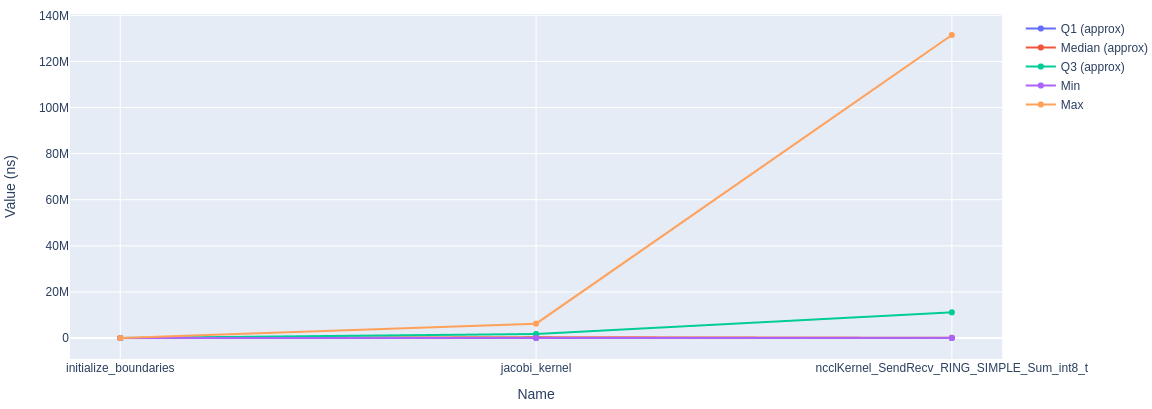
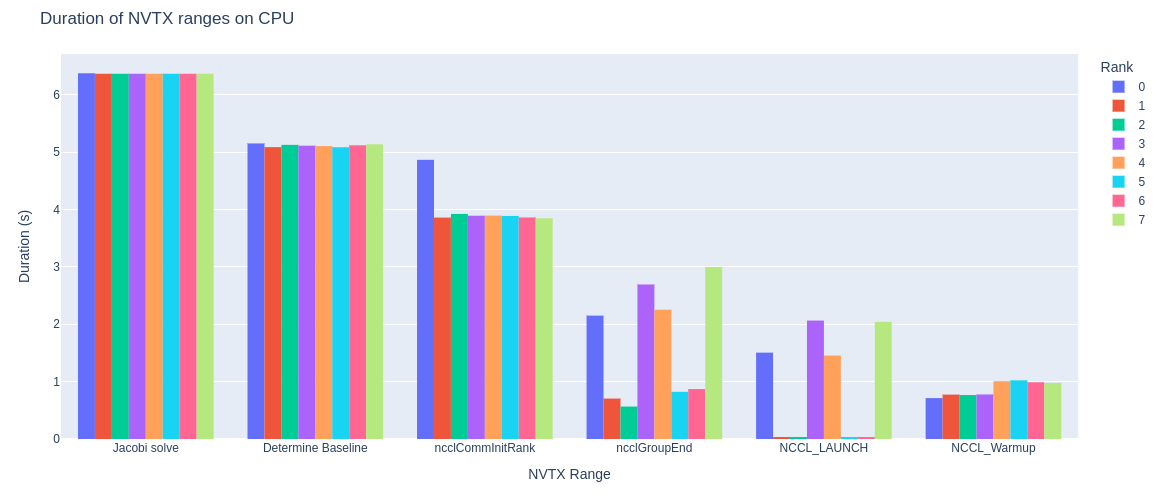
Some recipes include data visualization in the output Jupyter notebooks. These graphs use Plotly, which provides interactivity.
Summary graph:
Box plot:
Line graph:
Top N graph:
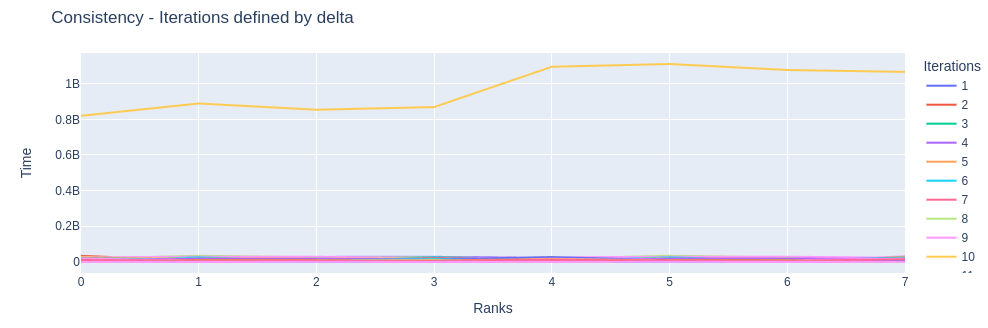
Pace graph:
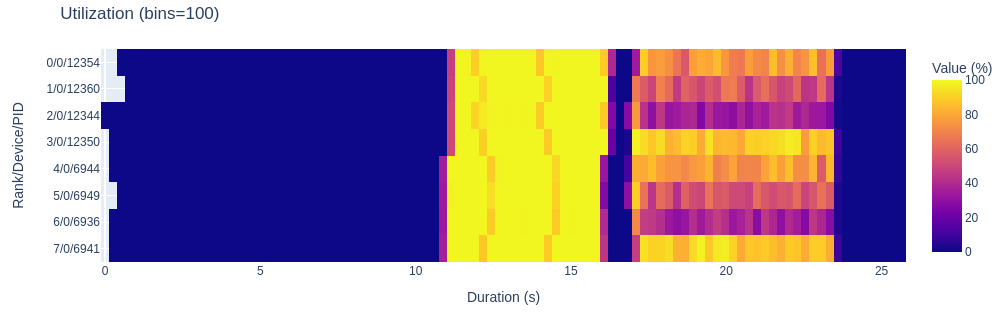
Heatmap:
Opening in Jupyter Notebook#
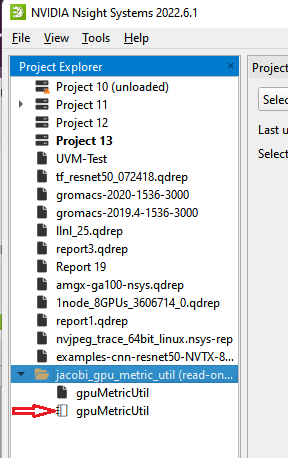
Running the recipe command creates a new analysis file (.nsys-analysis). Open the Nsight Systems GUI and select File->Open, and pick your file.
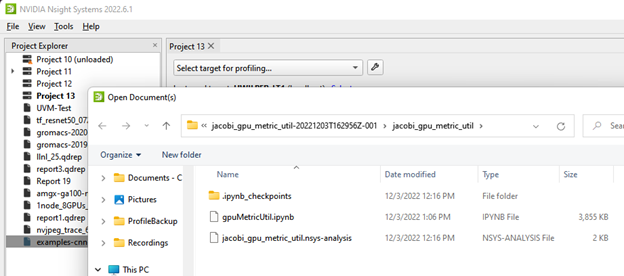
Open the folder icon and click on the notebook icon to open the Jupyter notebook.
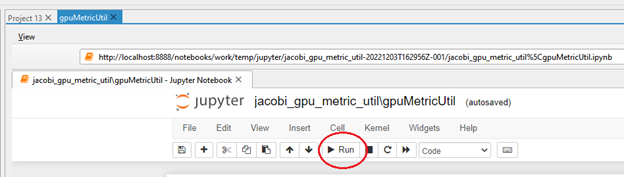
Run the Jupyter notebook:
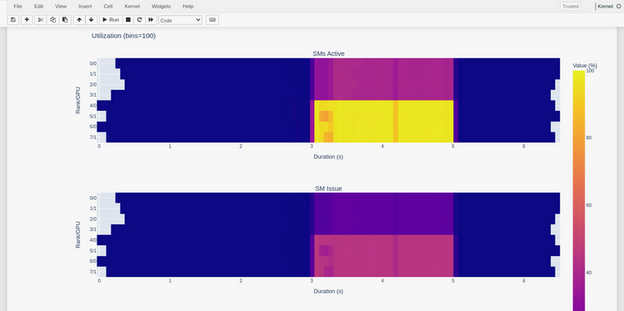
And the output appears on-screen. In this case a heat map of activity running a Jacobi solver.
Configuring Dask#
The multi-report analysis system does not offer options to configure the Dask environment. However, you could achieve this by modifying the recipe script directly or using one of the following from Dask’s configuration system:
YAML files: By default, Dask searches for all YAML files in
~/.config/dask/or/etc/dask/. This search path can be changed using the environment variableDASK_ROOT_CONFIGorDASK_CONFIG. See the Dask documentation for the complete list of locations and the lookup order. Example:$ cat example.yaml 'Distributed': 'scheduler': 'allowed-failures': 5Environment variables: Dask searches for all environment variables that start with
DASK_, then transforms keys by converting to lower-case and changing double-underscores to nested structures. See Dask documentation for the complete list of variables. Example:DASK_DISTRIBUTED__SCHEDULER__ALLOWED_FAILURES=5
Dask Client
With no configuration set, the dask-futures mode option initializes the Dask Client with the default arguments, which results in creating a LocalCluster in the background. The following are the YAML/environment variables that could be set to change the default behavior:
distributed.comm.timeouts.connect / DASK_DISTRIBUTED__COMM__TIMEOUTS__CONNECT
client-name / DASK_CLIENT_NAME
scheduler-address / DASK_SCHEDULER_ADDRESS
distributed.client.heartbeat / DASK_DISTRIBUTED__CLIENT__HEARTBEAT
distributed.client.scheduler-info-interval / DASK_DISTRIBUTED__CLIENT__SCHEDULER_INFO_INTERVAL
distributed.client.preload / DASK_DISTRIBUTED__CLIENT__PRELOAD
distributed.client.preload-argv / DASK_DISTRIBUTED__CLIENT__PRELOAD_ARGV
Recipe’s environment variables
Recipe has its own list of environment variables to make the configuration more complete and flexible. These environment variables are either missing from Dask’s configuration system or specific to the recipe system:
NSYS_DASK_SCHEDULER_FILE: Path to a file with scheduler information. It will be used to initialize the Dask Client.
NSYS_DIR: Path to the directory of Nsight Systems containing the target and host directories. The nsys executable and the recipe dependencies will be searched in this directory instead of the one deduced from the currently running recipe file path.
gfx_hotspot Recipe#
This recipe’s output is different from other recipes and is presented as a web application.
The output can be viewed by passing the --run-viewer argument to the recipe -
along with the further --show-viewer which will automatically open a web
browser to the report view.
Alternatively, a previously-executed gfx_hotspot recipe’s output can be
viewed by executing the run_viewer.py script from the recipe output folder.
For the best results, run the recipe on a report with resolved symbols.
Threading Analysis
In this tab, an overview of the multi-threading behavior of the target (most active) process is presented.
- Application Statistics:
This table shows the CPU and thread statistics for the target process.
- CPU Info:
This table shows information about the CPU hardware.
- Top 5 Processes CPU Utilisation:
This table shows the most active processes during the sample, to help detect situations where another process is interfering with the target process’s execution.
- Threading Health Check:
This table contains a list of very common CPU-bound application performance indicators. If the target application is GPU bound, the entire table will be shown in green. If it is CPU bound, then each row will be highlighted in green if the value is healthy, in yellow if it requires attention, and in red if it potentially indicates of a threading issue. For unhealthy metrics, the “warning” column will also show steps or investigation angles that may be considered in order to improve the result.
- Thread Utilisation:
This graph shows the process threads, ordered from most busy to least.
- Thread Concurrency:
This graph shows the percentage and amount of time an average graphic frame is running each number of threads concurrently. High percentage of low thread counts could indicate excessive serialization in the algorithm, where CPU work could be better parallelized by improving the use of multi-threading.
Hotspot Analysis
- In this tab, frames are selected in one of four methods:
Longest Frame time (Slow Frames)
Periodic time-based selection (Periodic Frames)
Frames with highest transfer activity (Bar1 Reads)
Frames with least GPU activity (GR Idle)
The report view then allows comparing the selected frames to each other and to the median frame in the same metric, helping identify the main differences and possible problem areas in each one.
- Overview:
These tables show the report overview as well as the frame selection method and other capture-wide statistics and general information. A shorthand list of the “Performance Issues” table for each frame is also shown.
- Frame Times:
This graph shows a sequence of the graphical frames (CPU time and GPU time derived from GPU Utilisation percentage per CPU frame time) ordered by their index. The selected frames are indicated and labelled. Clicking any of the indicated frames will set it as the left frame for comparison.
- Region / Compare to:
These controls allow selecting the two frames to be shown for comparison. “Periodic Frames” shows 10 sampled frames (with equally distributed indices), while the other three modes show the 5 frames with the highest value in the chosen metric and the median frame in the same metric. All information from this point onwards is shown per selected frame in each of the two columns, allowing for 1-to-1 comparison. Selecting the same frame for both controls will show just the single frame as the entire width of the view.
- Frame Info:
This table shows the frame duration and start time, the number of threads that were active during the frame, and the thread IDs of key threads in the frame processing operation which are important for determining likely performance issues.
- Performance Issues:
This table shows the key performance limiters and hotspots for the selected frame. Each indicator will have a breakdown of what indicators were present to call out the performance issue during this frame. These indicators are not necessarily the root cause of the problems in the region, but have been flagged for consideration.
- GPU Metrics:
This table shows the average or total (respectively) values of the GPU metrics collected during the frame time. If GPU Metrics were not collected, this table will not appear.
- System ETW Events (Windows only):
This chart shows a breakdown of the system process-reported ETW events during the frame. If WDDM trace and Custom ETW trace were not collected, this chart will not appear.
- DxgKrnl Events (Windows only):
This chart shows a breakdown of the DxgKrnl ETW provider events during the frame. If WDDM trace was not collected, this chart will not appear.
- CPU Thread Utilisation Time:
This graph shows the time spent inside each thread during the frame. The bars match the two selected frames, and the matching-colored line shows the total frame time. Clicking any of the columns in the graph will select that thread for the following elements in the report.
- Thread:
This control allows selecting the thread to be shown in the following views.
- Call stacks:
This control shows the sampled call stacks during the frame. Clicking a call stack frame will filter the view to only show call stacks containing this call stack frame, allowing to drill down into potential problem areas. The title of the control indicates the two modes selected for display, which can be switched with the two toggles in the top right of the control:
- Call stacks - Merged:
Merges all similar call stacks logically, regardless of when in the frame time the functions appeared. This is useful to see where the cumulative time is spent.
- Call stacks - Over Time:
Keeps call stacks ordered chronologically, so that repeated calls to the same function appear separately.
- Periodic Sampled Call stacks:
Only shows call stacks acquired by periodic sampling (matching the orange marks in Nsight Systems’s timeline view). This view provides a better statistical overview of where the frame time was spent.
- All Call stacks:
Shows periodic sampled call stacks as well as call stacks acquired from other sources such as call stacks from ETW events (Windows) and event-based sampling (Linux) (matching both the orange AND the grey marks in Nsight Systems’s timeline view).
- Modules in Sampled Call Stacks:
This graph shows the number of call stacks in the frame that include at least one call stack frame in a function belonging to each module. This helps identify which modules were the most active during the frame.
- ETW Events (Windows only):
This chart shows a breakdown of the thread-reported ETW events during the frame. If WDDM trace and Custom ETW trace were not collected, this chart will not appear.
- Context Switch Call Stacks:
This table shows a breakdown of the call stacks that led to context switches for the thread during the frame, indicating where the thread may have stalled. Hovering the mouse cursor over the “Name” column will show the full call stack for each entry.
- DX12 API / Vulkan API:
These tables show a breakdown of the graphical API functions that appeared in sampled call stacks. If DX12 / Vulkan trace were not collected, these tables will not appear.
- Known Symbols From Sampled Call Stacks:
This table shows a breakdown of known symbols that often cause performance issues, such as DX12’s CreateCommittedResource. If symbols were not resolved for the nsys-rep file, this table will not appear.
- PIX Markers (Windows only):
This table shows a breakdown of PIX marker ranges that contained sampled call stacks. If WDDM trace and DX11 / DX12 trace were not collected or the target application does not use PIX markers, this table will not appear.
gpu_vram_usage_trace Recipe - Preview Feature#
This recipe analyzes VRAM usage patterns and statistics from Nsight Systems reports, helping identify and troubleshoot potential issues in GPU memory management.
Overview
The gpu_vram_usage_trace recipe generates an interactive Jupyter notebook that analyzes VRAM usage patterns, such as resource migrations between VRAM and system memory, and resource allocation and deallocation timing. This analysis helps identify memory management issues, optimization opportunities, and potential causes of performance degradation related to GPU memory usage.
Key Capabilities
The recipe provides insights into:
VRAM Usage Tracking: Per-frame monitoring of VRAM’s and SYSMEM’s usage, commitment, and budget across all GPU resources.
Memory Resource Details: Comprehensive information for all allocated GPU memory resources.
Resource Migrations: Analysis of resource migration patterns between VRAM and system memory.
Frame-by-Frame Analysis & Comparison: Detailed view of available resources at a specific point in time and comparison to another.
Debugging Context Integration: Correlation of memory resource usage with user-provided performance markers, resource debug names, and callstack information.
Use Cases
The recipe is particularly valuable for identifying and addressing the following scenarios (but not limited to these):
VRAM Exhaustion: Detecting when applications approach or exceed available VRAM limits, and identifying which resources are consuming the available VRAM.
Memory Thrashing: Identifying excessive resource migrations between VRAM and system memory.
Frame Spikes: Analyzing frames with abnormal performance due to VRAM usage and/or resource transitions.
Important Notes
Preview Feature: This recipe is a preview feature and may be subject to change in the near future.
Single Report Only: This recipe is intended for use with a single report. Using it with multiple reports may cause unexpected behavior.
Prerequisites
Windows (DirectX 12 and Vulkan): This recipe currently supports reports recorded on Windows, using either DirectX 12 or Vulkan.
Usage
This recipe requires that Nsight Systems reports be collected with WDDM tracing enabled.
Steps:
Collect an nsys-rep report with WDDM tracing enabled
With `nsys.exe` (CLI): Use the parameters –trace=wddm together with either –wddm-memory-trace=true or –wddm-additional-events=true.
With `nsys-ui.exe` (GUI): Enable the WDDM Trace collector, using either the “Collect WDDM memory trace” or “Extensive trace including Hardware Scheduling queues…” option.
Note
Optional: To collect additional debug name information on resources (affects the Resident Resources Details section), enable tracing of debug markers as follows:
For DirectX 12:
With `nsys-ui.exe` (GUI): Enable the DX12 Trace collector and the Trace Debug Markers option.
With `nsys.exe` (CLI): Adjust the trace argument:
--trace=wddm,dx12-annotations.
For Vulkan:
With `nsys-ui.exe` (GUI): Enable the Vulkan Trace collector and the Trace Debug Markers option.
With `nsys.exe` (CLI): Adjust the trace argument:
--trace=wddm,vulkan-annotations.
Run the recipe
nsys recipe gpu_vram_usage_trace --input [report file path]Open the generated notebook Open the produced stats.ipynb Jupyter notebook to view the interactive analysis.
Output
As the main output, the recipe generates an interactive Jupyter notebook
stats.ipynb with the following sections:
- Global Process and GPU Selectors:
- Interactive Timeline Charts:
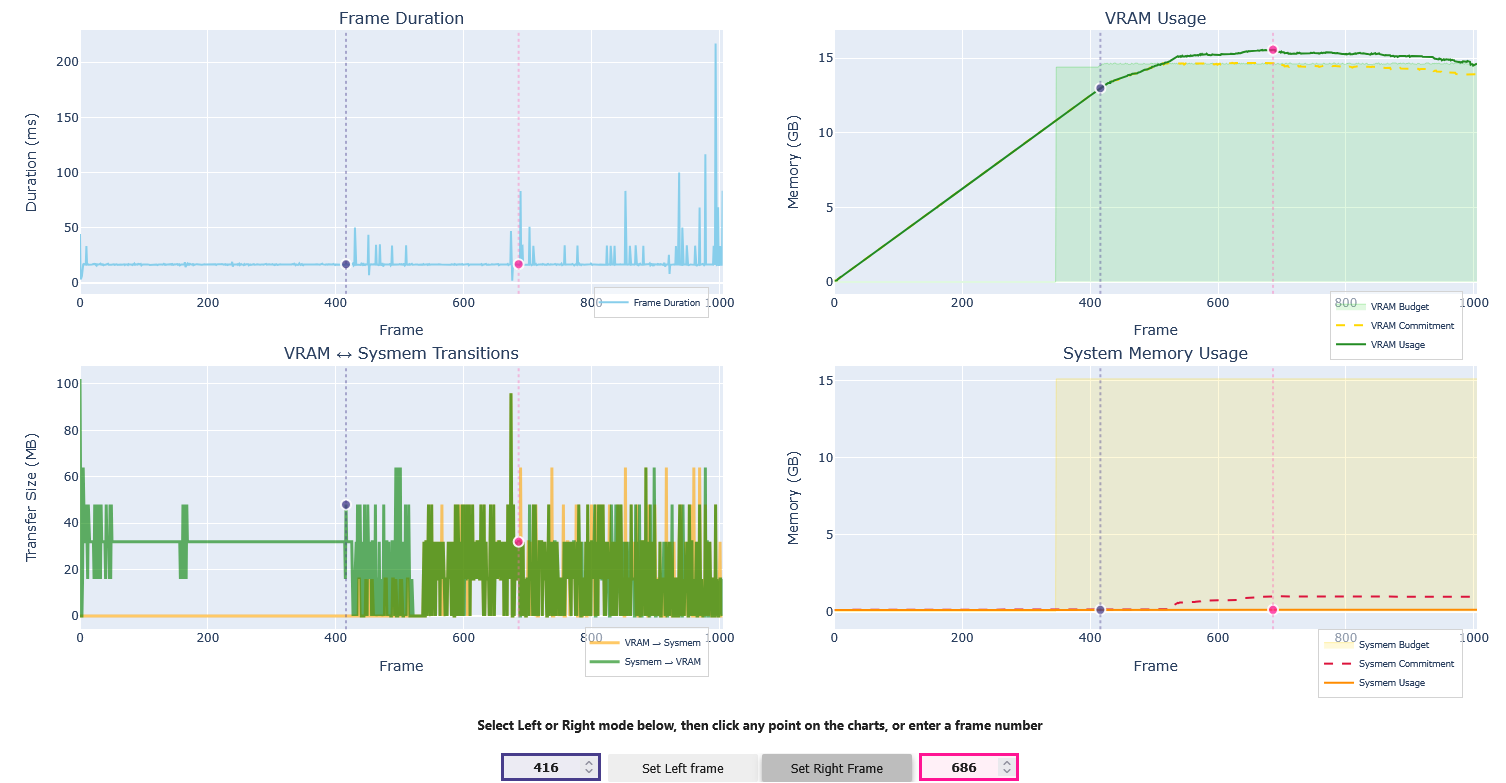
- Resident Resources Diff Tables:
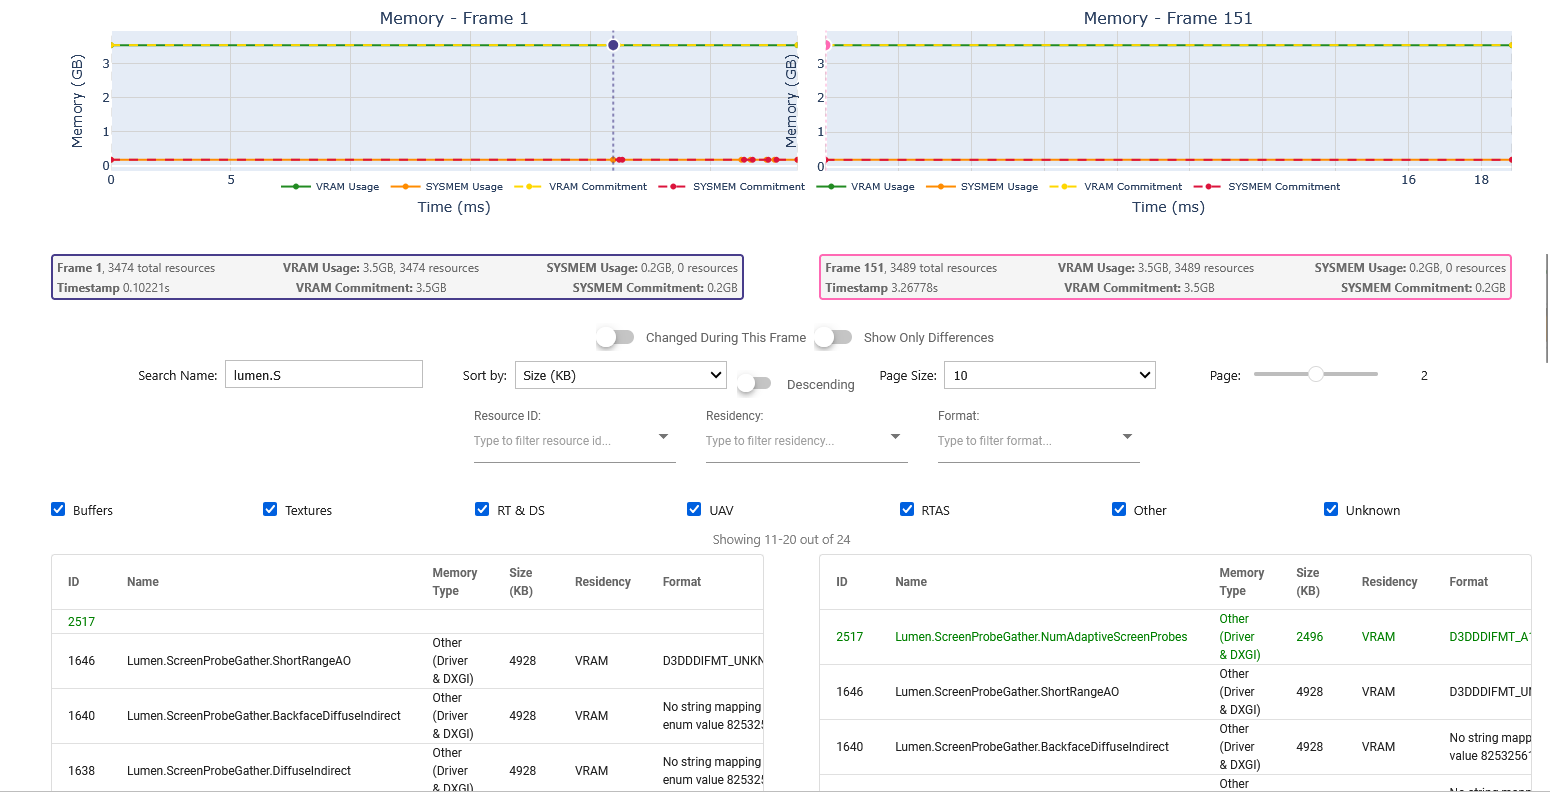
- Resident Resources Details Section:
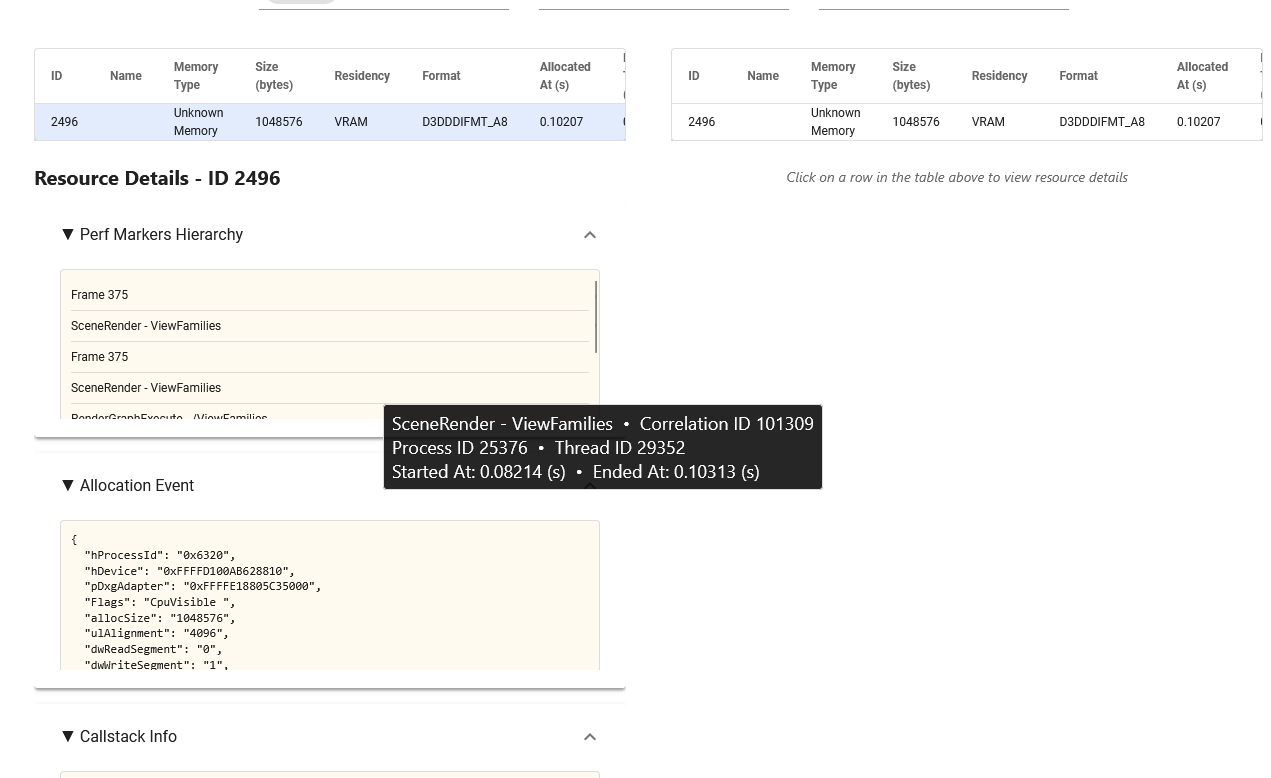
- All Allocations Table:
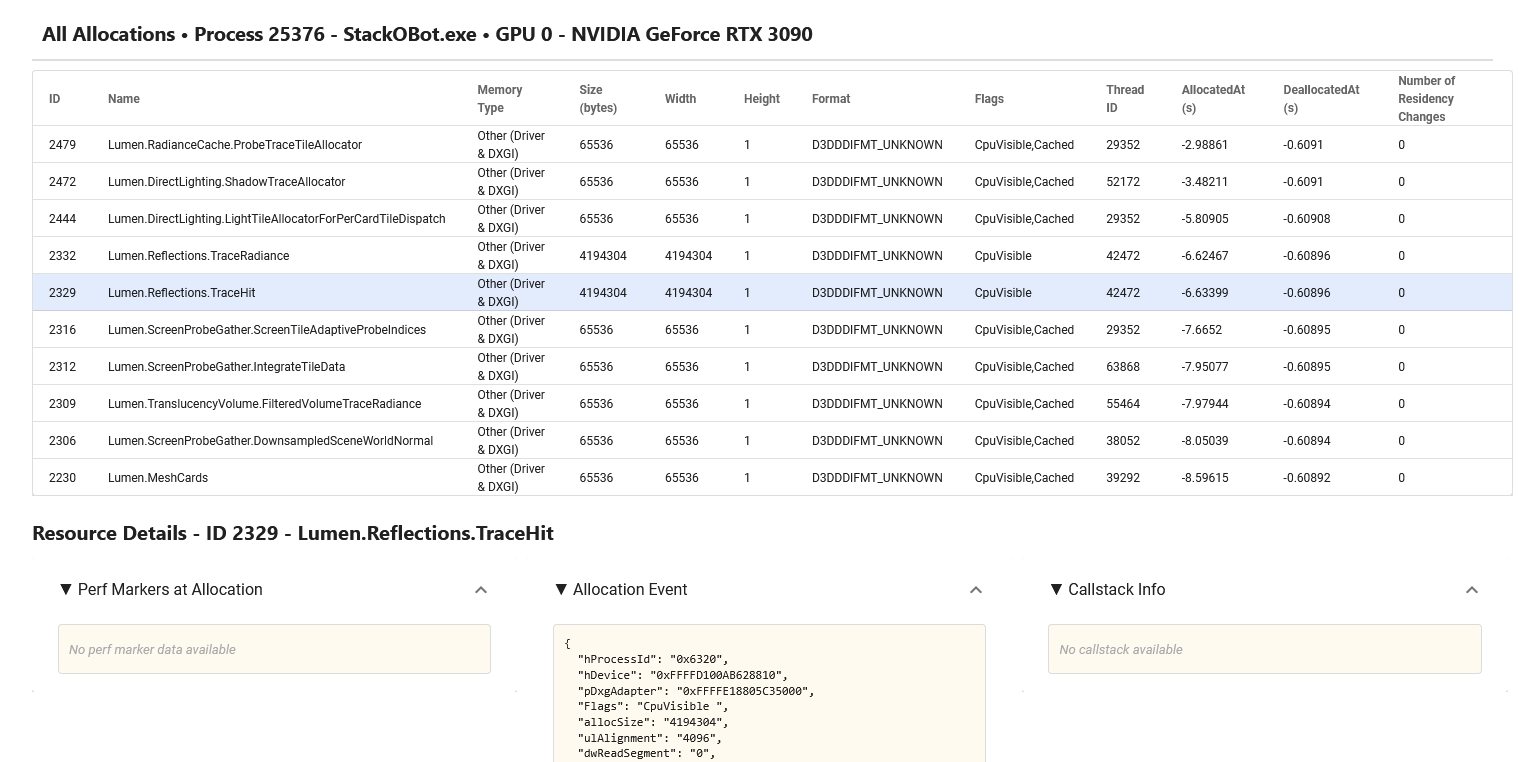
Recommended Workflow
Start by selecting the process and GPU of interest using the global selectors at the top.
Identify and select suspicious frames, such as frames with unusual memory usage or with a high volume of memory transition events.
- Use the Resident Resources table to learn more about allocated resources during the selected frames:
Identify resources with significant memory usage.
Identify resources that have changed between the two points in time (transitioned between VRAM and SYSMEM, or were allocated/deallocated).
View resources’ allocation details, performance markers, and callstacks to help recognize the specific resources and possible problematic settings.
Use the “All Allocations” table to find suspicious resources, such as resources with excessive residency changes or other unusual characteristics.
nvtx_cpu_topdown Recipe#
This recipe calculates CPU Topdown methodology metrics for NVTX push/pop ranges based on collected PMU core events for NVIDIA CPUs featuring Arm cores. It can process multiple Nsight Systems reports.
Currently, the recipe supports NVIDIA Grace (TM) CPUs and NVIDIA DGX Spark (TM) CPUs.
We recommend using this recipe after running the collect_cpu_topdown.sh
script, which simplifies collecting all PMU core event and metric data needed to
perform a CPU Topdown analysis of the workload’s CPU performance. For more
details on this script, refer to the Arm Topdown Analysis section.
If PMU core events other than those required by Topdown are collected, the recipe will calculate available CPU metrics based on them and display those metrics in the output.
Use Case
The recipe is most useful when the following conditions are met:
The application runs on CPU cores supported by the recipe.
The application is instrumented with NVTX push/pop ranges.
NVTX range spans a specific CPU algorithm / code section that does not make syscalls or calls to other libraries whose functions take significant time to execute.
NVTX ranges with the same name are used to represent the same workload across all threads and all repetitions.
The duration of the NVTX range is 5 ms or longer to obtain more accurate results.
In systems with heterogeneous CPU cores, the NVTX range executed on a given core type remains consistent across runs, ensuring a reliable view of CPU metrics for that range on that core type. For example, to achieve stable runs, you can pin the process to specific CPU cores using
taskset.
Note
For the case of NVTX ranges from multiple threads, only the NVTX ranges from
either the main thread (default) or the thread specified via --thread-name
will be processed.
Usage
[1] mkdir reports && cd reports
[2] <path to target-linux-sbsa-armv8>/CpuProfiling/collect_cpu_topdown.sh ./myApp
[3] nsys recipe nvtx_cpu_topdown --input .
This step creates a new directory to store the reports. We recommend using an empty new directory, because the
collect_cpu_topdown.shscript overwrites the output files and does not currently allow customization of file names.This step creates several report files: cpu-td1.nsys-rep, cpu-branch-ipc.nsys-rep, etc.
Note
Note that since multiple reports are created, this step can take significant time to complete.
This step runs the recipe, uses all reports in the current directory as the input, and produces a
.ipynbJupyter notebook,.parquetand.csv(if--csvis specified) files as the output.
Output
As the main output, the recipe generates the Jupyter notebook
nvtx_cpu_topdown.ipynb with the following sections:
- NVTX Summary for Heterogeneous CPU Cores:
Displays a summary of NVTX ranges compiled from Nsight Systems reports provided to the recipe.
For a report selected from the drop-down menu, the section shows each NVTX range (in call stack order) with its instance count, median* instance duration, and CPU time aggregated across heterogeneous cores, as well as CPU time per core type - both related to the NVTX instance with the median* duration.
Note: median* is defined as the middle value in the sorted list. For an even number of elements, it is the second of the two middle values.
Note
This section is available only for data collected from heterogeneous CPU cores. For these cores, the remaining sections apply to each CPU core type individually and can be toggled using the
Select CPU Coredrop-down menu.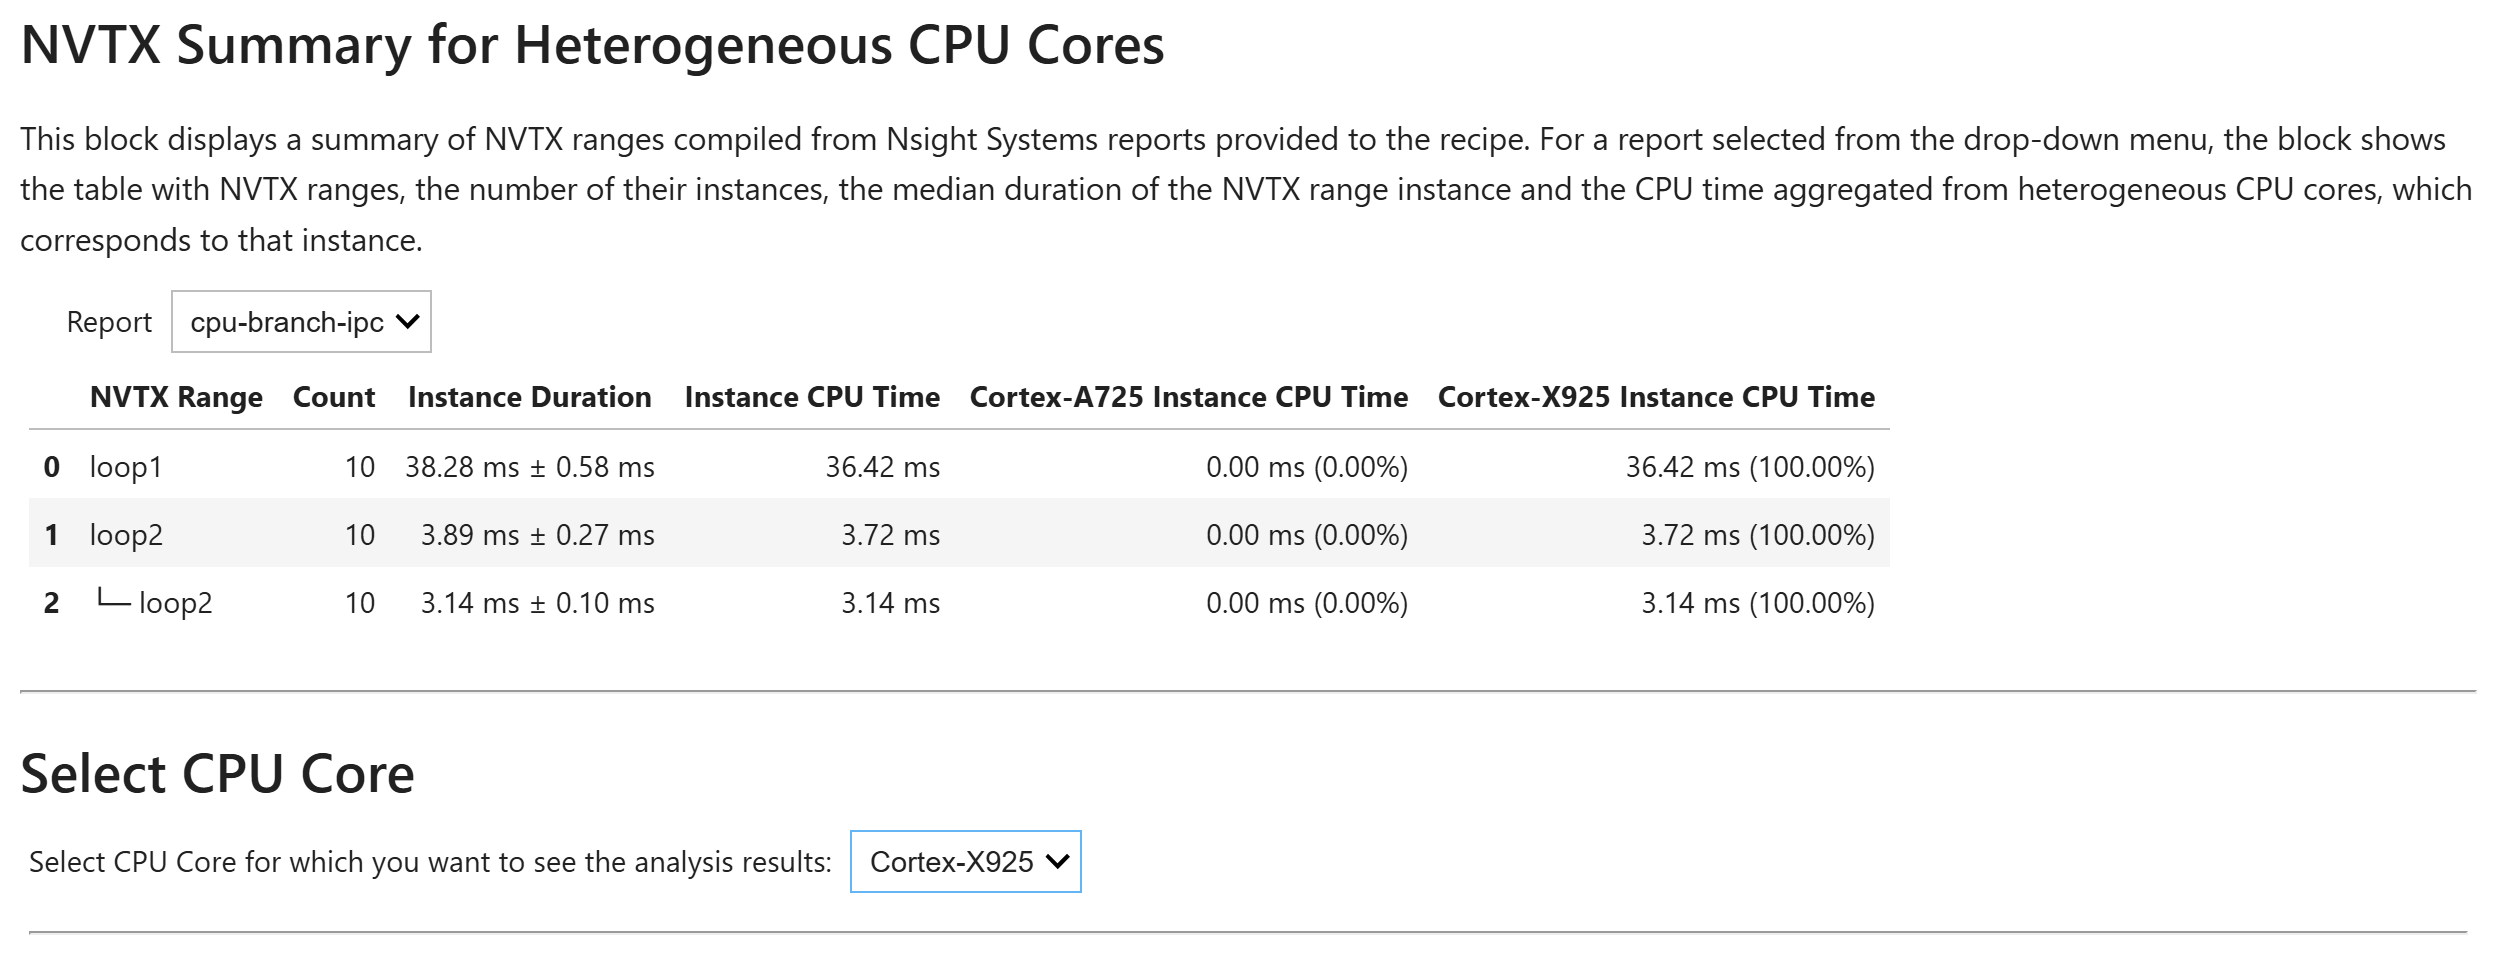
- Warnings:
Displays warnings generated during recipe execution and related to the entire recipe output (or to the portion of it specific to a given CPU core type). If there are no warnings, this section is not displayed.
- NVTX Summary:
Displays a summary of NVTX ranges compiled from Nsight Systems reports provided to the recipe.
For a report selected from the drop-down menu, the section shows each NVTX range (in call stack order) with its instance count, median duration with median absolute deviation, median CPU time with median absolute deviation, and relevant notes.
If NVTX ranges are filtered out, they are grayed out in the table, and a note is displayed in the Notes column for the corresponding range. The following ranges are candidates to be filtered out:
Ranges that contain fewer than 3 PMU samples in at least one Nsight Systems report provided to the recipe.
Ranges that are not present in at least one Nsight Systems report provided to the recipe.
If NVTX ranges are not stable across some of the reports, the section will display a warning next to the unstable data and a note in the Notes column for the corresponding range.
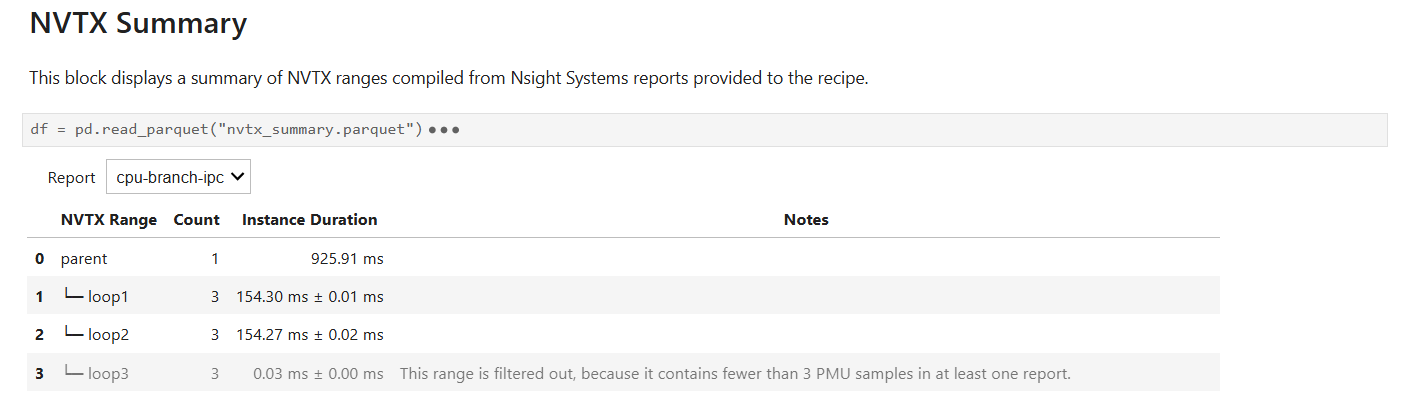
- CPU Topdown Methodology Metrics:
Presents the metric results of the CPU Topdown methodology for the selected NVTX range.
For the range name selected from the drop-down menu, the most appropriate NVTX range instance is identified from the Nsight Systems reports as follows:
For data collected from heterogeneous CPU cores: The NVTX range instance with the median* CPU time is selected from each report.
Otherwise: The NVTX range instance with the median* duration is selected from the first report (displayed by default in the NVTX Summary section). The corresponding instance index is then used to extract data from subsequent reports.
Note: median* is defined as the middle value in a sorted list. For an even number of elements, it is the second of the two middle values.
The section shows the following tables:
Topdown Level 1 metrics
Frontend Bound metrics
Backend Bound metrics
Bad Speculation metrics
Retiring metrics
Miscellaneous metrics
Each table is displayed only when the required data is available.
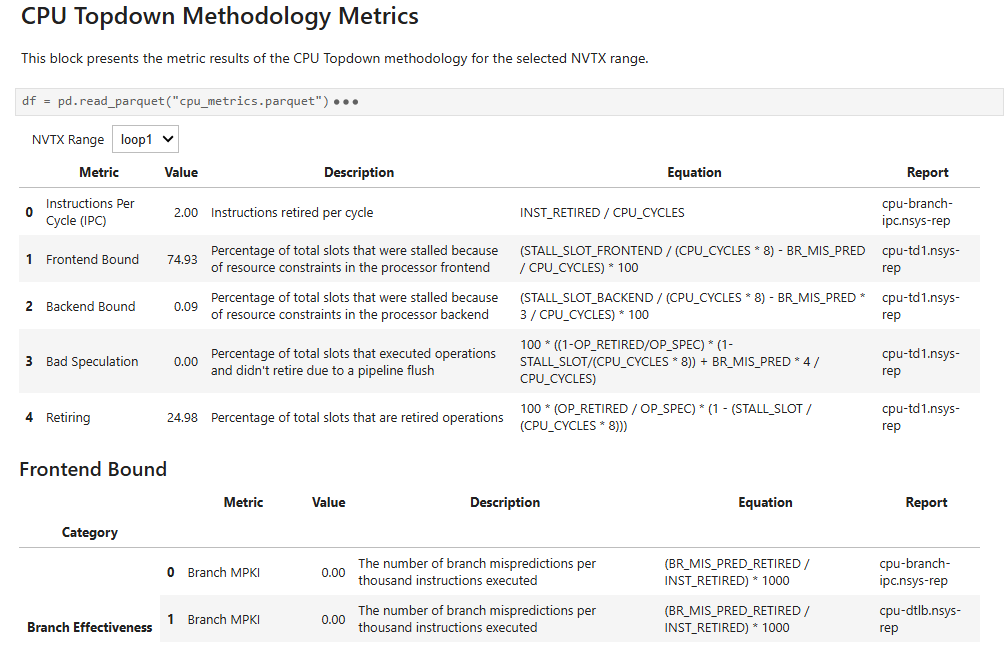
- Report Summary:
Displays information about the Nsight Systems report files given to the recipe for input, as well as: the PMU core events collected in each specific report, and the CPU core metrics computed for each specific report.
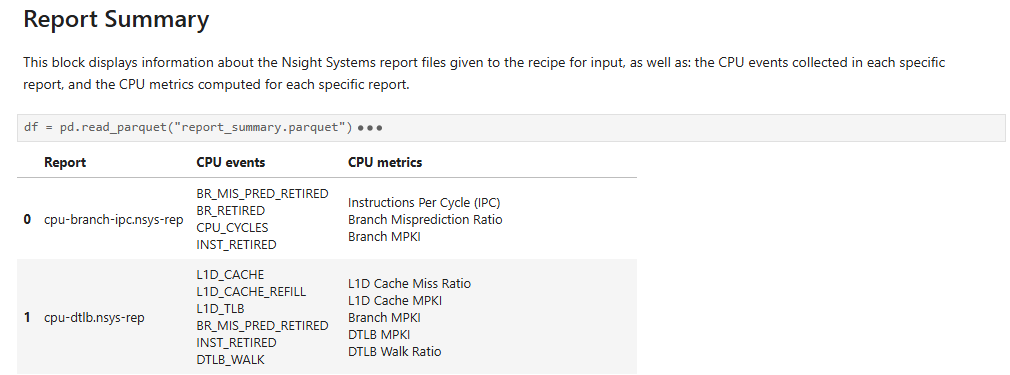
file_access_sum Recipe#
This recipe analyzes file access patterns and I/O performance statistics from one or more Nsight Systems reports, aggregating data across processes and machines.
Overview
The file_access_sum recipe generates an interactive Jupyter notebook that analyzes POSIX VFS (Virtual File System) function calls captured during profiling sessions. This analysis helps identify I/O bottlenecks, optimization opportunities, and file access patterns that could impact application performance.
Key Capabilities
The recipe provides insights into:
File Access Patterns: Breakdown of read-only, write-only, and read-write file access patterns.
Performance Metrics: Total bytes transferred, operation counts, and average I/O sizes per operation.
Cross-Process Analysis: File access patterns across multiple hosts, processes, and threads.
Temporal Analysis: Distribution of CPU time by operation type.
Hotspot Identification: Top files by read/write volume and operation frequency.
Performance Recommendations: Automated detection of potentially inefficient I/O patterns with actionable suggestions.
Use Cases
The recipe is particularly valuable for identifying and addressing the following scenarios (but not limited to these):
I/O Patterns: Understanding application I/O behavior to uncover usage trends and inefficiencies.
Small I/O Operations: Detection of frequent small read/write operations that could benefit from batching.
Caching Opportunities: Identification of frequently accessed read-only files that are candidates for local caching.
Metadata Contention: Identifying cases where frequent metadata operations by one process may cause contention, impacting storage access for other processes.
System File Noise: Filtering out system files (/dev/, /sys/, etc.) to focus on application-relevant I/O.
Prerequisites
This recipe requires that Nsight Systems reports be collected with specific tracing parameters:
--trace=osrt- Enables OS Runtime API tracing--osrt-file-access=true- Enables file access trackingOptional: To enable tracing of MPI rank information, use
--trace=mpialong with either--mpi-impl=openmpior--mpi-impl=mpich.Optional: To enable the NVTX range correlation table, instrument your application code with NVTX ranges. See Marking and Labeling Regions in the User Guide.
Usage
[1] Create a reports folder.
[2] Collect nsys-rep reports, using '--trace=osrt' and '--osrt-file-access=true' parameters, and save them to the reports folder.
[3] Run the recipe, using 'nsys recipe file_access_sum --input [reports folder path]'.
Output
As the main output, the recipe generates an interactive Jupyter notebook
file_access_stats.ipynb with the following sections:
- File Access Summary Table:
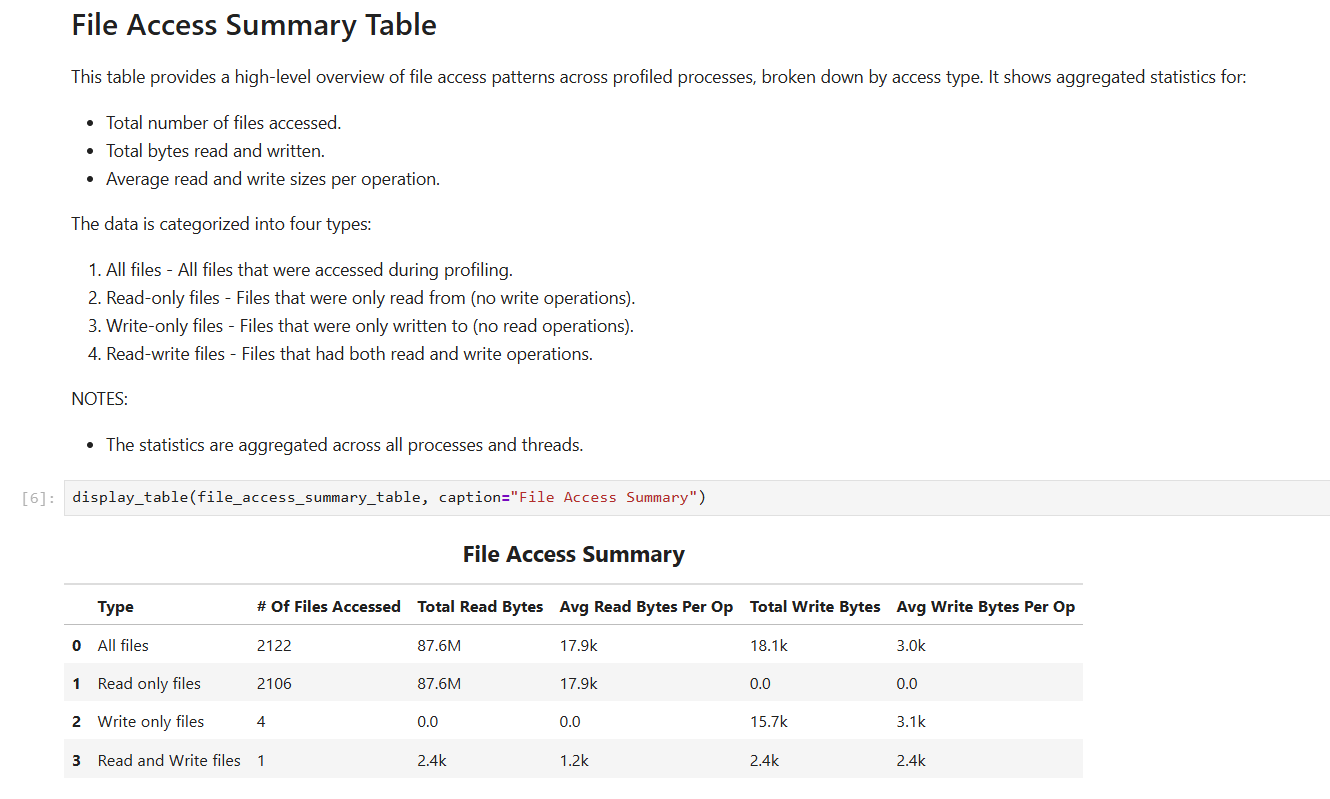
- Hottest Read/Write Files Tables:
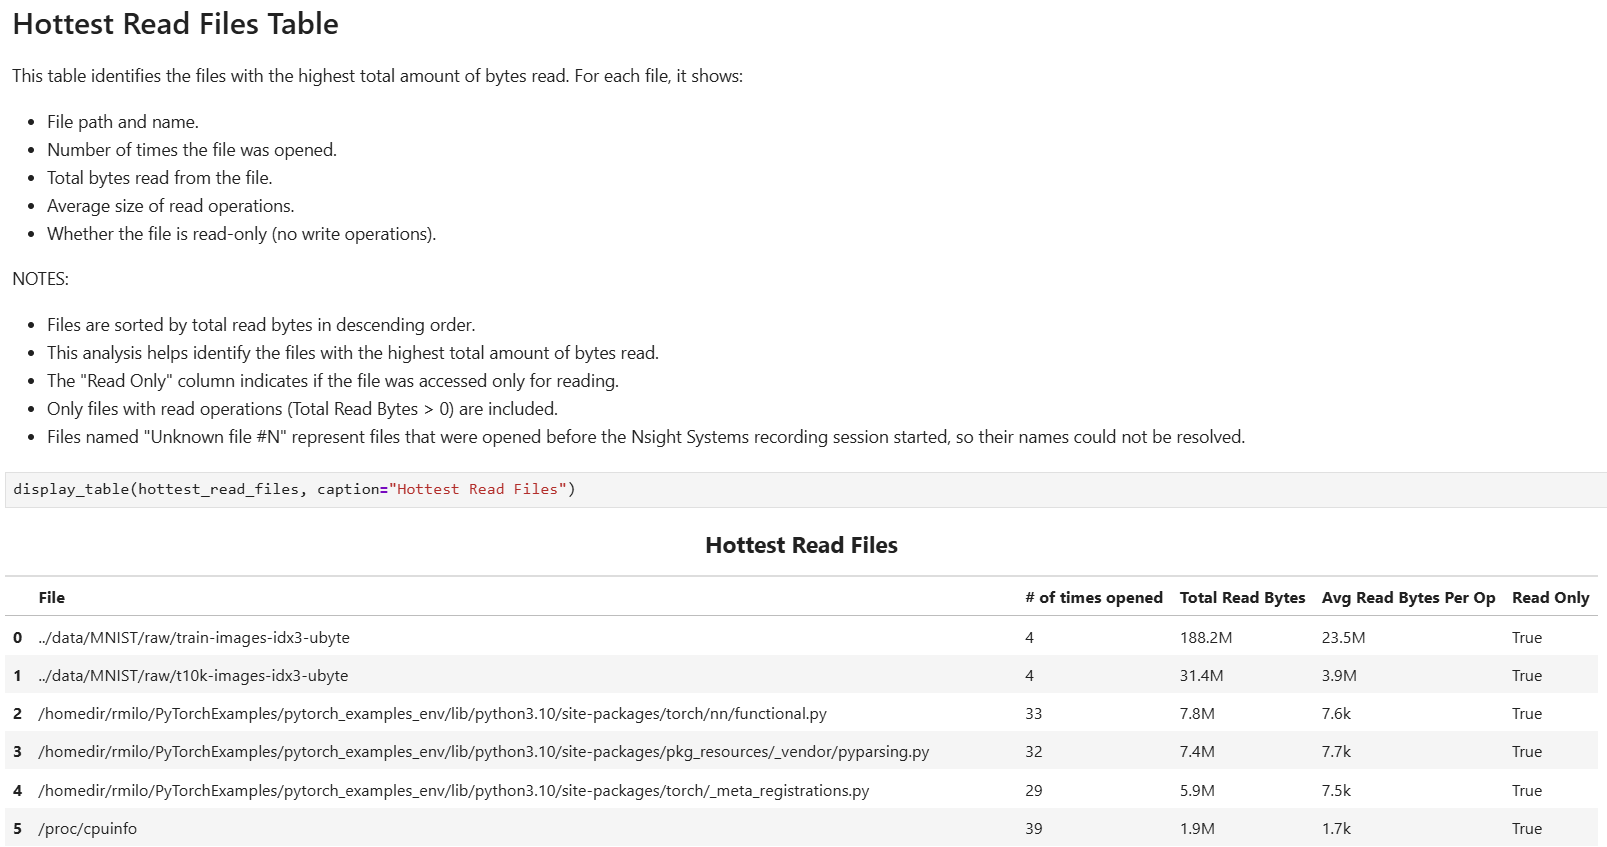
- All Files Table:
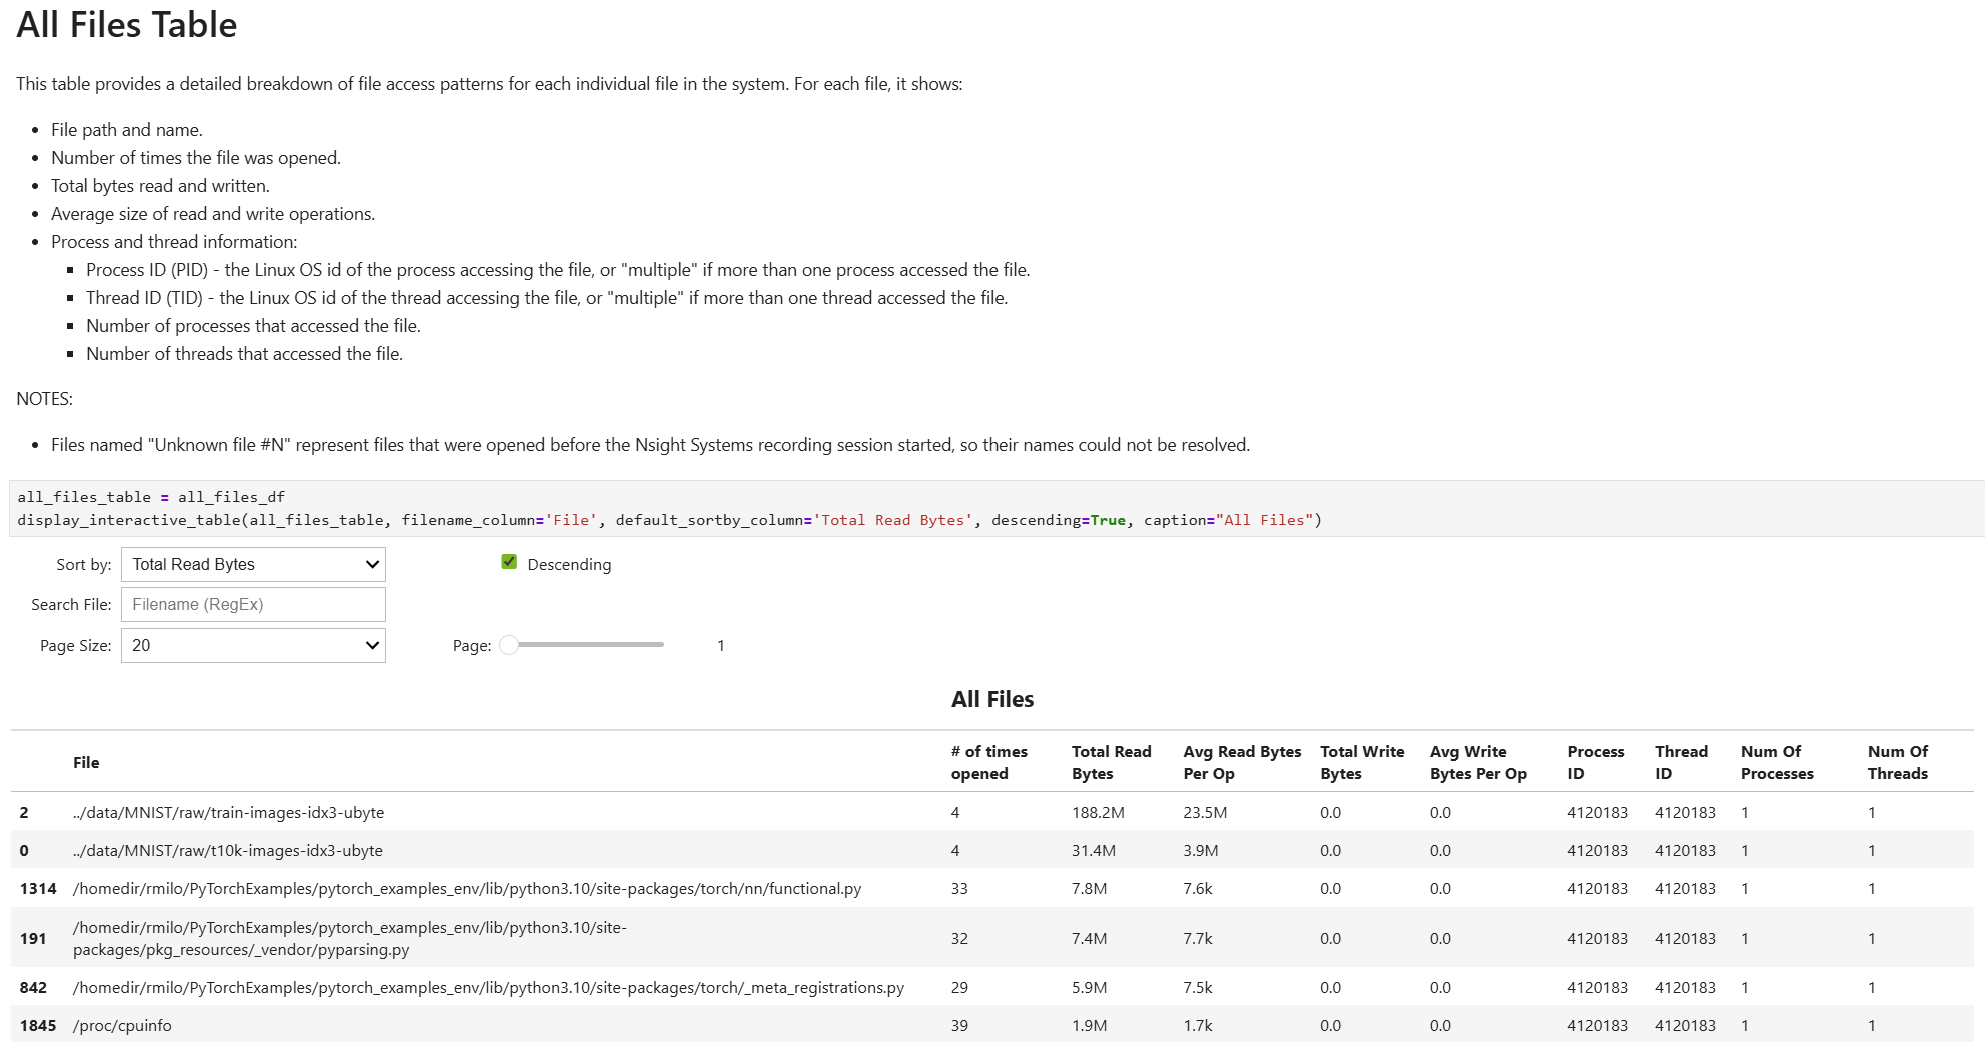
- Read/Write Access Histogram:
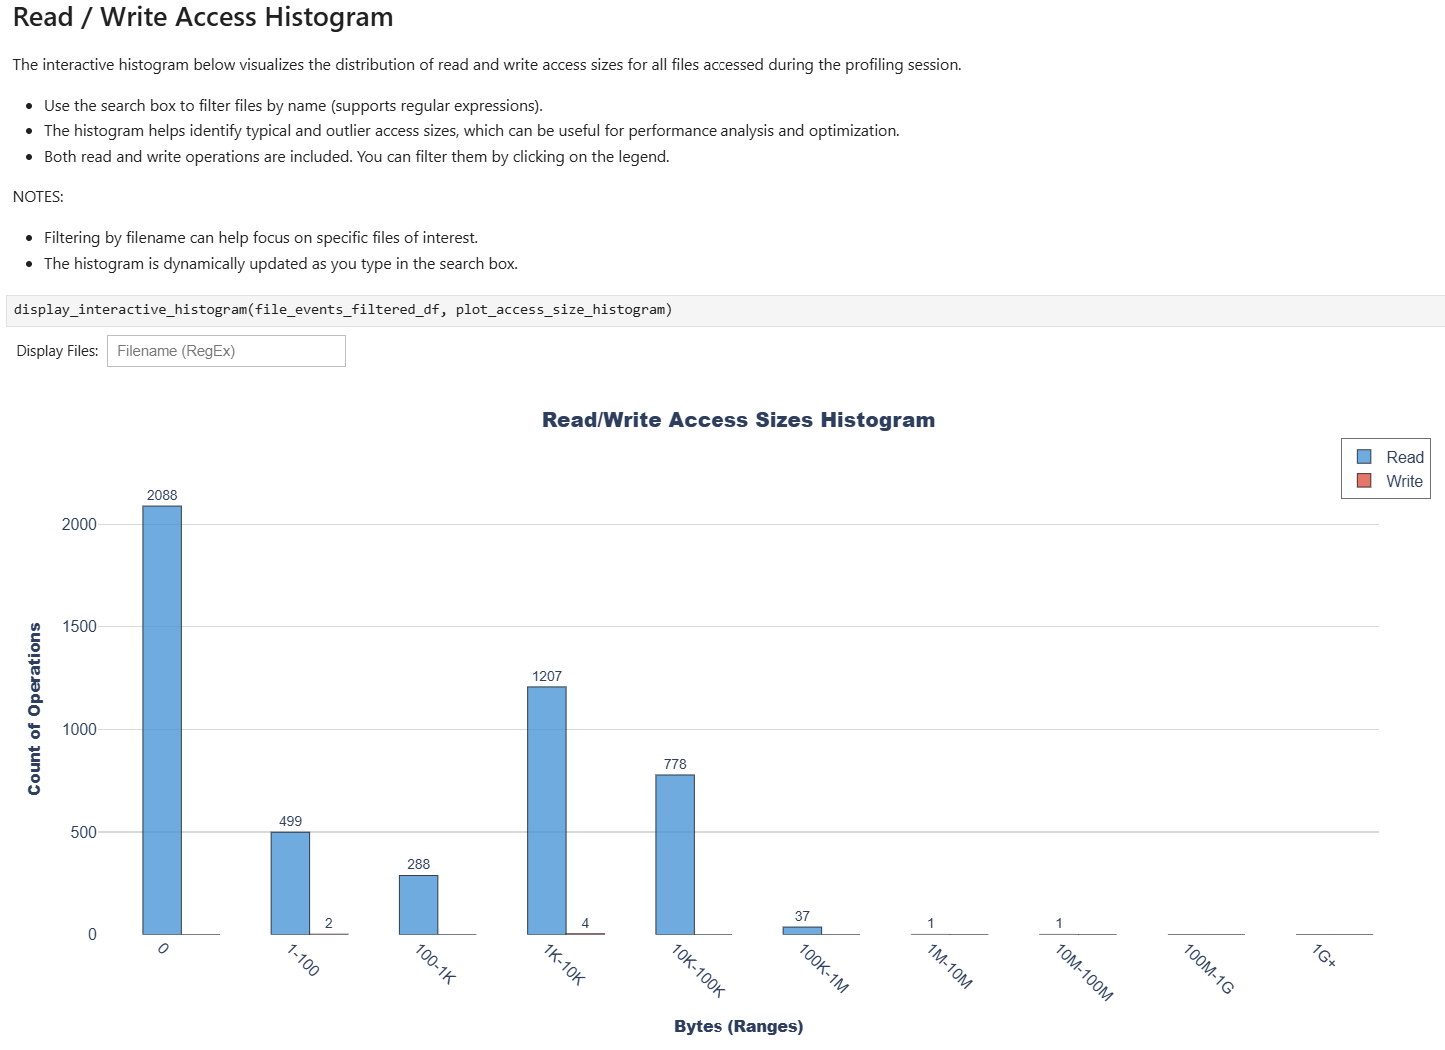
- CPU Time Graph:
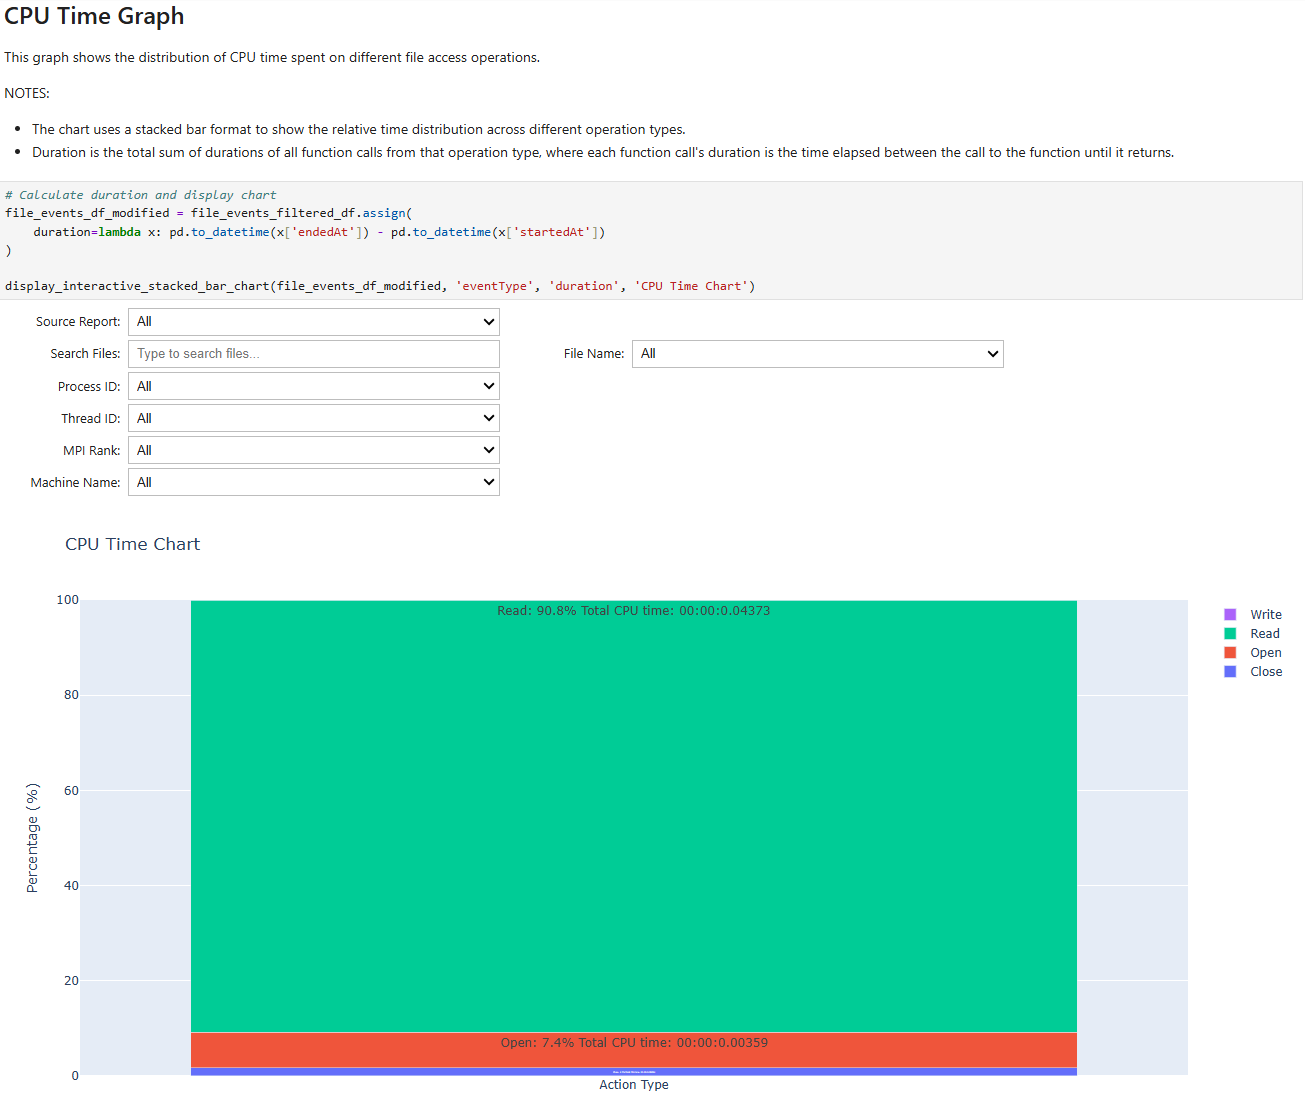
- Operations Count Chart:
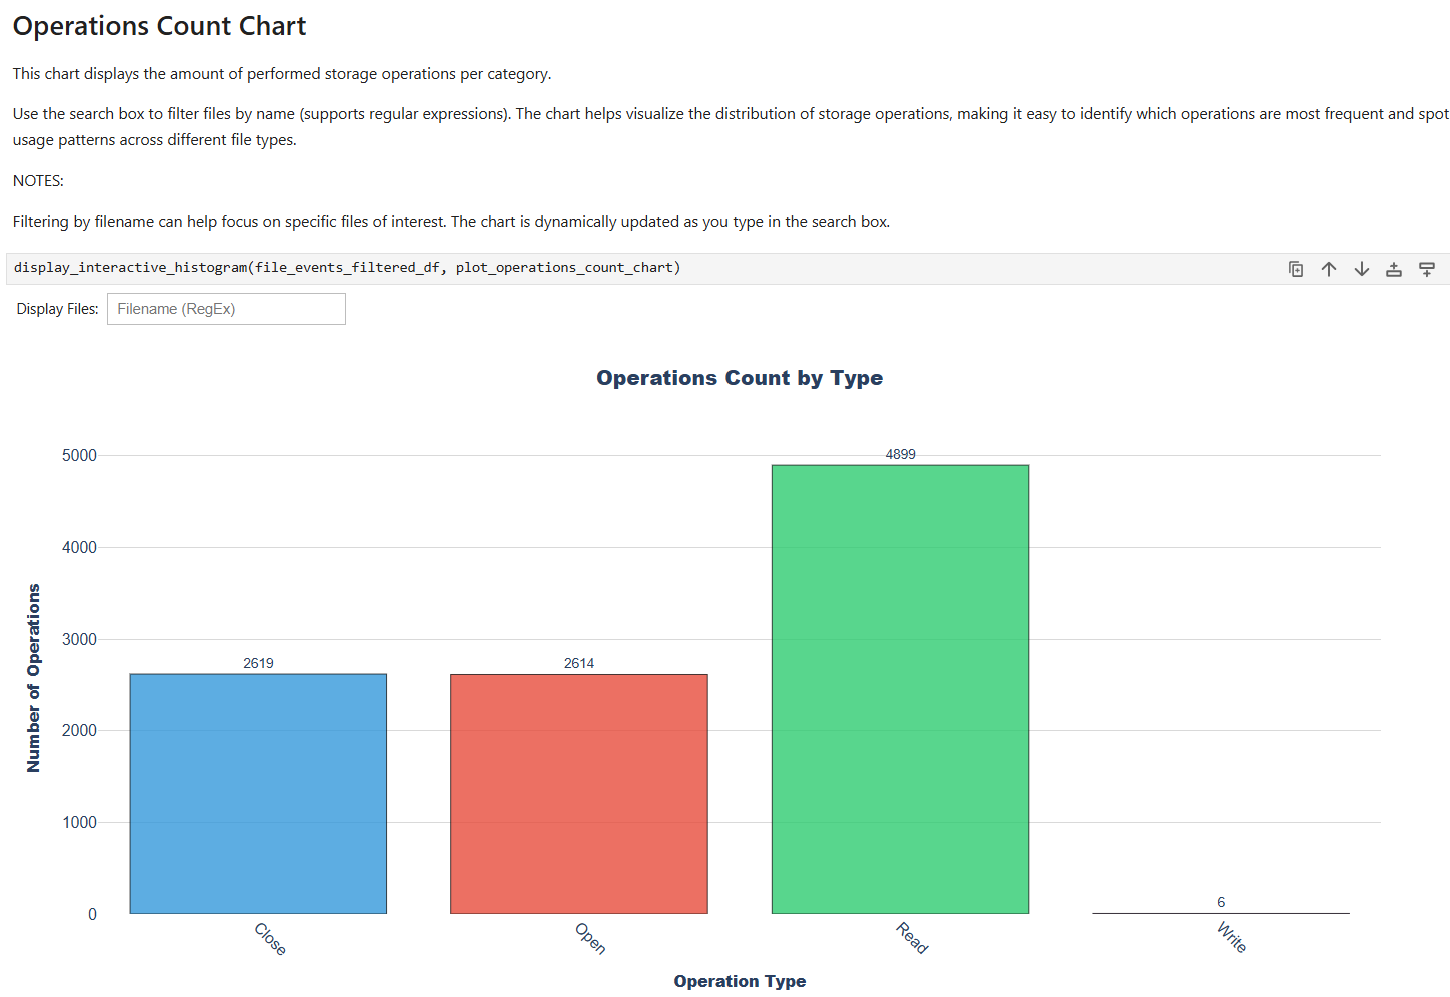
- Performance Analysis:
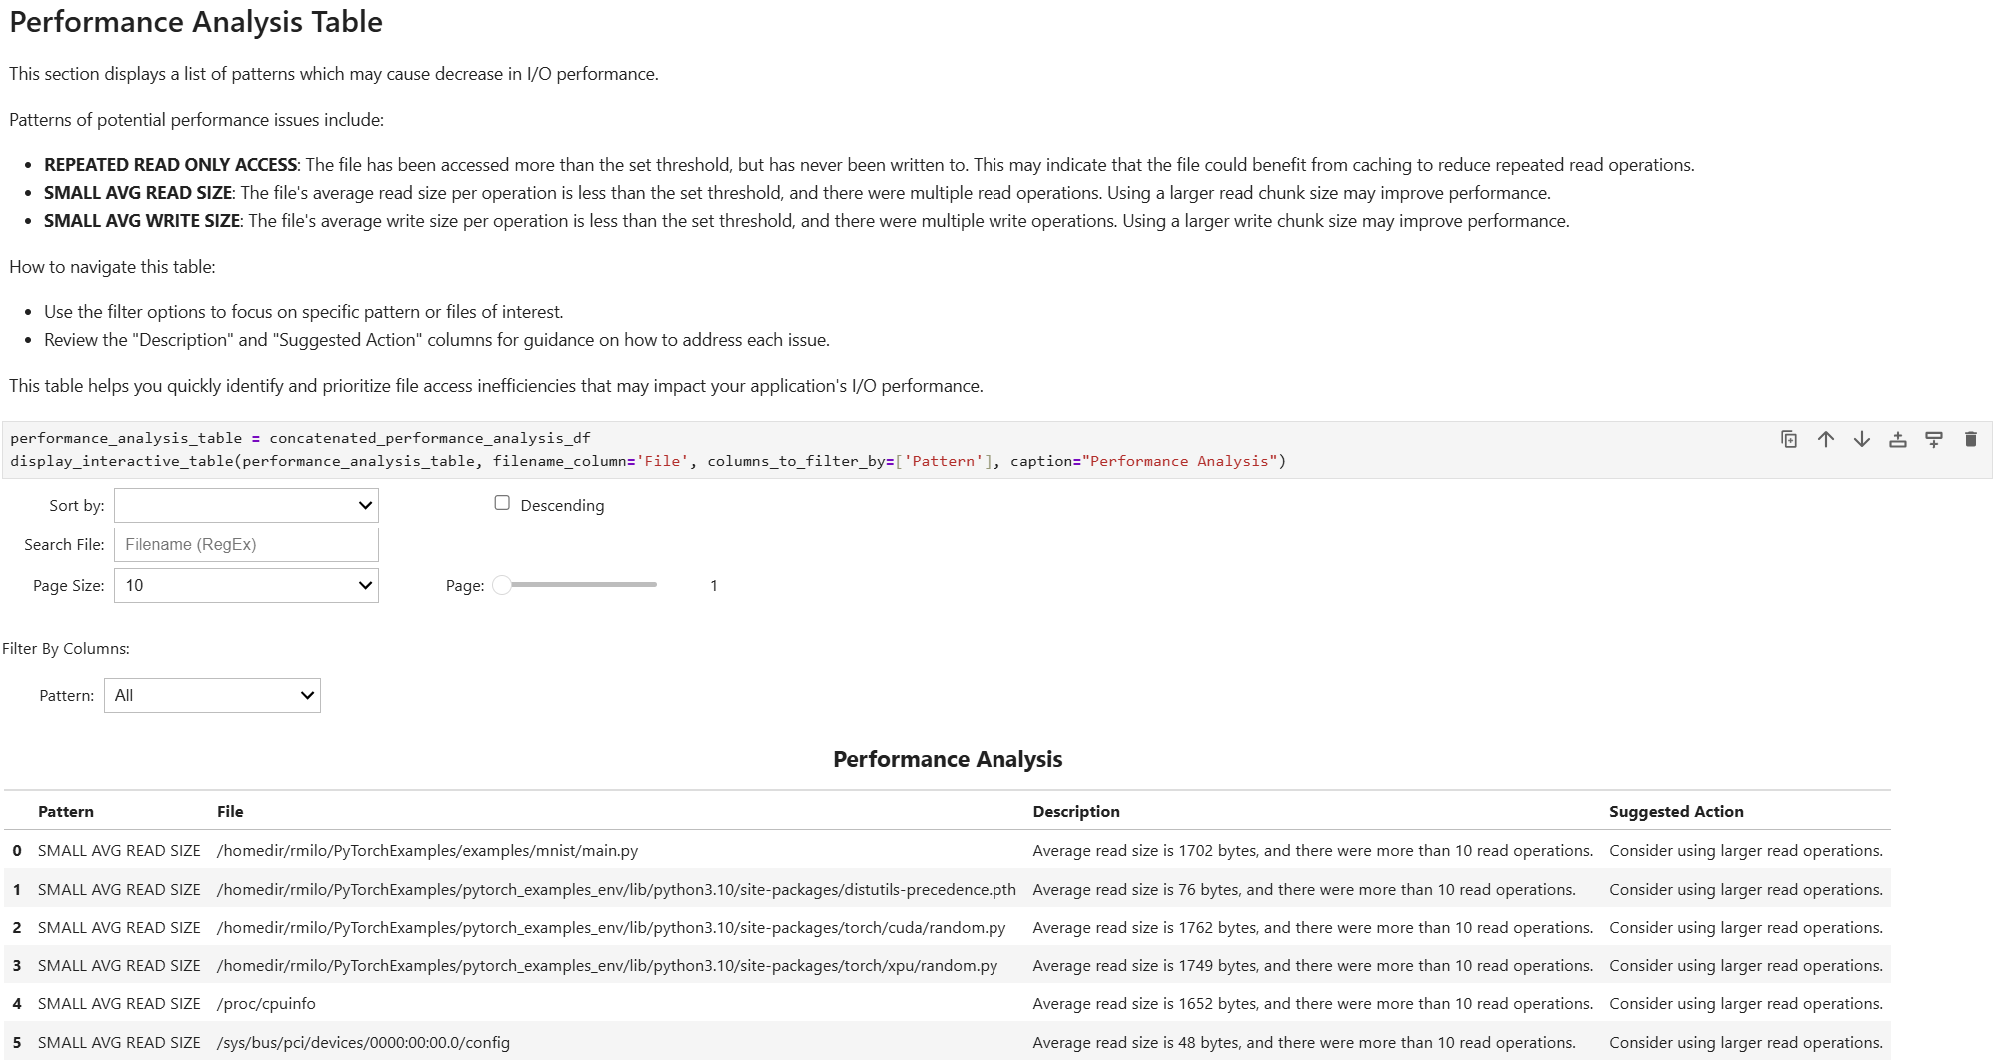
- NVTX Ranges Analysis:
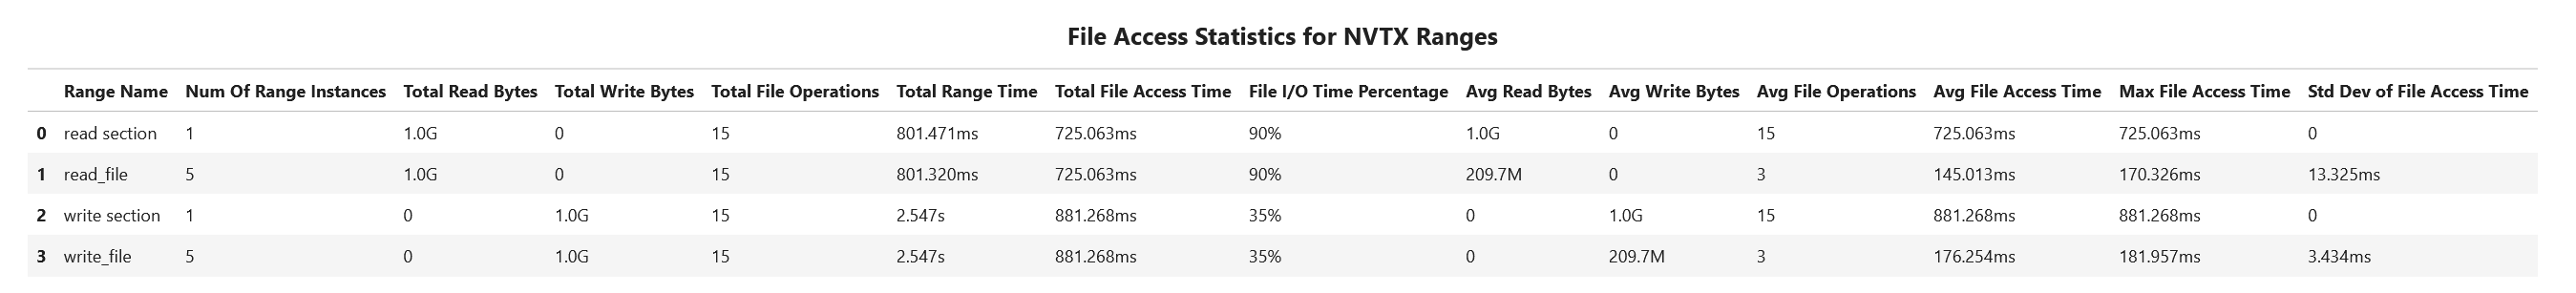
- Recommended Workflow
Start by setting file path ignore patterns to exclude system files from analysis.
Focus on application-specific files during the analysis by using regex filtering.
View the Nsight Systems report file alongside this analysis to gain a deeper understanding of the application’s behavior.
s3_access_sum Recipe#
This recipe analyzes S3 access patterns and I/O statistics from one or more Nsight Systems’ reports, aggregating data across processes and hosts.
Overview
The s3_access_sum recipe generates an interactive Jupyter notebook that analyzes S3 operations captured during profiling sessions. It provides a statistical overview of which buckets and objects were accessed and of access patterns.
Key Capabilities
The recipe provides insights into:
Bucket-Level Summary: Aggregated access statistics per S3 bucket, including object counts, download/upload bytes, and operation counts.
Object Access Patterns: Breakdown of download-only, upload-only, and mixed-access objects.
Hotspot Identification: Top objects by download/upload volume and operation frequency.
Cross-Process Analysis: S3 access patterns across multiple hosts, processes, and threads.
NVTX Range Correlation: S3 activity correlated with user-defined NVTX ranges, such as access-time statistics and I/O volume.
Use Cases
The recipe is particularly valuable for identifying and addressing the following scenarios (but not limited to these):
Hot Buckets and Objects: Identifying which S3 buckets and objects carry the most traffic to focus optimization efforts.
Small or Frequent Operations: Detecting frequent small S3 transfers that could benefit from batching or prefetching.
Application Phase Correlation: Using NVTX ranges to understand which application phases drive the most S3 I/O.
Multi-Rank Comparison: Comparing S3 usage across MPI ranks or hosts to identify load imbalances.
Supported S3 Client Libraries
The recipe counts the following operations from traced S3 client libraries:
AWS CRT (aws-c-s3):
GetObject,PutObject,CopyObjectAWS C++ SDK (aws-cpp-sdk-s3):
GetObject,PutObject,CopyObject,DeleteObject,HeadObject,CreateMultipartUpload,UploadPart,CompleteMultipartUpload,AbortMultipartUpload,ListObjects,ListObjectsV2,CreateBucketBoto3:
get_object,put_object,head_object,upload_part,create_multipart_upload,abort_multipart_upload,generate_presigned_url,generate_presigned_postS3TorchConnector:
SequentialS3Reader.read,S3Writer.writeTensorflow-io:
read,readline,readlines,write,copy,copy_v2viatf.io.gfilewiths3://paths
For more information about S3 tracing capabilities and setup, refer to S3 Trace in the User Guide.
Prerequisites
This recipe requires that Nsight Systems reports be collected with specific tracing parameters:
--trace=s3- Enables S3 operation tracing.This recipe will also work with
--trace=s3-verbose, but does not use any additional data from it.
Optional: To enable tracing of MPI rank information, use
--trace=mpialong with either--mpi-impl=openmpior--mpi-impl=mpich.Optional: To enable the NVTX range correlation table, instrument your application code with NVTX ranges. See Marking and Labeling Regions in the User Guide.
Usage
[1] Create a reports folder.
[2] Collect nsys-rep reports, using '--trace=s3' parameter, and save them to the reports folder.
[3] Run the recipe, using 'nsys recipe s3_access_sum --input [reports folder path]'.
Output
As the main output, the recipe generates an interactive Jupyter notebook
s3_access_stats.ipynb with the following sections:
- Bucket Access Summary:
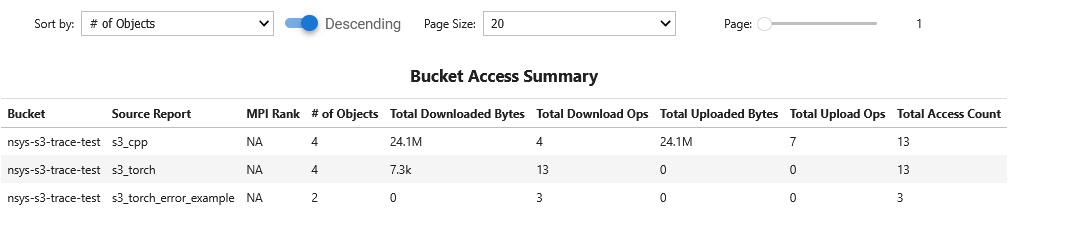
- Objects Access Summary:
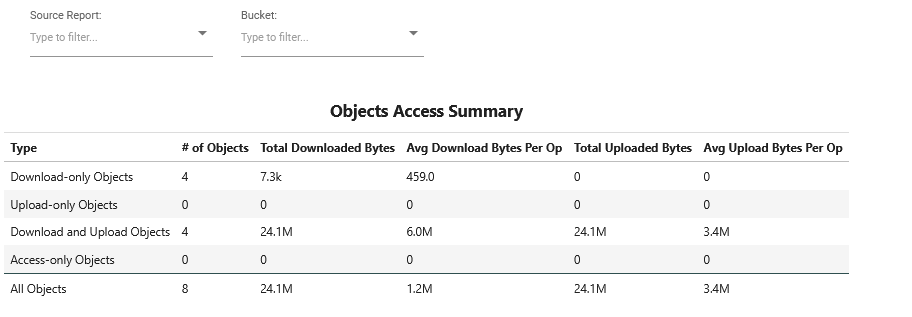
- Hottest Downloaded Objects:
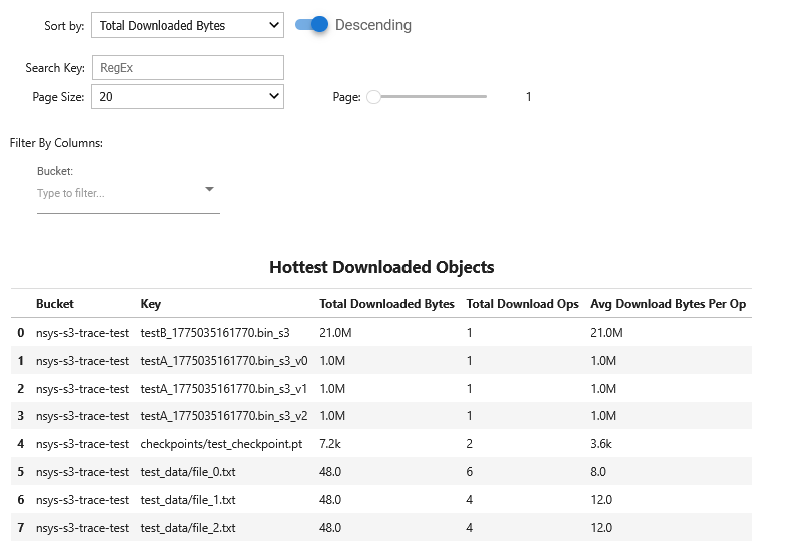
- All Objects Table:
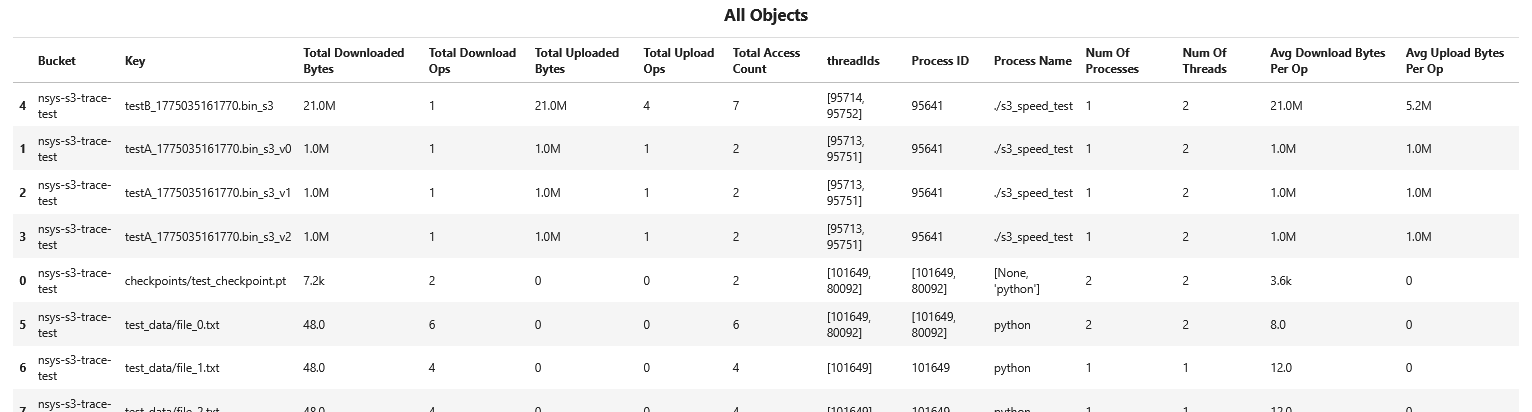
- S3 Access Statistics for NVTX Ranges:
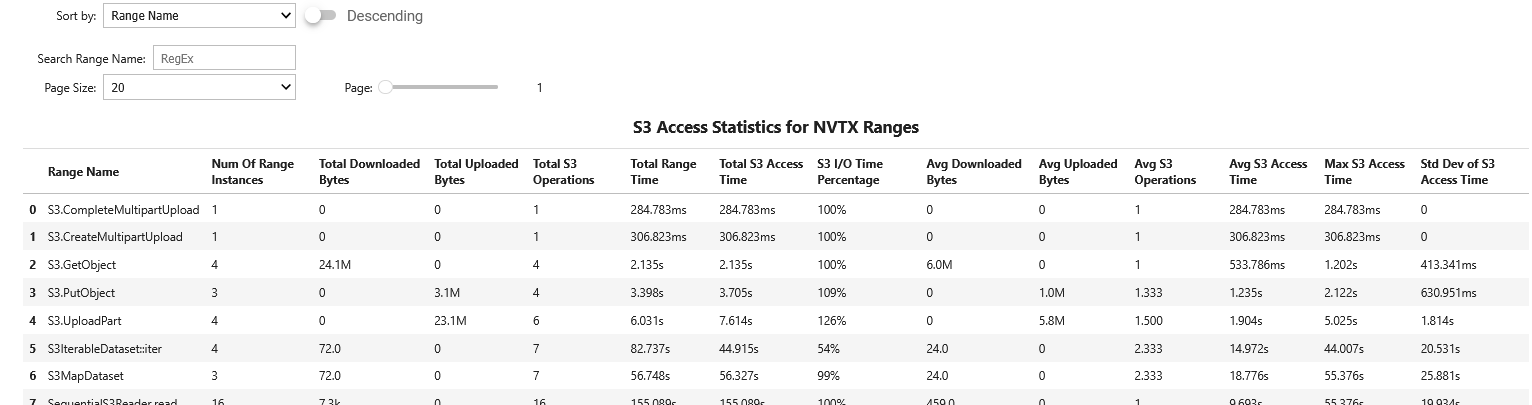
Recipe Catalog and Sample Results#
Post-Collection Analysis enables deep insights into GPU application performance through a curated set of analysis recipes. Each recipe generates specialized visualizations and data summaries from profiling data collected during application execution.
This catalog documents all available recipes, their output formats, and sample results from profiling Llama-70B inference on 8 NVIDIA H100 GPUs using the NVIDIA Dynamo framework.
The recipes are organized by functionality:
CUDA API Recipes: Analyze CUDA kernel launches, memory operations, and synchronization.
GPU Kernel Recipes: Examine kernel execution times, duration distribution, and pacing.
NVTX Recipes: Analyze application-level instrumentation ranges.
Communication Recipes: Study multi-GPU communication patterns, including NCCL and NVLink.
System Recipes: Review OS runtime and I/O operations.
Comparison Recipes: Compare results between different profiling runs.
Each recipe includes sample data tables and visualization mockups representative of real profiling results.
CUDA API Recipes#
CUDA API Summary
Summarizes CUDA API calls by frequency and execution time. Identifies the most time-consuming CUDA operations.
Output Format: Summary table, top items bar chart, and duration distribution box plot.
API Function |
Call Count |
Total Time (us) |
Avg Time (us) |
Max Time (us) |
|---|---|---|---|---|
cudaMemcpy |
2850 |
125400.5 |
43.98 |
650.2 |
cudaLaunchKernel |
5600 |
85300.2 |
15.23 |
420.5 |
cudaDeviceSynchronize |
280 |
34520.0 |
123.29 |
850.3 |
cudaMemset |
450 |
12350.8 |
27.45 |
180.1 |
cudaMalloc |
125 |
8900.3 |
71.20 |
340.2 |

CUDA Synchronization APIs
Advisory analysis identifying synchronization bottlenecks and suggesting optimization strategies.
Output Format: Advisory table with severity levels and recommendations.
Issue |
Severity |
Count |
Total Impact (us) |
Recommendation |
|---|---|---|---|---|
Implicit Synchronization |
HIGH |
45 |
28500 |
Use async transfers with events |
Unnecessary cudaDeviceSynchronize |
MEDIUM |
28 |
12300 |
Replace with stream events |
Blocking Memory Transfers |
MEDIUM |
156 |
45200 |
Use pinned memory for H2D |
CUDA GPU Kernel Recipes#
CUDA GPU Kernel Summary
Comprehensive summary of GPU kernels executed. Shows kernel names, execution counts, and timing statistics.
Output Format: Summary table, top kernels bar chart, and duration distribution box plot.
Kernel Name |
Launch Count |
Total Time (us) |
Avg Time (us) |
Max Time (us) |
|---|---|---|---|---|
volta_sgemm_128x64_nn |
8400 |
2845320.0 |
338.73 |
4250.2 |
attention_forward_kernel |
2800 |
1950200.5 |
696.50 |
2850.3 |
layernorm_forward_kernel |
2800 |
892340.2 |
318.69 |
1620.5 |
fused_mlp_kernel |
2800 |
756200.1 |
270.07 |
1450.2 |
nccl_AllReduce_Ring_LL_Sum_f16 |
560 |
680450.3 |
1214.20 |
3200.1 |

CUDA GPU Kernel Duration Histogram
Distribution of kernel execution durations. Shows frequency of kernels across different execution time ranges.
Output Format: Histogram with distribution statistics and percentile markers.
Duration Range (us) |
Frequency |
Percentage |
Cumulative % |
|---|---|---|---|
100-500 |
1240 |
8.2% |
8.2% |
500-1000 |
2850 |
18.7% |
26.9% |
1000-2000 |
4200 |
27.5% |
54.4% |
2000-4000 |
3950 |
25.9% |
80.3% |
4000+ |
2860 |
18.7% |
99.0% |
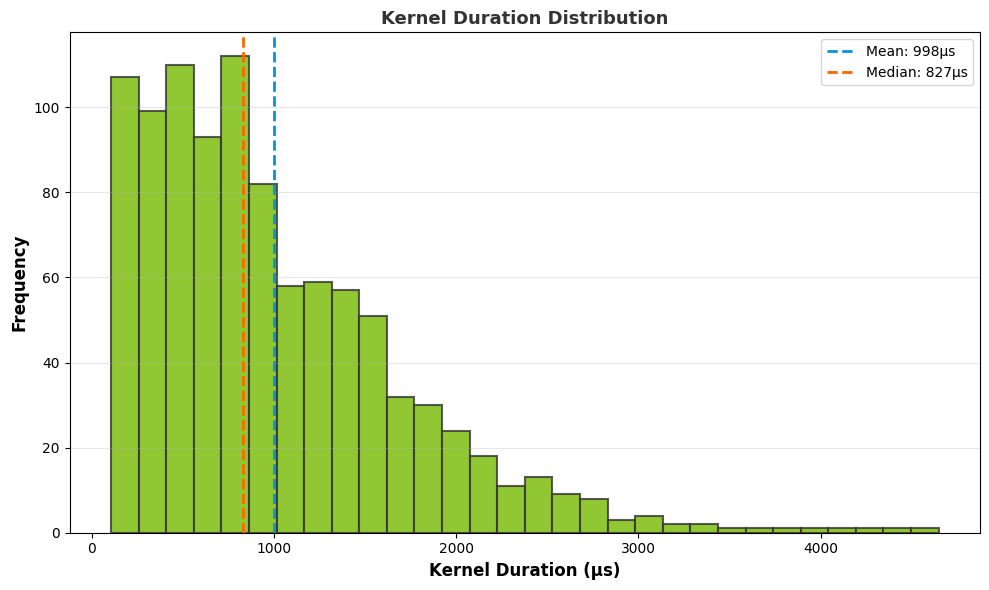
CUDA GPU Kernel Pacing
Consistency analysis of kernel execution times across iterations and GPU ranks. Identifies pacing irregularities.
Output Format: Multi-line chart showing kernel timing per iteration across all GPU ranks.
Iteration |
Rank 0 (us) |
Rank 1 (us) |
Rank 2 (us) |
Rank 3 (us) |
Avg Variance |
|---|---|---|---|---|---|
0 |
1025.3 |
1048.2 |
1032.5 |
1041.8 |
8.6 |
1 |
1032.8 |
1055.3 |
1038.2 |
1049.5 |
8.9 |
2 |
1038.5 |
1062.1 |
1044.8 |
1055.2 |
9.2 |
3 |
1035.2 |
1058.9 |
1040.5 |
1051.8 |
8.7 |
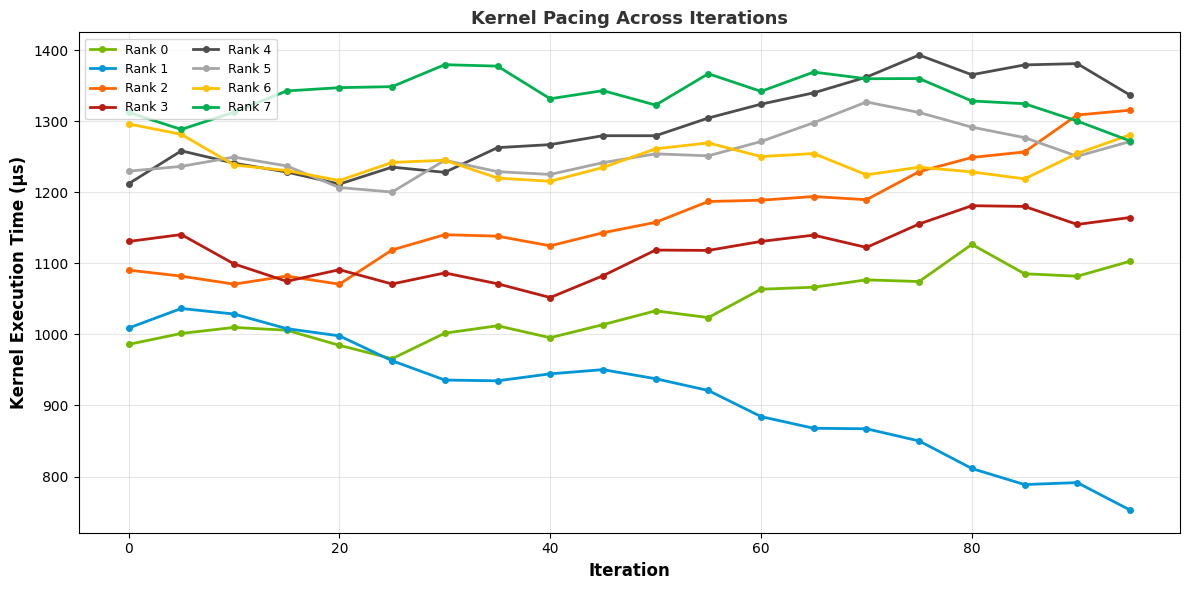
CUDA Memory Operations Recipes#
CUDA GPU MemOps Summary (by Size)
Memory transfer operations grouped by transfer size. Analyzes efficiency of data movement.
Output Format: Summary table, size distribution bar chart, and timing box plot.
Size Range (MB) |
Transfer Count |
Total Data (GB) |
Avg Time (us) |
Bandwidth (GB/s) |
|---|---|---|---|---|
<1 |
8450 |
5.2 |
125.3 |
41.5 |
1-10 |
3200 |
18.5 |
450.2 |
41.0 |
10-100 |
850 |
42.3 |
1850.5 |
22.8 |
100-1000 |
280 |
156.8 |
8520.3 |
18.4 |
1000+ |
45 |
234.5 |
25300.2 |
9.3 |

CUDA GPU MemOps Summary (by Time)
Memory operations sorted by execution time. Identifies most time-consuming memory transfers.
Output Format: Summary table, top operations bar chart, and duration distribution box plot.
Operation Type |
Count |
Total Time (us) |
Avg Time (us) |
Max Time (us) |
|---|---|---|---|---|
H2D Copy |
4200 |
285400.2 |
67.95 |
850.3 |
D2H Copy |
3850 |
256300.5 |
66.57 |
720.2 |
D2D Copy |
2950 |
156800.3 |
53.15 |
580.1 |
Memset |
450 |
12350.8 |
27.45 |
180.5 |
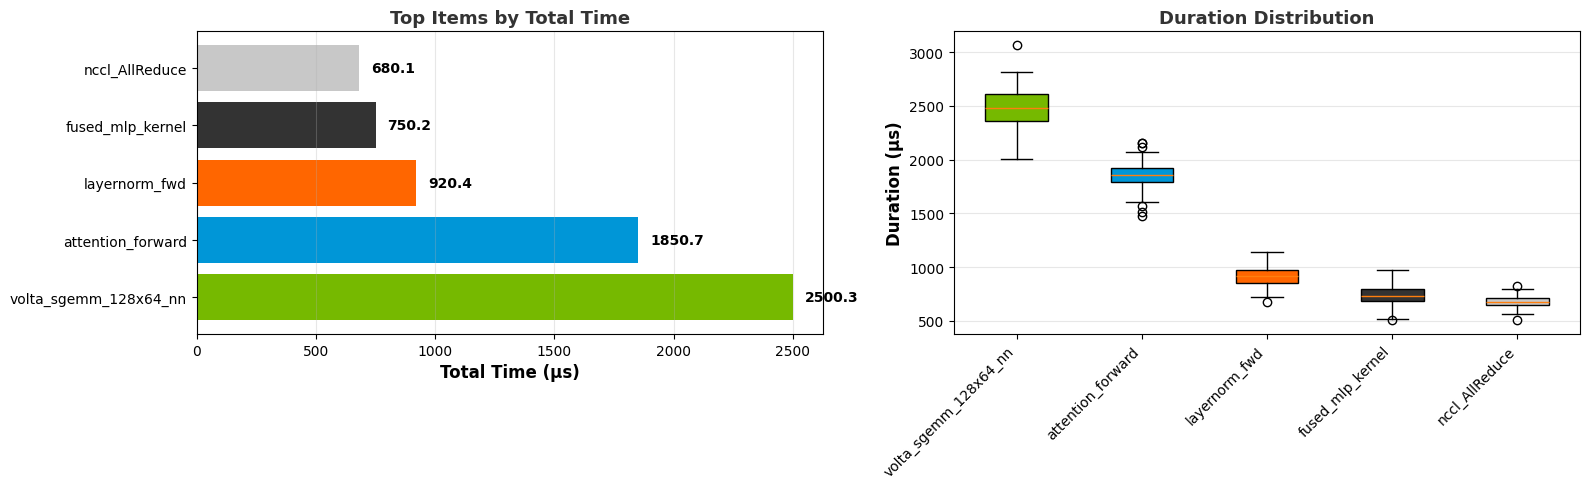
CUDA Synchronous Memcpy
Advisory for synchronous memory copies that may impact performance.
Output Format: Advisory table with impact analysis and optimization suggestions.
Transfer Pattern |
Count |
Total Time (us) |
Severity |
Suggestion |
|---|---|---|---|---|
Pageable H2D |
1250 |
145200 |
HIGH |
Use cuda-pinned memory |
Pageable D2H |
1100 |
128500 |
HIGH |
Implement async with streams |
Device Sync |
280 |
34500 |
MEDIUM |
Use cudaEventSynchronize |
GPU Utilization Recipes#
GPU Metrics Utilization Summary
High-level metrics showing GPU resource utilization, including SM, Memory, Tensor Cores, and related metrics.
Output Format: Summary table, metric utilization bar chart, and distribution box plot.
Metric |
Avg Util (%) |
Max Util (%) |
Peak Time (ms) |
Stalls |
|---|---|---|---|---|
SM Utilization |
78.5 |
95.2 |
245.3 |
12 |
Memory Utilization |
65.3 |
88.1 |
238.5 |
28 |
L1 Cache Hit Rate |
82.4 |
96.1 |
250.2 |
5 |
L2 Cache Hit Rate |
74.2 |
91.3 |
242.8 |
18 |
Tensor Utilization |
81.5 |
94.7 |
246.1 |
8 |

GPU Metric Utilization Heatmap
Time-series heatmap showing metric utilization across GPU ranks over profiling duration.
Output Format: 2D heatmap with GPU ranks on the y-axis, time bins on the x-axis, and utilization percentage color-coded.
GPU Rank |
T0-T100 (%) |
T100-T200 (%) |
T200-T300 (%) |
T300-T400 (%) |
Avg (%) |
|---|---|---|---|---|---|
Rank 0 |
82 |
85 |
79 |
84 |
82.5 |
Rank 1 |
80 |
83 |
78 |
82 |
80.8 |
Rank 2 |
81 |
84 |
80 |
85 |
82.5 |
Rank 3 |
79 |
82 |
77 |
81 |
79.8 |
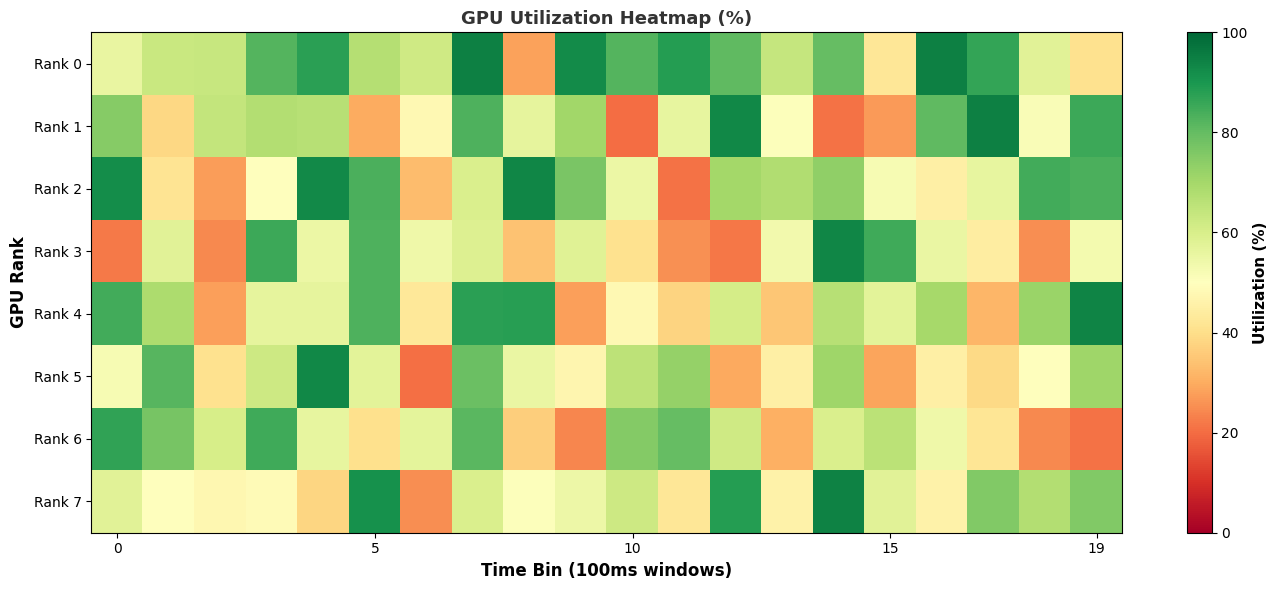
Graphics VRAM Usage
Memory allocation and deallocation trace showing VRAM consumption over time.
Output Format: Time-series line chart with peak VRAM markers and allocation events.
Time (ms) |
Allocated (MB) |
Free (MB) |
Total GPU Mem (MB) |
Peak Usage (%) |
|---|---|---|---|---|
0 |
2048 |
77952 |
80000 |
2.6% |
100 |
8192 |
71808 |
80000 |
10.2% |
200 |
24576 |
55424 |
80000 |
30.7% |
300 |
38912 |
41088 |
80000 |
48.6% |
400 |
42048 |
37952 |
80000 |
52.6% |

GPU Time Utilization
Advisory on GPU idle time, gaps, and utilization efficiency.
Output Format: Advisory table with gap analysis and improvement suggestions.
GPU |
Active Time (ms) |
Idle Time (ms) |
Util (%) |
Largest Gap (us) |
Recommendation |
|---|---|---|---|---|---|
GPU 0 |
485.2 |
14.8 |
96.8% |
2850 |
Excellent utilization |
GPU 1 |
478.5 |
21.5 |
95.7% |
3200 |
Minor gaps detected |
GPU 2 |
475.3 |
24.7 |
95.1% |
3850 |
Check kernel dependencies |
GPU 3 |
472.8 |
27.2 |
94.6% |
4100 |
Optimize host-device sync |
GPU Gaps
Identifies periods of GPU inactivity and analyzes root causes.
Output Format: Gap summary table with timeline and impact analysis.
Gap ID |
Start (us) |
Duration (us) |
GPU |
Probable Cause |
Impact |
|---|---|---|---|---|---|
Gap_001 |
125340 |
2850 |
GPU 0 |
Host-Device Sync |
Kernel stall |
Gap_002 |
245820 |
3200 |
GPU 1 |
Memory Transfer |
Pipeline flush |
Gap_003 |
385500 |
1950 |
GPU 2 |
Context Switch |
Minor impact |
Gap_004 |
458200 |
4100 |
GPU 3 |
Host Queue Latency |
Kernel delay |
NVTX Range Recipes#
NVTX Range Summary
Summary of NVIDIA Tools eXtension (NVTX) instrumentation ranges in application code.
Output Format: Summary table, top ranges bar chart, and duration distribution box plot.
Range Name |
Count |
Total Time (us) |
Avg Time (us) |
Max Time (us) |
|---|---|---|---|---|
forward_pass |
280 |
1850320.5 |
6608.29 |
8520.3 |
attention_compute |
2800 |
950200.2 |
339.36 |
2850.1 |
mlp_compute |
2800 |
756300.8 |
270.11 |
1520.2 |
backward_pass |
280 |
1420500.3 |
5073.21 |
7250.3 |
parameter_update |
280 |
385200.1 |
1375.71 |
2100.5 |
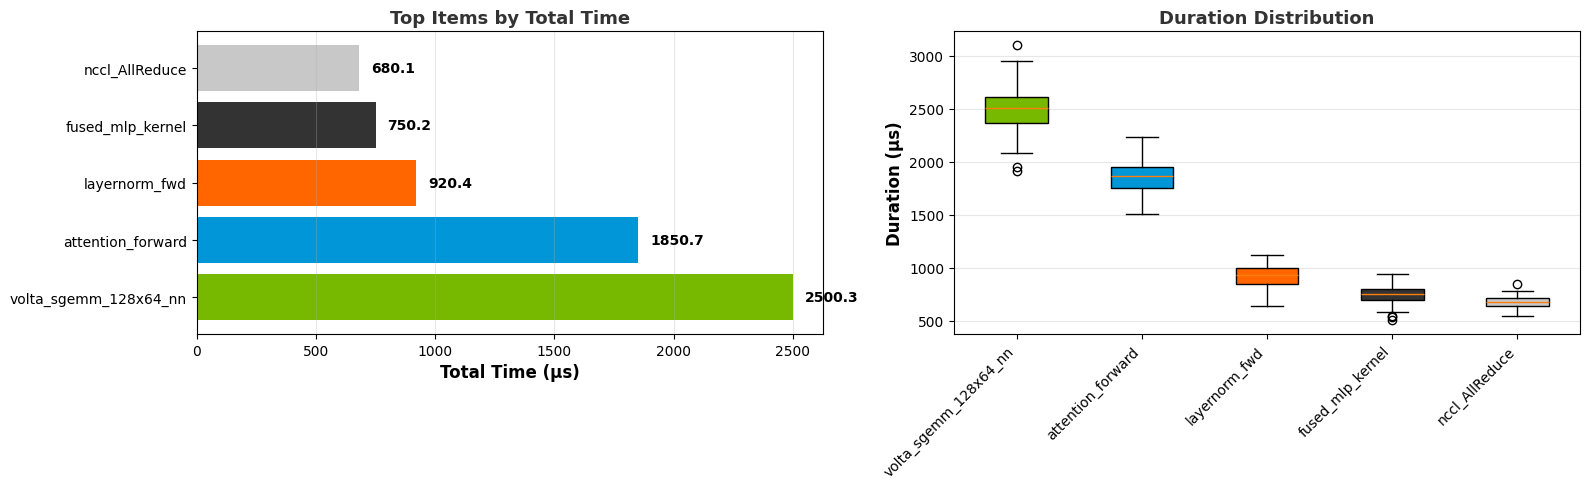
NVTX Pacing
Pacing consistency analysis of NVTX ranges across iterations.
Output Format: Multi-line chart showing range timing per iteration across GPU ranks.
Iteration |
Rank 0 (us) |
Rank 1 (us) |
Rank 2 (us) |
Rank 3 (us) |
Std Dev |
|---|---|---|---|---|---|
0 |
6580.2 |
6625.8 |
6590.5 |
6612.3 |
15.8 |
1 |
6598.5 |
6642.1 |
6608.2 |
6630.5 |
16.2 |
2 |
6612.3 |
6658.9 |
6622.8 |
6645.2 |
16.8 |
3 |
6625.8 |
6672.5 |
6638.5 |
6660.1 |
17.3 |
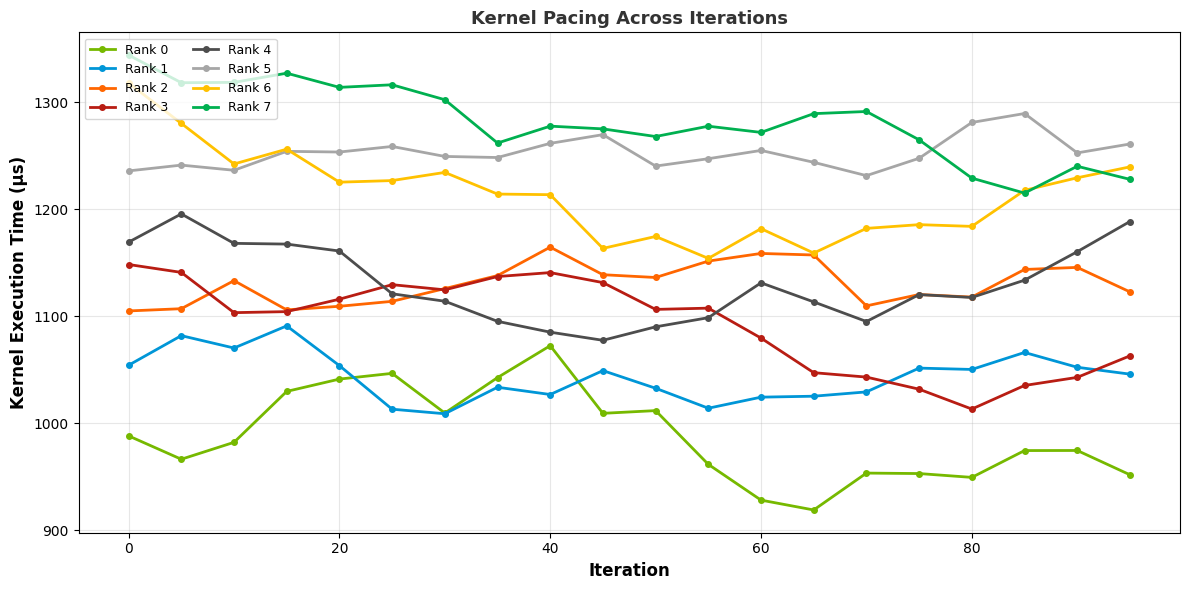
NVTX GPU Projection Summary
GPU utilization projection for NVTX ranges. Shows estimated GPU time within each range.
Output Format: Summary table with GPU projection metrics, bar chart, and box plot.
Range Name |
GPU Time (us) |
Total Time (us) |
GPU % |
Kernel Calls |
|---|---|---|---|---|
forward_pass |
1750280.3 |
1850320.5 |
94.6% |
2850 |
attention_compute |
905200.5 |
950200.2 |
95.3% |
2800 |
mlp_compute |
725300.2 |
756300.8 |
95.9% |
2800 |
backward_pass |
1385400.1 |
1420500.3 |
97.5% |
2800 |
parameter_update |
370200.8 |
385200.1 |
96.1% |
280 |

NVTX GPU Projection Pacing
Consistency of GPU utilization for NVTX ranges across iterations and ranks.
Output Format: Multi-line pacing chart with GPU projection metrics.
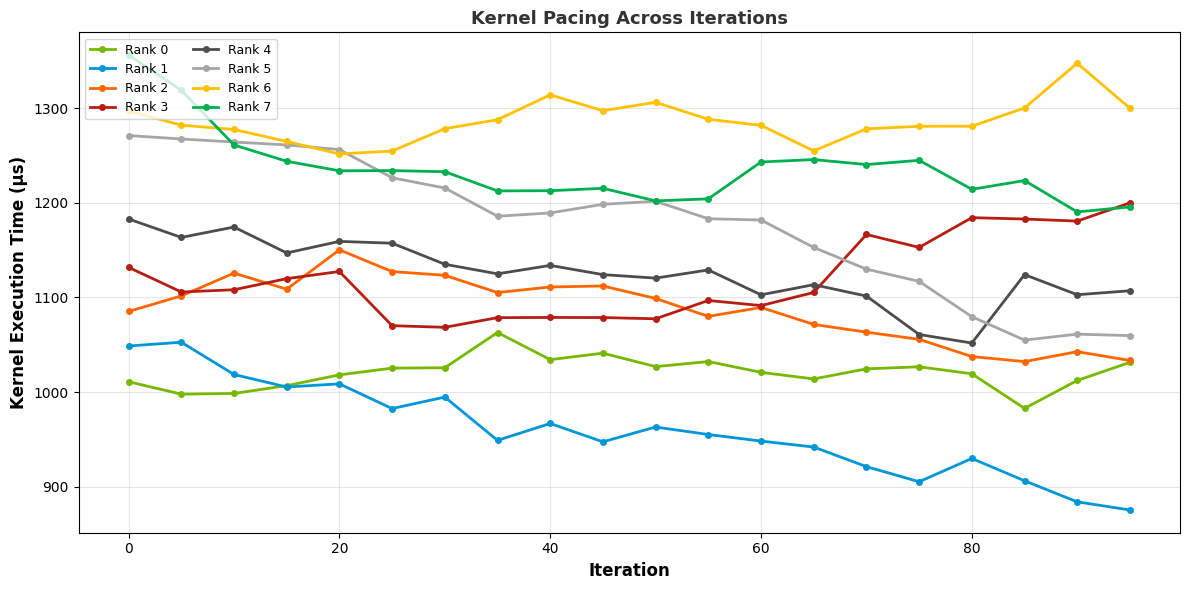
NVTX GPU Projection Trace
Detailed trace showing compute versus communication overlap within NVTX ranges.
Output Format: Overlap matrix and timeline visualization.
Range |
Compute (us) |
Comm (us) |
Overlap (us) |
Overlap % |
|---|---|---|---|---|
forward_pass |
1650280 |
185320 |
152850 |
82.5% |
attention_compute |
850200 |
120200 |
98560 |
82.0% |
mlp_compute |
725300 |
95300 |
78520 |
82.5% |
backward_pass |
1285400 |
210500 |
172450 |
81.9% |
parameter_update |
285200 |
65200 |
52850 |
81.0% |
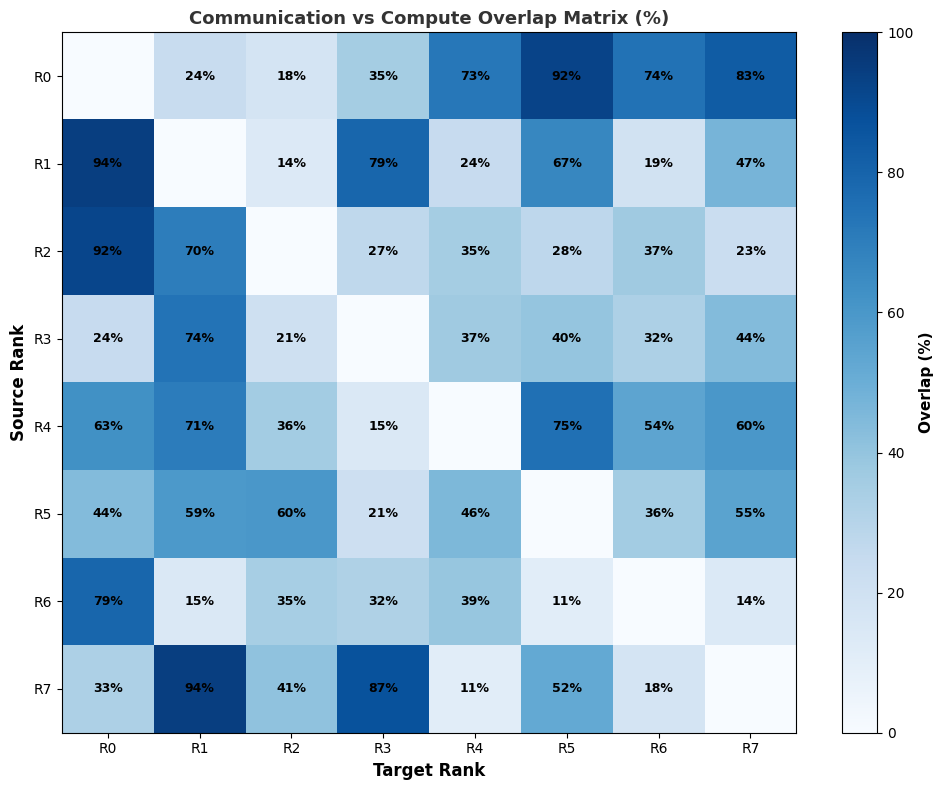
Communication & NCCL Recipes#
NCCL Summary
Comprehensive summary of NVIDIA Collective Communications Library (NCCL) operations.
Output Format: Summary table, operation distribution bar chart, and timing box plot.
Operation |
Count |
Total Time (us) |
Avg Time (us) |
Max Time (us) |
|---|---|---|---|---|
AllReduce |
560 |
680450.3 |
1214.20 |
3200.1 |
ReduceScatter |
560 |
520300.5 |
928.75 |
2850.2 |
AllGather |
560 |
485200.2 |
866.07 |
2520.3 |
Broadcast |
280 |
185300.8 |
661.79 |
1850.2 |
Barrier |
560 |
125400.1 |
223.93 |
620.5 |

NCCL GPU Projection Summary
GPU utilization during NCCL operations. Breaks down compute versus communication time.
Output Format: Summary table with GPU projection, bar chart, and box plot.
NCCL Op |
GPU Time (us) |
Total Time (us) |
GPU Util % |
Rank Participation |
|---|---|---|---|---|
AllReduce |
645200.2 |
680450.3 |
94.8% |
8 |
ReduceScatter |
485300.1 |
520300.5 |
93.3% |
8 |
AllGather |
450200.3 |
485200.2 |
92.8% |
8 |
Broadcast |
175300.5 |
185300.8 |
94.6% |
8 |
Barrier |
118200.2 |
125400.1 |
94.3% |
8 |
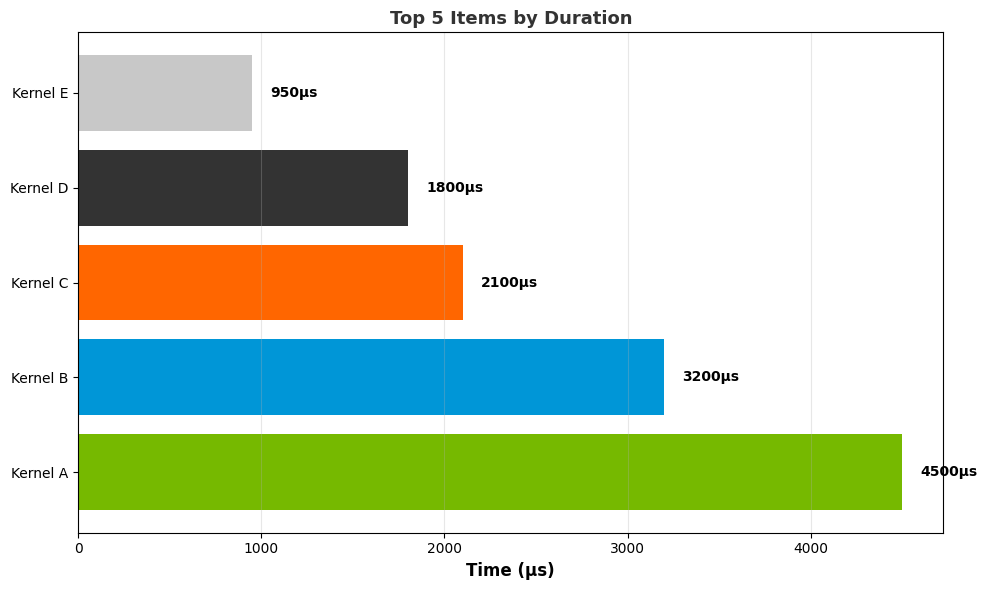
NCCL GPU Time Utilization Heatmap
Time-series heatmap of GPU utilization during NCCL operations across all ranks.
Output Format: 2D heatmap with GPU ranks on the y-axis and time bins on the x-axis.
GPU Rank |
T0 (%) |
T1 (%) |
T2 (%) |
T3 (%) |
Avg (%) |
|---|---|---|---|---|---|
Rank 0 |
92 |
94 |
93 |
95 |
93.5 |
Rank 1 |
90 |
92 |
91 |
93 |
91.5 |
Rank 2 |
91 |
93 |
92 |
94 |
92.5 |
Rank 3 |
89 |
91 |
90 |
92 |
90.5 |
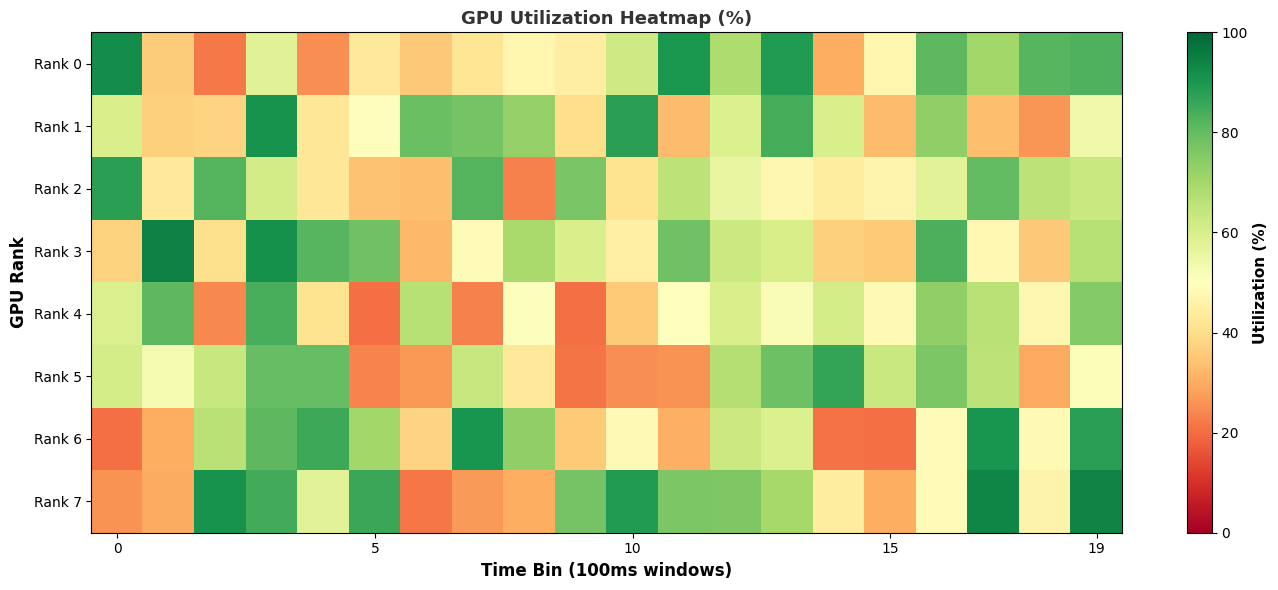
NCCL GPU Overlap Trace
Overlap analysis between communication and compute during NCCL operations.
Output Format: Overlap matrix showing communication overlap percentages between ranks.
Op |
Overlap % |
Compute Time (us) |
Comm Time (us) |
Concurrent Time (us) |
|---|---|---|---|---|
AllReduce |
78.5 |
620300 |
145200 |
113850 |
ReduceScatter |
76.2 |
450200 |
98500 |
75000 |
AllGather |
74.8 |
425300 |
85200 |
63800 |
Broadcast |
72.5 |
160300 |
32500 |
23600 |
Barrier |
65.3 |
108200 |
18500 |
12100 |
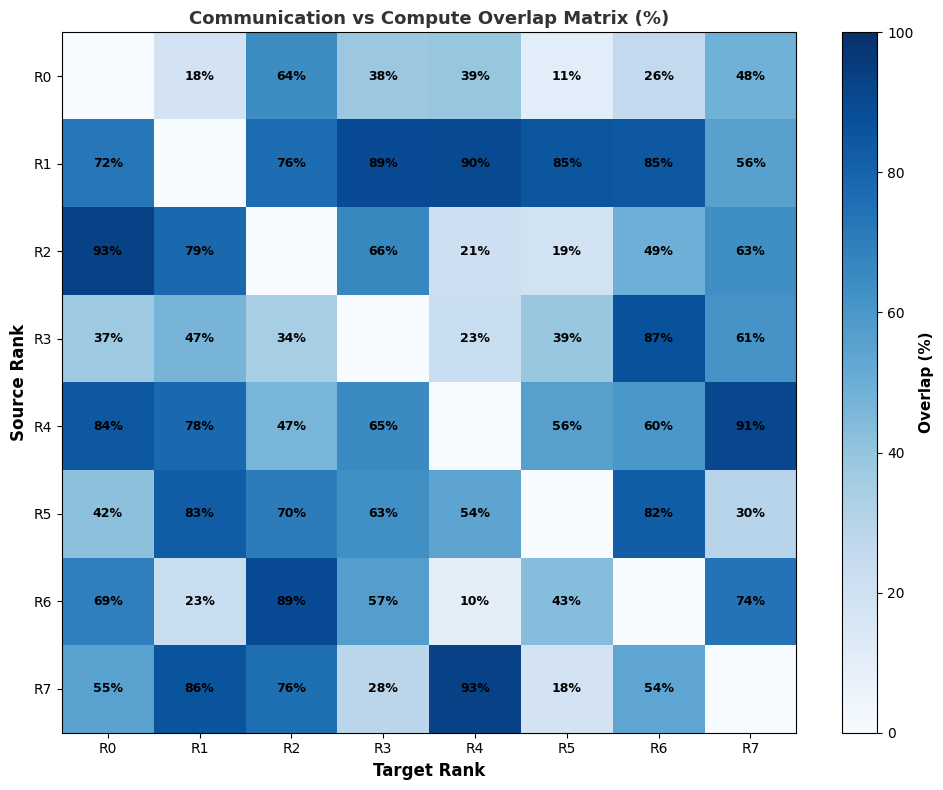
Network & Storage Recipes#
Network Traffic Summary
Summary of network I/O operations and traffic patterns.
Output Format: Summary table, traffic distribution bar chart, and timing box plot.
Interface |
Packets |
Bytes (MB) |
Avg Latency (us) |
Max Latency (us) |
|---|---|---|---|---|
eth0 |
85230 |
2048.5 |
125.3 |
850.2 |
eth1 |
75600 |
1820.3 |
130.5 |
920.3 |
InfiniBand |
125400 |
3200.8 |
85.2 |
520.1 |

Network Devices Traffic Heatmap
Time-series heatmap showing network device utilization over profiling duration.
Output Format: 2D heatmap with network devices on the y-axis and time bins on the x-axis.
Device |
T0 (Mb/s) |
T1 (Mb/s) |
T2 (Mb/s) |
T3 (Mb/s) |
Avg (Mb/s) |
|---|---|---|---|---|---|
eth0 |
2500 |
2350 |
2400 |
2450 |
2425 |
eth1 |
2200 |
2100 |
2150 |
2200 |
2162 |
InfiniBand |
3500 |
3400 |
3450 |
3550 |
3475 |
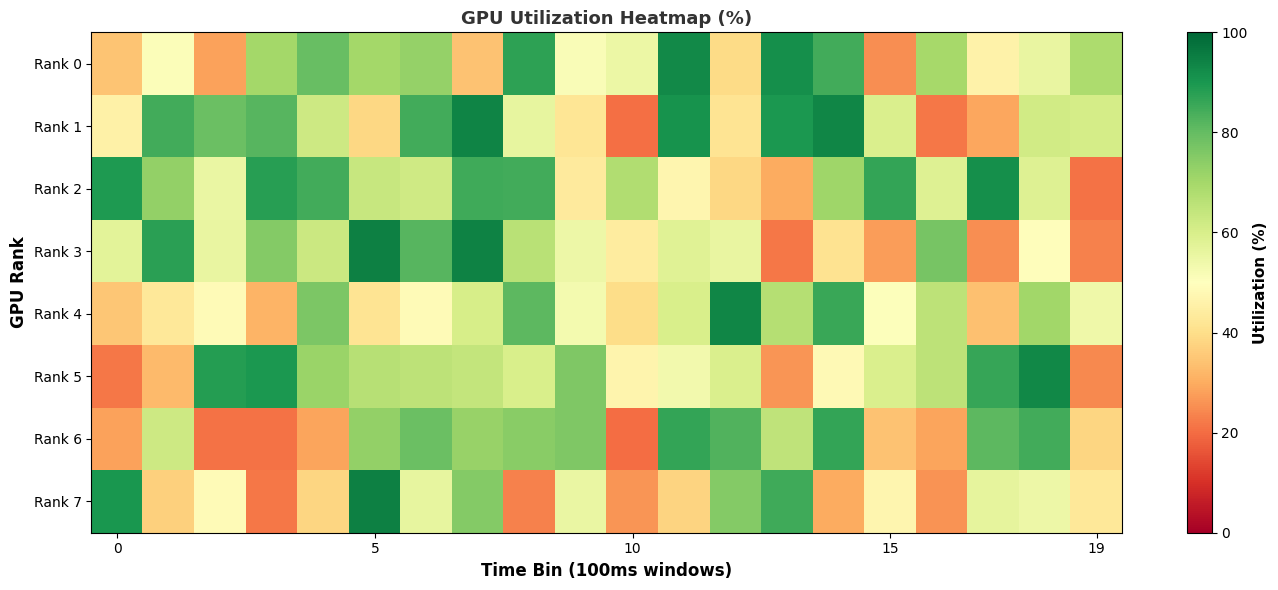
AWS Metrics Heatmap
CloudWatch metrics heatmap for AWS-deployed systems.
Output Format: Heatmap of AWS metrics, including CPU, Memory, and Network, over time.
Metric |
T0 (%) |
T1 (%) |
T2 (%) |
T3 (%) |
Avg (%) |
|---|---|---|---|---|---|
CPU Util |
75 |
78 |
76 |
79 |
77.0 |
Memory Util |
62 |
64 |
63 |
65 |
63.5 |
Network Util |
58 |
60 |
59 |
62 |
59.8 |
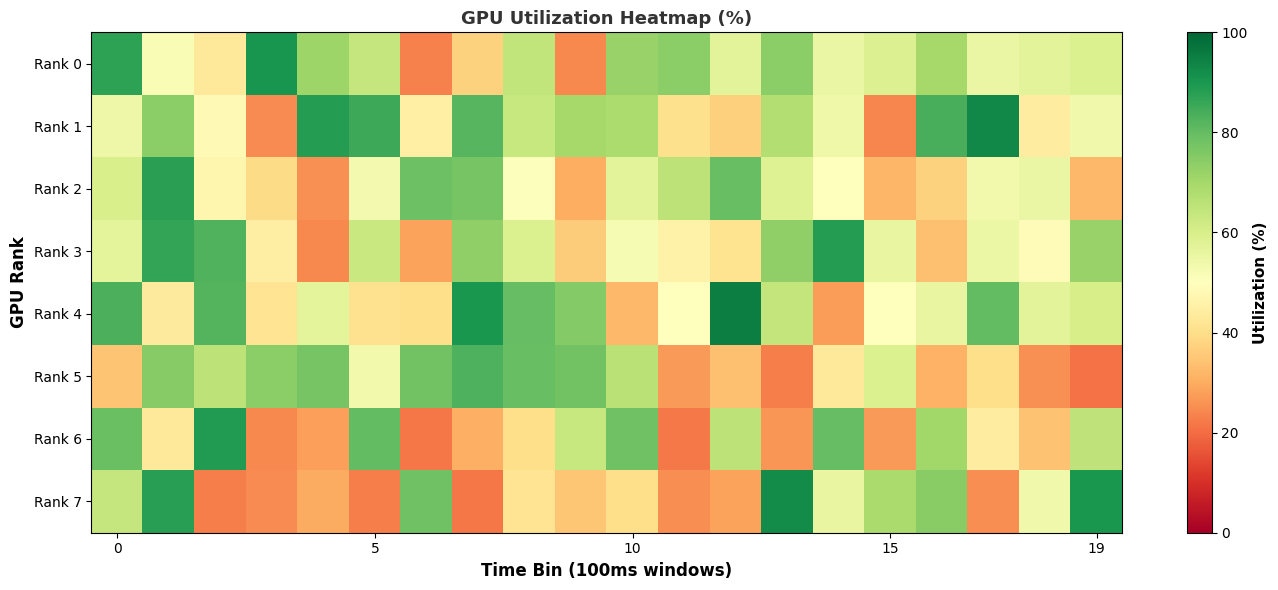
Storage Metrics Heatmap
Storage I/O and utilization metrics over profiling duration.
Output Format: Heatmap showing storage device utilization percentages.
Storage Device |
T0 (%) |
T1 (%) |
T2 (%) |
T3 (%) |
Avg (%) |
|---|---|---|---|---|---|
NVMe-0 |
45 |
48 |
46 |
50 |
47.25 |
NVMe-1 |
42 |
44 |
43 |
46 |
43.75 |
HDD-0 |
28 |
30 |
29 |
32 |
29.75 |
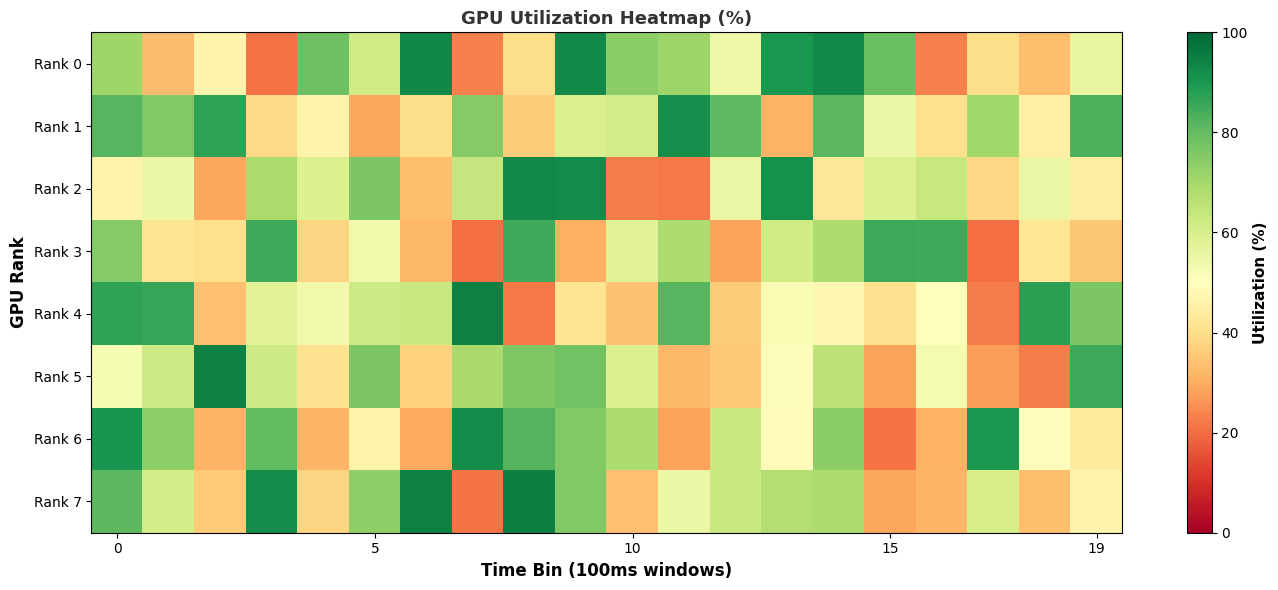
System & OS Runtime Recipes#
OS Runtime Summary
Summary of OS runtime operations including system calls and I/O operations.
Output Format: Summary table, operation distribution bar chart, and timing box plot.
OS Operation |
Call Count |
Total Time (us) |
Avg Time (us) |
Max Time (us) |
|---|---|---|---|---|
read() |
1850 |
28500.3 |
15.41 |
250.2 |
write() |
1620 |
24300.5 |
15.01 |
220.3 |
open() |
450 |
8500.2 |
18.89 |
120.5 |
close() |
425 |
7200.1 |
16.94 |
95.2 |
mmap() |
120 |
4200.8 |
35.01 |
180.3 |

Linux File Access Summary
Specialized analysis of file system access patterns during profiling.
Output Format: File access statistics table with I/O patterns.
File/Path |
Access Count |
Bytes Read |
Bytes Written |
Total Time (us) |
|---|---|---|---|---|
/data/model.bin |
250 |
2048000 |
0 |
18500.2 |
/tmp/cache |
1850 |
512000 |
256000 |
12300.5 |
/proc/stat |
450 |
0 |
0 |
2800.3 |
/dev/null |
600 |
0 |
1024000 |
8200.1 |
NVLink & MPI Recipes#
NVLink Network Throughput Summary
Summary of NVLink GPU-to-GPU communication throughput and efficiency.
Output Format: Summary table, throughput distribution bar chart, and timing box plot.
Link Pair |
Transfers |
Total Data (MB) |
Total Time (us) |
Throughput (GB/s) |
|---|---|---|---|---|
GPU0-GPU1 |
450 |
2048.5 |
2350.3 |
871.0 |
GPU1-GPU2 |
450 |
2048.3 |
2340.2 |
875.1 |
GPU2-GPU3 |
450 |
2048.1 |
2360.5 |
868.2 |
GPU4-GPU5 |
450 |
2048.2 |
2345.8 |
873.1 |
GPU6-GPU7 |
450 |
2048.0 |
2355.2 |
869.8 |

MPI Summary
Summary of Message Passing Interface (MPI) operations and communication patterns.
Output Format: Summary table, operation distribution bar chart, and timing box plot.
MPI Operation |
Call Count |
Total Data (MB) |
Total Time (us) |
Avg Time (us) |
|---|---|---|---|---|
MPI_Allreduce |
560 |
520.0 |
680450.3 |
1214.20 |
MPI_Reduce |
280 |
280.5 |
350200.2 |
1250.71 |
MPI_Bcast |
280 |
256.2 |
185300.5 |
661.79 |
MPI_Send |
1850 |
850.3 |
125400.2 |
67.81 |
MPI_Recv |
1850 |
850.3 |
128200.1 |
69.30 |

MPI and GPU Time Utilization Heatmap
Correlation heatmap showing GPU utilization during MPI operations across ranks.
Output Format: 2D heatmap with MPI ranks on the y-axis and time bins on the x-axis.
MPI Rank |
T0 (%) |
T1 (%) |
T2 (%) |
T3 (%) |
Avg (%) |
|---|---|---|---|---|---|
Rank 0 |
88 |
90 |
89 |
92 |
89.75 |
Rank 1 |
86 |
88 |
87 |
90 |
87.75 |
Rank 2 |
87 |
89 |
88 |
91 |
88.75 |
Rank 3 |
85 |
87 |
86 |
89 |
86.75 |
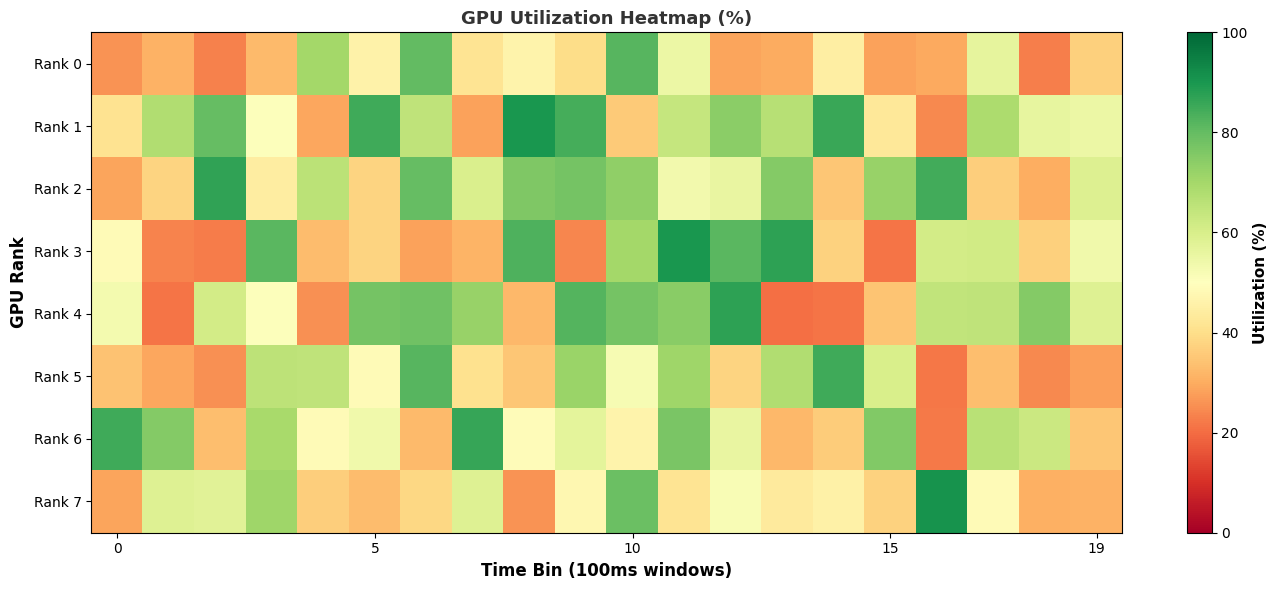
UCX and GPU Time Utilization Heatmap
Heatmap showing GPU utilization during UCX (Unified Communication X) operations.
Output Format: 2D heatmap with UCX operation types on the y-axis and time bins on the x-axis.
UCX Op Type |
T0 (%) |
T1 (%) |
T2 (%) |
T3 (%) |
Avg (%) |
|---|---|---|---|---|---|
UCX_Put |
82 |
84 |
83 |
86 |
83.75 |
UCX_Get |
79 |
81 |
80 |
83 |
80.75 |
UCX_Atomic |
75 |
77 |
76 |
79 |
76.75 |
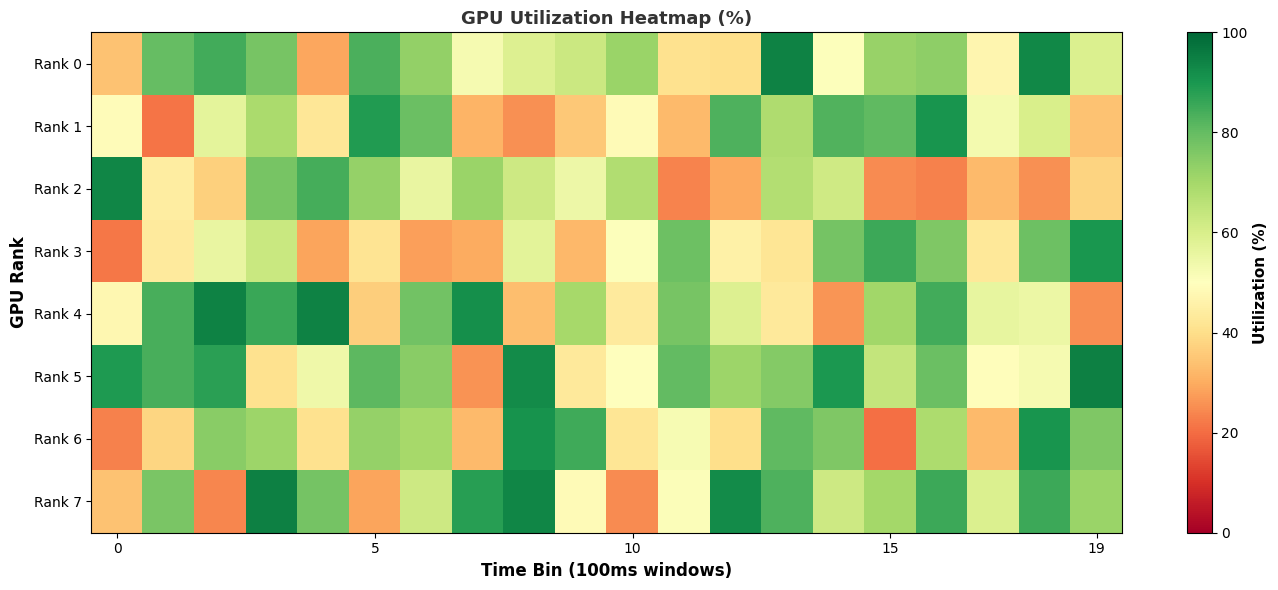
Comparison & Diff Recipes#
Statistics Diff
Side-by-side comparison of profiling statistics from two different runs.
Output Format: Comparison table with Run A versus Run B metrics and percentage differences.
Metric |
Run A |
Run B |
Difference |
Change % |
|---|---|---|---|---|
Total GPU Time (s) |
485.2 |
492.5 |
+7.3 |
+1.5% |
Avg Kernel Time (us) |
338.73 |
341.25 |
+2.52 |
+0.7% |
Memory Bandwidth (GB/s) |
750.2 |
745.8 |
-4.4 |
-0.6% |
NCCL Overhead (ms) |
125.3 |
128.5 |
+3.2 |
+2.6% |
Peak VRAM (MB) |
42048 |
42512 |
+464 |
+1.1% |
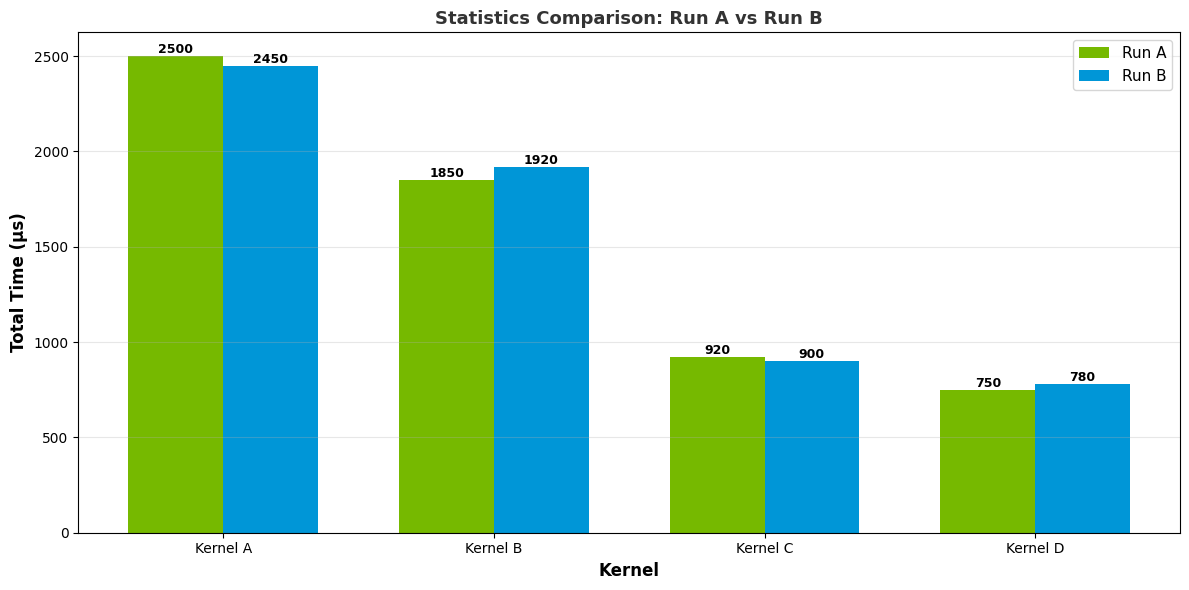
Recipe Composite Tables#
When writing a recipe, you use CompositeTable enum values to request
pre-processed DataFrames. These composite tables join, rename, and resolve
raw parquet export tables into analysis-ready DataFrames, so you don’t
have to do the merging and ID-to-string resolution yourself.
Available Composite Tables#
CompositeTable |
Description |
|---|---|
|
All GPU activities (kernels, memcpy, memset, mem_decompress) concatenated into one table. Columns are the union of the raw CUPTI activity columns. Use this when you want a broad view of everything the GPU did. |
|
Same as |
|
GPU activities + CPU runtime API calls, correlated by |
|
Runtime + kernels only (no memcpy/memset). Like |
|
Kernels only with |
|
NVTX ranges with |
|
NCCL communication operations parsed from NVTX events. Includes
|
|
NCCL API-level view showing call durations, parsed from NVTX events. |
|
NCCL GPU-level operations view parsed from NVTX events. |
|
Network interface metrics joined with device info. Columns include
|
|
InfiniBand switch port metrics with |
|
All MPI event tables (P2P, collectives, start/wait, other) concatenated
and sorted by start time. |
|
All UCX event tables (submit, progress, general) concatenated and sorted
by start time. |
|
GPU hardware metrics pivoted so each metric name becomes its own column
(e.g., |
|
CPU performance counter events enriched with |
|
Generic metric events with type and field IDs resolved to
|
Choosing the Right CUDA Table#
The CUDA-related composite tables can be confusing since there are five of them. Here is when to use each one:
Table |
Includes kernels |
Includes memcpy/memset |
Includes runtime API |
When to use |
|---|---|---|---|---|
|
Yes |
Yes |
No |
Overview of all GPU activity |
|
Yes |
Yes |
No |
Same, but with CUDA graph correlation |
|
Yes |
No |
No |
Kernel-only analysis with resolved names |
|
Yes |
Yes |
Yes |
Full CPU-to-GPU pipeline analysis |
|
Yes |
No |
Yes |
Kernel launch overhead analysis with resolved names |
Output Columns#
Each composite table produces a DataFrame with specific columns. The columns
depend on which raw tables were joined and what transformations were applied.
Also note: when tables are loaded through DataService, bit-field
decomposition may add derived columns such as pid, tid, and gpuId.
CUDA_GPU
correlationId start end globalPid deviceId contextId greenContextId streamId pid
CUDA_GPU_GRAPH
correlationId start end globalPid deviceId contextId greenContextId streamId graphNodeId graphId pid
graphNodeId appears on kernel/memcpy/memset rows, and graphId appears on
graph-trace rows.
CUDA_KERNEL
correlationId globalPid start end deviceId shortName mangledName demangledName pid
The *Name columns contain resolved strings (not integer IDs).
CUDA_COMBINED
start end globalTid name correlationId gpu_start gpu_end pid tid deviceId contextId greenContextId streamId
start/end are the CPU-side runtime API call times. gpu_start/gpu_end
are the GPU-side activity times. name is the resolved API function name
(e.g., "cudaLaunchKernel"). pid and tid are extracted from
globalTid by bit field decomposition (globalPid is dropped).
CUDA_COMBINED_KERNEL
start end globalTid correlationId gpu_start gpu_end pid tid deviceId shortName mangledName demangledName
Like CUDA_COMBINED but kernel-only, with resolved kernel names instead of
runtime API name. pid and tid are extracted from globalTid
(globalPid is dropped).
NVTX
text start end globalTid endGlobalTid domainId domainName eventType pid tid
text is the resolved NVTX annotation string. domainName is "Default"
if no domain was specified.
NCCL
text start end globalTid endGlobalTid domainId eventType jsonText pid tid
NCCL rows are filtered from NVTX to the domain named "NCCL" and keep NVTX
timing/thread columns. jsonText is present when advanced NCCL tracing payloads exist.
NCCL_API
text start end globalTid endGlobalTid domainId eventType jsonText count datatype rank pid tid
Extends NCCL with parsed API payload fields (count, datatype, rank).
NCCL_GPU_OPERATIONS
local_id (index) text start end commRank count datatype
One row per merged GPU operation (grouped from per-channel events). local_id is
the DataFrame index after grouping.
MPI / UCX
globalTid start end text pid tid
All sub-tables concatenated, sorted by start. text is the resolved
operation name (e.g., "MPI_Send", "MPI_Allreduce").
NIC
start end globalId nicId value metricsListId metricsIdx GUID nic_name metric_name
IB_SWITCH
start end GUID value metricsListId metricsIdx metric_name
GPU_METRICS
timestamp typeId gpuId SMs Active SM Issue Tensor Active Unallocated Warps in Active SMs ...
Each metric is a column. The available columns depend on the GPU and capture settings.
PERF_EVENTS
start end vmId eventId count componentType cpu name
GENERIC
timestamp typeId genericEventId metricName metricValue dataSrc gpuId
Examples in Existing Recipes#
These recipes demonstrate how composite tables are used in practice:
cuda_gpu_kern_sum: UsesCUDA_KERNELfor kernel summary statisticsnvtx_sum: UsesNVTXfor NVTX range analysisnvtx_gpu_proj_sum: UsesCUDA_GPU_GRAPH+NVTXfor GPU projectionnetwork_map_aws: UsesGENERICfor AWS EFA metrics
See also Tutorial: Create a User-Defined Recipe for a step-by-step tutorial on creating your own recipe.
Tutorial: Create a User-Defined Recipe#
The Nsight Systems recipe system is designed to be extensible and we hope that many users will use it to create their own recipes. This short tutorial will highlight the steps needed to create a recipe that is a customized version of one of the recipes that is included in the Nsight Systems recipe package.
Before starting, you may want to review Recipe Composite Tables for an overview of the pre-processed data tables available to recipes.
Step 1: Create the recipe directory and script
Make a new directory in the
<install-dir>/target-linux-x64/python/packages/nsys_recipe/recipes folder based on
the name of your new recipe. For this example, we will call our new recipe
new_metric_util_map. We will copy the existing gpu_metric_util_map.py script
and create a new script called
new_metric_util_map.py in the new_metric_util_map directory. We will also
copy the heatmap.ipynb and metadata json files into the new_metric_util_map
directory. Type these steps in a Linux terminal window:
> cd <install-dir>/target-linux-x64/python/packages/nsys_recipe
> mkdir new_metric_util_map
> cp gpu_metric_util_map/metadata.json new_metric_util_map/metadata.json
> cp gpu_metric_util_map/heatmap.ipynb new_metric_util_map/heatmap.ipynb
> cp gpu_metric_util_map/gpu_metric_util_map.py new_metric_util_map/new_metric_util_map.py
Replace the module name in metadata.json with new_metric_util_map
and update the display name and description to your preference. Also, rename
the class name GpuMetricUtilMap in new_metric_util_map.py to
NewMetricUtilMap. We will discuss the detailed functionality of the new
recipe code in the subsequent steps.
Step 2: Modify the mapper function
Many recipes are structured as a map-reduce algorithm. The mapper function is called for every .nsys-rep file in the report directory. The mapper function performs a series of calculations on the events in each Nsight Systems report and produces an intermediate data set. The intermediate results are then combined by the reduce function to produce the final results. The mapper function can be called in parallel, either on multiple cores of a single node (using the concurrent python module), or multiple ranks of a multi-node recipe analysis (using the Dask distributed module).
When we create a new recipe, we need to create a class that derives from the Recipe base class. For our example, that class will be called NewMetricUtilMap (which we had renamed in step 1).
The mapper function is called mapper_func(). It will first convert the .nsys-rep
file into a data storage file (SQLite/Parquet/Arrow), if the file does
not already exist. It then reads all the necessary tables from the exported file
into Pandas Dataframes needed by the recipe. GPU Metric data is stored using a
database schema table called GENERIC_EVENTS. For extra flexibility,
GENERIC_EVENTS represents the data as a JSON object, which is stored as a string.
The NewMetricUtilMap class extracts fields from the JSON object and accumulates
them over the histogram bins of the heat map.
The original script retrieved three GPU metrics: SM Active, SM Issue, and Tensor Active. In our new version of the script, we will extract a fourth metric, Unallocated Warps in Active SMs.
Find this line (approximately line 44):
metric_cols = ["SMs Active", "SM Issue", "Tensor Active"]
Add the Unallocated Warps in Active SMs metric:
metric_cols = [
    "SMs Active",
    "SM Issue",
    "Tensor Active",
    "Unallocated Warps in Active SMs",
]
Step 3: Modify the reduce function
Our new mapper function will extract four GPU metrics and return them as a Pandas DataFrame. The reduce function receives a list of DataFrames, one for each .nsys-rep file in the analysis, and combines them into a single DataFrame using the Pandas concat function. Since the reducer function is generic in our case, no modifications are needed. However, if you would like to add any additional post-processing, you can do so in this function.
Step 4: Add a plot to the Jupyter notebook
Our new recipe class will create a Parquet output file with all the data
produced by the reducer function, using the to_parquet() function. It will also
create a Jupyter notebook file using the create_notebook() function.
In this step, we will change the create_notebook() function to produce a plot
for our fourth metric. To do this, we need to change these two lines (located
in the second cell of new_metric_util_map/heatmap.ipynb):
metrics = [
   "SMs Active",
   "SM Issue",
   "Tensor Active",
]
To this:
metrics = [
    "SMs Active",
    "SM Issue",
    "Tensor Active",
    "Unallocated Warps in Active SMs",
]
That completes all the modifications for our NewMetricUtilMap class.
Step 5: Run the new recipe
If the new recipe is located in the default recipe directory nsys_recipe/recipes,
we can directly run it using the nsys recipe command like this:
> nsys recipe new_metric_util_map --input <directory of reports>
It is also possible to have a recipe located outside of this directory. In this
case, you need to set the environment variable NSYS_RECIPE_PATH to the directory
containing the recipe when running the nsys recipe command.
When successful, the recipe should produce a new recipe result directory called
new_metric_util_map-1.
If we open the Jupyter notebook in that recipe and execute the code, we should see our new heatmap along with the three plots produced by the original version of the recipe. Here is an example:
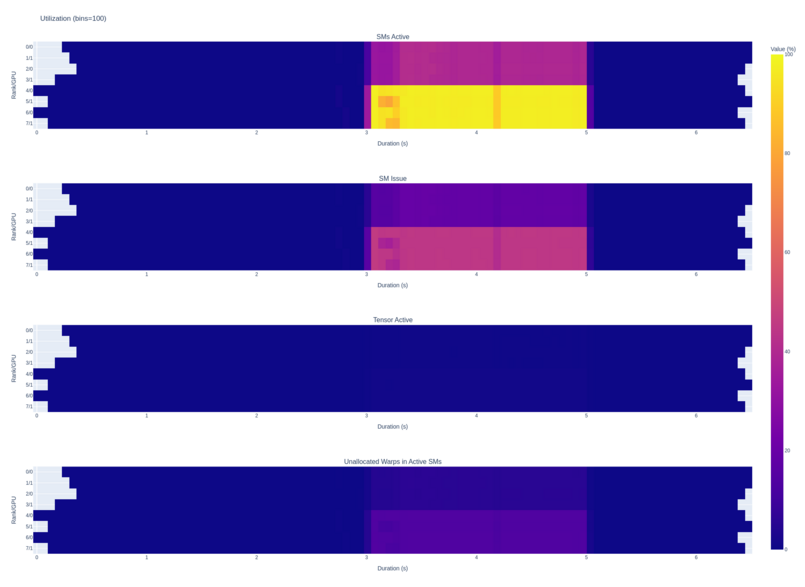
Available Export Formats#
You may want to create your own analysis system interrogating the data produced by Nsight Systems. However, the .nsys-rep output format of Nsight Systems is not designed to be accessed by users, and we cannot guarantee its stability. Therefore you will want to export into a good format for your further processing.
SQLite Schema Reference#
Nsight Systems has the ability to export SQLite database files from the .nsys-rep
results file. From the CLI, use nsys export. From the GUI, call
File->Export....
Note
The .nsys-rep report format is the only data format for Nsight Systems that should be considered forward-compatible. The SQLite schema can and will change in the future.
The schema for a concrete database can be obtained with the sqlite3 tool
built-in command .schema. The sqlite3 tool can be located in the Target or
Host directory of your Nsight Systems installation.
Note
Currently, tables are created lazily, and therefore not every table described in the documentation will be present in a particular database. This will change in a future version of the product. If you want a full schema of all possible tables, use nsys export --lazy=false during the export phase.
Currently, a table is created for each data type in the exported database. Since usage patterns for exported data may vary greatly and no default use cases have been established, no indexes or extra constraints are created. Instead, refer to the SQLite Examples section for a list of common recipes. This may change in a future version of the product.
To check the version of your exported SQLite file, check the value of
EXPORT_SCHEMA_VERSION in the META_DATA_EXPORT table. The schema version
is a common three-value major/minor/micro version number. The first value, or
major value, indicates the overall format of the database, and is only changed
if there is a major re-write or re-factor of the entire database format. It is
assumed that if the major version changes, all scripts or queries will break.
The middle, or minor, version is changed anytime there is a more localized, but
potentially breaking change, such as renaming an existing column, or changing
the type of an existing column. The last, or micro version is changed any time
there are additions, such as a new table or column, that should not introduce
any breaking change when used with well-written, best-practices queries.
The changes between schema versions are documented in
<install_dir>/host*/exporter/export_schema_version_notes.txt.
This is the schema as of the 2026.2 release, schema version 3.25.0.
CREATE TABLE StringIds (
-- Consolidation of repetitive string values.
id INTEGER NOT NULL PRIMARY KEY, -- ID reference value.
value TEXT NOT NULL -- String value.
);
CREATE TABLE ANALYSIS_FILE (
-- Analysis file content
id INTEGER NOT NULL PRIMARY KEY, -- ID reference value.
filename TEXT, -- File path
contentId INTEGER, -- REFERENCES StringIds(id) -- File content
globalPid INTEGER NOT NULL -- Serialized GlobalId.
);
CREATE TABLE ThreadNames (
nameId INTEGER NOT NULL, -- REFERENCES StringIds(id) -- Thread name
priority INTEGER, -- Priority of the thread.
globalTid INTEGER -- Serialized GlobalId.
);
CREATE TABLE ProcessStreams (
globalPid INTEGER NOT NULL, -- Serialized GlobalId.
filenameId INTEGER NOT NULL, -- REFERENCES StringIds(id) -- File name
contentId INTEGER NOT NULL -- REFERENCES StringIds(id) -- Stream content
);
CREATE TABLE TARGET_INFO_SYSTEM_ENV (
globalVid INTEGER, -- Serialized GlobalId.
devStateName TEXT NOT NULL, -- Device state name.
name TEXT NOT NULL, -- Property name.
nameEnum INTEGER NOT NULL, -- Property enum value.
value TEXT NOT NULL -- Property value.
);
CREATE TABLE TARGET_INFO_NIC_INFO (
GUID INTEGER NOT NULL, -- Network interface GUID
stateName TEXT NOT NULL, -- Device state name
nicId INTEGER NOT NULL, -- Network interface Id
name TEXT NOT NULL, -- Network interface name
deviceId INTEGER NOT NULL, -- REFERENCES ENUM_NET_DEVICE_ID(id)
vendorId INTEGER NOT NULL, -- REFERENCES ENUM_NET_VENDOR_ID(id)
linkLayer INTEGER NOT NULL -- REFERENCES ENUM_NET_LINK_TYPE(id)
);
CREATE TABLE NIC_ID_MAP (
-- Map between NIC info nicId and NIC metric globalId
nicId INTEGER NOT NULL, -- REFERENCES TARGET_INFO_NIC_INFO(nicId)
globalId INTEGER NOT NULL -- REFERENCES NET_NIC_METRIC(globalId)
);
CREATE TABLE TARGET_INFO_SESSION_START_TIME (
utcEpochNs INTEGER, -- UTC Epoch timestamp at start of the capture (ns).
utcTime TEXT, -- Start of the capture in UTC.
localTime TEXT, -- Start of the capture in local time of target.
systemClockNs INTEGER -- Target system clock timestamp at start of the capture (ns).
);
CREATE TABLE ANALYSIS_DETAILS (
-- Details about the analysis session.
globalVid INTEGER NOT NULL, -- Serialized GlobalId.
duration INTEGER NOT NULL, -- The total time span of the entire trace (ns).
startTime INTEGER NOT NULL, -- Trace start timestamp in nanoseconds.
stopTime INTEGER NOT NULL -- Trace stop timestamp in nanoseconds.
);
CREATE TABLE PMU_EVENT_REQUESTS (
-- PMU event requests
id INTEGER NOT NULL, -- PMU event request.
eventid INTEGER, -- PMU counter event id.
source INTEGER NOT NULL, -- REFERENCES ENUM_PMU_EVENT_SOURCE(id)
unit_type INTEGER NOT NULL, -- REFERENCES ENUM_PMU_UNIT_TYPE(id)
event_name TEXT, -- PMU counter unique name
PRIMARY KEY (id)
);
CREATE TABLE TARGET_INFO_GPU (
vmId INTEGER NOT NULL, -- Serialized GlobalId.
id INTEGER NOT NULL, -- Device ID.
name TEXT, -- Device name.
busLocation TEXT, -- PCI bus location.
isDiscrete INTEGER, -- True if discrete, false if integrated.
l2CacheSize INTEGER, -- Size of L2 cache (B).
totalMemory INTEGER, -- Total amount of memory on the device (B).
memoryBandwidth INTEGER, -- Amount of memory transferred (B).
clockRate INTEGER, -- Clock frequency (Hz).
smCount INTEGER, -- Number of multiprocessors on the device.
pwGpuId INTEGER, -- PerfWorks GPU ID.
uuid TEXT, -- Device UUID.
luid INTEGER, -- Device LUID.
chipName TEXT, -- Chip name.
cuDevice INTEGER, -- CUDA device ID.
ctxswDevPath TEXT, -- GPU context switch device node path.
ctrlDevPath TEXT, -- GPU control device node path.
revision INTEGER, -- Revision number.
nodeMask INTEGER, -- Device node mask.
constantMemory INTEGER, -- Memory available on device for __constant__ variables (B).
maxIPC INTEGER, -- Maximum instructions per count.
maxRegistersPerBlock INTEGER, -- Maximum number of 32-bit registers available per block.
maxShmemPerBlock INTEGER, -- Maximum optin shared memory per block.
maxShmemPerBlockOptin INTEGER, -- Maximum optin shared memory per block.
maxShmemPerSm INTEGER, -- Maximum shared memory available per multiprocessor (B).
maxRegistersPerSm INTEGER, -- Maximum number of 32-bit registers available per multiprocessor.
threadsPerWarp INTEGER, -- Warp size in threads.
asyncEngines INTEGER, -- Number of asynchronous engines.
maxWarpsPerSm INTEGER, -- Maximum number of warps per multiprocessor.
maxBlocksPerSm INTEGER, -- Maximum number of blocks per multiprocessor.
maxThreadsPerBlock INTEGER, -- Maximum number of threads per block.
maxBlockDimX INTEGER, -- Maximum X-dimension of a block.
maxBlockDimY INTEGER, -- Maximum Y-dimension of a block.
maxBlockDimZ INTEGER, -- Maximum Z-dimension of a block.
maxGridDimX INTEGER, -- Maximum X-dimension of a grid.
maxGridDimY INTEGER, -- Maximum Y-dimension of a grid.
maxGridDimZ INTEGER, -- Maximum Z-dimension of a grid.
computeMajor INTEGER, -- Major compute capability version number.
computeMinor INTEGER, -- Minor compute capability version number.
smMajor INTEGER, -- Major multiprocessor version number.
smMinor INTEGER -- Minor multiprocessor version number.
);
CREATE TABLE TARGET_INFO_XMC_SPEC (
vmId INTEGER NOT NULL, -- Serialized GlobalId.
clientId INTEGER NOT NULL, -- Client ID.
type TEXT NOT NULL, -- Client type.
name TEXT NOT NULL, -- Client name.
groupId TEXT NOT NULL -- Client group ID.
);
CREATE TABLE TARGET_INFO_CUDA_DEVICE (
gpuId INTEGER, -- GPU ID.
cudaId INTEGER NOT NULL, -- CUDA device ID.
pid INTEGER NOT NULL, -- Process ID.
uuid TEXT, -- Device UUID.
numMultiprocessors INTEGER -- Number of SMs available on the device.
);
CREATE TABLE TARGET_INFO_PROCESS (
processId INTEGER NOT NULL, -- Process ID.
openGlVersion TEXT NOT NULL, -- OpenGL version.
correlationId INTEGER NOT NULL, -- Correlation ID of the kernel.
nameId INTEGER NOT NULL -- REFERENCES StringIds(id) -- Function name
);
CREATE TABLE TARGET_INFO_NVTX_CUDA_DEVICE (
name TEXT NOT NULL, -- CUDA device name assigned using NVTX.
hwId INTEGER NOT NULL, -- Hardware ID.
vmId INTEGER NOT NULL, -- VM ID.
deviceId INTEGER NOT NULL -- Device ID.
);
CREATE TABLE TARGET_INFO_NVTX_CUDA_CONTEXT (
name TEXT NOT NULL, -- CUDA context name assigned using NVTX.
hwId INTEGER NOT NULL, -- Hardware ID.
vmId INTEGER NOT NULL, -- VM ID.
processId INTEGER NOT NULL, -- Process ID.
deviceId INTEGER NOT NULL, -- Device ID.
contextId INTEGER NOT NULL -- Context ID.
);
CREATE TABLE TARGET_INFO_NVTX_CUDA_STREAM (
name TEXT NOT NULL, -- CUDA stream name assigned using NVTX.
hwId INTEGER NOT NULL, -- Hardware ID.
vmId INTEGER NOT NULL, -- VM ID.
processId INTEGER NOT NULL, -- Process ID.
deviceId INTEGER NOT NULL, -- Device ID.
contextId INTEGER NOT NULL, -- Context ID.
streamId INTEGER NOT NULL -- Stream ID.
);
CREATE TABLE TARGET_INFO_CUDA_CONTEXT_INFO (
nullStreamId INTEGER NOT NULL, -- Stream ID.
hwId INTEGER NOT NULL, -- Hardware ID.
vmId INTEGER NOT NULL, -- VM ID.
processId INTEGER NOT NULL, -- Process ID.
deviceId INTEGER NOT NULL, -- Device ID.
contextId INTEGER NOT NULL, -- Context ID.
parentContextId INTEGER, -- For green context, this is the parent context id.
isGreenContext INTEGER, -- Is this a Green Context?
numMultiprocessors INTEGER, -- For green context, number of SMs allocated.
numTpcs INTEGER, -- For green context, number of TPCs allocated.
tpcMask TEXT, -- For green context, comma-separated hex TPC mask values (e.g., '0xf,0x0').
workqueueResourceId INTEGER, -- For green context, workqueue resource ID.
workqueueConcurrencyLimit INTEGER, -- For green context, workqueue concurrency limit.
workqueueSharingScope INTEGER -- For green context, workqueue sharing scope.
);
CREATE TABLE TARGET_INFO_CUDA_STREAM (
streamId INTEGER NOT NULL, -- Stream ID.
hwId INTEGER NOT NULL, -- Hardware ID.
vmId INTEGER NOT NULL, -- VM ID.
processId INTEGER NOT NULL, -- Process ID.
contextId INTEGER NOT NULL, -- Context ID.
priority INTEGER NOT NULL, -- Priority of the stream.
flag INTEGER NOT NULL -- REFERENCES ENUM_CUPTI_STREAM_TYPE(id)
);
CREATE TABLE TARGET_INFO_WDDM_CONTEXTS (
context INTEGER NOT NULL,
engineType INTEGER NOT NULL,
nodeOrdinal INTEGER NOT NULL,
friendlyName TEXT NOT NULL
);
CREATE TABLE TARGET_INFO_PERF_METRIC (
id INTEGER NOT NULL, -- Event or Metric ID value
name TEXT NOT NULL, -- Event or Metric name
description TEXT NOT NULL, -- Event or Metric description
unit TEXT NOT NULL, -- Event or Metric measurement unit
displayName TEXT -- GUI friendly name of the Event or Metric
);
CREATE TABLE TARGET_INFO_NETWORK_METRICS (
metricsListId INTEGER NOT NULL, -- Metric list ID
metricsIdx INTEGER NOT NULL, -- List index of metric
name TEXT NOT NULL, -- Name of metric
description TEXT NOT NULL, -- Description of metric
unit TEXT NOT NULL -- Measurement unit of metric
);
CREATE TABLE TARGET_INFO_COMPONENT (
componentId INTEGER NOT NULL, -- Component ID
name TEXT NOT NULL, -- Component name
instance INTEGER, -- Component instance
parentId INTEGER -- Parent Component ID
);
CREATE TABLE NET_IB_DEVICE_INFO (
networkId INTEGER NOT NULL, -- The Device's Network ID
guid INTEGER, -- Device Guid
name TEXT, -- Device Name
des TEXT, -- Device description
lid INTEGER -- Device Lid
);
CREATE TABLE NET_IB_DEVICE_PORT_INFO (
guid INTEGER, -- REFERENCES NET_IB_DEVICE_INFO(guid) -- Device Global Identifier
portNumber INTEGER NOT NULL, -- Internal Port Number
portLabel TEXT NOT NULL, -- Port Label
portLid INTEGER NOT NULL -- Port Lid
);
CREATE TABLE NET_IB_DEVICE_TYPE_MAP (
guid INTEGER, -- REFERENCES NET_IB_DEVICE_INFO(guid) -- Device Global Identifier
deviceType INTEGER NOT NULL -- REFERENCES ENUM_NET_IB_DEVICE_TYPE(id)
);
CREATE TABLE META_DATA_CAPTURE (
-- information about nsys capture parameters
name TEXT NOT NULL, -- Name of meta-data record
value TEXT -- Value of meta-data record
);
CREATE TABLE META_DATA_EXPORT (
-- information about nsys export process
name TEXT NOT NULL, -- Name of meta-data record
value TEXT -- Value of meta-data record
);
CREATE TABLE ENUM_NSYS_EVENT_TYPE (
-- Nsys event type labels
id INTEGER NOT NULL PRIMARY KEY, -- Enum numerical value.
name TEXT, -- Enum symbol name.
label TEXT -- Enum human name.
);
CREATE TABLE ENUM_NSYS_EVENT_CLASS (
-- Nsys event class labels
id INTEGER NOT NULL PRIMARY KEY, -- Enum numerical value.
name TEXT, -- Enum symbol name.
label TEXT -- Enum human name.
);
CREATE TABLE ENUM_NSYS_GENERIC_EVENT_SOURCE (
-- Nsys generic event source labels
id INTEGER NOT NULL PRIMARY KEY, -- Enum numerical value.
name TEXT, -- Enum symbol name.
label TEXT -- Enum human name.
);
CREATE TABLE ENUM_NSYS_GENERIC_EVENT_GROUP (
-- Nsys generic event group labels
id INTEGER NOT NULL PRIMARY KEY, -- Enum numerical value.
name TEXT, -- Enum symbol name.
label TEXT -- Enum human name.
);
CREATE TABLE ENUM_NSYS_GENERIC_EVENT_FIELD_TYPE (
-- Nsys generic event field type labels
id INTEGER NOT NULL PRIMARY KEY, -- Enum numerical value.
name TEXT, -- Enum symbol name.
label TEXT -- Enum human name.
);
CREATE TABLE ENUM_NSYS_GENERIC_EVENT_FIELD_ETW_PROPERTY (
-- Nsys generic event field ETW property flag labels
id INTEGER NOT NULL PRIMARY KEY, -- Enum numerical value.
name TEXT, -- Enum symbol name.
label TEXT -- Enum human name.
);
CREATE TABLE ENUM_NSYS_GENERIC_EVENT_FIELD_ETW_TYPE (
-- Nsys generic event field ETW type labels
id INTEGER NOT NULL PRIMARY KEY, -- Enum numerical value.
name TEXT, -- Enum symbol name.
label TEXT -- Enum human name.
);
CREATE TABLE ENUM_NSYS_GENERIC_EVENT_FIELD_ETW_FLAGS (
-- Nsys generic event field ETW map info flag labels
id INTEGER NOT NULL PRIMARY KEY, -- Enum numerical value.
name TEXT, -- Enum symbol name.
label TEXT -- Enum human name.
);
CREATE TABLE ENUM_GPU_CTX_SWITCH (
-- GPU context switch labels
id INTEGER NOT NULL PRIMARY KEY, -- Enum numerical value.
name TEXT, -- Enum symbol name.
label TEXT -- Enum human name.
);
CREATE TABLE ENUM_CUDA_MEMCPY_OPER (
-- CUDA memcpy operation labels
id INTEGER NOT NULL PRIMARY KEY, -- Enum numerical value.
name TEXT, -- Enum symbol name.
label TEXT -- Enum human name.
);
CREATE TABLE ENUM_CUDA_MEM_KIND (
-- CUDA memory kind labels
id INTEGER NOT NULL PRIMARY KEY, -- Enum numerical value.
name TEXT, -- Enum symbol name.
label TEXT -- Enum human name.
);
CREATE TABLE ENUM_CUDA_MEMPOOL_TYPE (
-- CUDA mempool type labels
id INTEGER NOT NULL PRIMARY KEY, -- Enum numerical value.
name TEXT, -- Enum symbol name.
label TEXT -- Enum human name.
);
CREATE TABLE ENUM_CUDA_MEMPOOL_OPER (
-- CUDA mempool operation labels
id INTEGER NOT NULL PRIMARY KEY, -- Enum numerical value.
name TEXT, -- Enum symbol name.
label TEXT -- Enum human name.
);
CREATE TABLE ENUM_CUDA_DEV_MEM_EVENT_OPER (
-- CUDA device mem event operation labels
id INTEGER NOT NULL PRIMARY KEY, -- Enum numerical value.
name TEXT, -- Enum symbol name.
label TEXT -- Enum human name.
);
CREATE TABLE ENUM_CUDA_KERNEL_LAUNCH_TYPE (
-- CUDA kernel launch type labels
id INTEGER NOT NULL PRIMARY KEY, -- Enum numerical value.
name TEXT, -- Enum symbol name.
label TEXT -- Enum human name.
);
CREATE TABLE ENUM_CUDA_SHARED_MEM_LIMIT_CONFIG (
-- CUDA shared memory limit config labels
id INTEGER NOT NULL PRIMARY KEY, -- Enum numerical value.
name TEXT, -- Enum symbol name.
label TEXT -- Enum human name.
);
CREATE TABLE ENUM_CUDA_UNIF_MEM_MIGRATION (
-- CUDA unified memory migration cause labels
id INTEGER NOT NULL PRIMARY KEY, -- Enum numerical value.
name TEXT, -- Enum symbol name.
label TEXT -- Enum human name.
);
CREATE TABLE ENUM_CUDA_UNIF_MEM_ACCESS_TYPE (
-- CUDA unified memory access type labels
id INTEGER NOT NULL PRIMARY KEY, -- Enum numerical value.
name TEXT, -- Enum symbol name.
label TEXT -- Enum human name.
);
CREATE TABLE ENUM_CUDA_FUNC_CACHE_CONFIG (
-- CUDA function cache config labels
id INTEGER NOT NULL PRIMARY KEY, -- Enum numerical value.
name TEXT, -- Enum symbol name.
label TEXT -- Enum human name.
);
CREATE TABLE ENUM_CUPTI_STREAM_TYPE (
-- CUPTI stream type labels
id INTEGER NOT NULL PRIMARY KEY, -- Enum numerical value.
name TEXT, -- Enum symbol name.
label TEXT -- Enum human name.
);
CREATE TABLE ENUM_CUPTI_SYNC_TYPE (
-- CUPTI synchronization type labels
id INTEGER NOT NULL PRIMARY KEY, -- Enum numerical value.
name TEXT, -- Enum symbol name.
label TEXT -- Enum human name.
);
CREATE TABLE ENUM_CUPTI_OVERHEAD_TYPE (
-- CUPTI overhead type labels
id INTEGER NOT NULL PRIMARY KEY, -- Enum numerical value.
name TEXT, -- Enum symbol name.
label TEXT -- Enum human name.
);
CREATE TABLE ENUM_STACK_UNWIND_METHOD (
-- Stack unwind method labels
id INTEGER NOT NULL PRIMARY KEY, -- Enum numerical value.
name TEXT, -- Enum symbol name.
label TEXT -- Enum human name.
);
CREATE TABLE ENUM_SAMPLING_THREAD_STATE (
-- Sampling thread state labels
id INTEGER NOT NULL PRIMARY KEY, -- Enum numerical value.
name TEXT, -- Enum symbol name.
label TEXT -- Enum human name.
);
CREATE TABLE ENUM_SCHEDULING_THREAD_BLOCK (
-- Scheduling thread block labels
id INTEGER NOT NULL PRIMARY KEY, -- Enum numerical value.
name TEXT, -- Enum symbol name.
label TEXT -- Enum human name.
);
CREATE TABLE ENUM_OPENGL_DEBUG_SOURCE (
-- OpenGL debug source labels
id INTEGER NOT NULL PRIMARY KEY, -- Enum numerical value.
name TEXT, -- Enum symbol name.
label TEXT -- Enum human name.
);
CREATE TABLE ENUM_OPENGL_DEBUG_TYPE (
-- OpenGL debug type labels
id INTEGER NOT NULL PRIMARY KEY, -- Enum numerical value.
name TEXT, -- Enum symbol name.
label TEXT -- Enum human name.
);
CREATE TABLE ENUM_OPENGL_DEBUG_SEVERITY (
-- OpenGL debug severity labels
id INTEGER NOT NULL PRIMARY KEY, -- Enum numerical value.
name TEXT, -- Enum symbol name.
label TEXT -- Enum human name.
);
CREATE TABLE ENUM_VULKAN_PIPELINE_CREATION_FLAGS (
-- Vulkan pipeline creation feedback flag labels
id INTEGER NOT NULL PRIMARY KEY, -- Enum numerical value.
name TEXT, -- Enum symbol name.
label TEXT -- Enum human name.
);
CREATE TABLE ENUM_VULKAN_HEAP_TYPE (
-- Vulkan heap type labels
id INTEGER NOT NULL PRIMARY KEY, -- Enum numerical value.
name TEXT, -- Enum symbol name.
label TEXT -- Enum human name.
);
CREATE TABLE ENUM_VULKAN_HEAP_FLAGS (
-- Vulkan heap flag labels
id INTEGER NOT NULL PRIMARY KEY, -- Enum numerical value.
name TEXT, -- Enum symbol name.
label TEXT -- Enum human name.
);
CREATE TABLE ENUM_VULKAN_MEMORY_PROPERTY_FLAGS (
-- Vulkan memory property flag labels
id INTEGER NOT NULL PRIMARY KEY, -- Enum numerical value.
name TEXT, -- Enum symbol name.
label TEXT -- Enum human name.
);
CREATE TABLE ENUM_D3D12_HEAP_TYPE (
-- D3D12 heap type labels
id INTEGER NOT NULL PRIMARY KEY, -- Enum numerical value.
name TEXT, -- Enum symbol name.
label TEXT -- Enum human name.
);
CREATE TABLE ENUM_D3D12_PAGE_PROPERTY (
-- D3D12 CPU page property labels
id INTEGER NOT NULL PRIMARY KEY, -- Enum numerical value.
name TEXT, -- Enum symbol name.
label TEXT -- Enum human name.
);
CREATE TABLE ENUM_D3D12_HEAP_FLAGS (
-- D3D12 heap flag labels
id INTEGER NOT NULL PRIMARY KEY, -- Enum numerical value.
name TEXT, -- Enum symbol name.
label TEXT -- Enum human name.
);
CREATE TABLE ENUM_D3D12_CMD_LIST_TYPE (
-- D3D12 command list type labels
id INTEGER NOT NULL PRIMARY KEY, -- Enum numerical value.
name TEXT, -- Enum symbol name.
label TEXT -- Enum human name.
);
CREATE TABLE ENUM_OPENACC_DEVICE (
-- OpenACC device type labels
id INTEGER NOT NULL PRIMARY KEY, -- Enum numerical value.
name TEXT, -- Enum symbol name.
label TEXT -- Enum human name.
);
CREATE TABLE ENUM_OPENACC_EVENT_KIND (
-- OpenACC event type labels
id INTEGER NOT NULL PRIMARY KEY, -- Enum numerical value.
name TEXT, -- Enum symbol name.
label TEXT -- Enum human name.
);
CREATE TABLE ENUM_OPENMP_EVENT_KIND (
-- OpenMP event kind labels
id INTEGER NOT NULL PRIMARY KEY, -- Enum numerical value.
name TEXT, -- Enum symbol name.
label TEXT -- Enum human name.
);
CREATE TABLE ENUM_OPENMP_THREAD (
-- OpenMP thread labels
id INTEGER NOT NULL PRIMARY KEY, -- Enum numerical value.
name TEXT, -- Enum symbol name.
label TEXT -- Enum human name.
);
CREATE TABLE ENUM_OPENMP_DISPATCH (
-- OpenMP dispatch labels
id INTEGER NOT NULL PRIMARY KEY, -- Enum numerical value.
name TEXT, -- Enum symbol name.
label TEXT -- Enum human name.
);
CREATE TABLE ENUM_OPENMP_SYNC_REGION (
-- OpenMP sync region labels
id INTEGER NOT NULL PRIMARY KEY, -- Enum numerical value.
name TEXT, -- Enum symbol name.
label TEXT -- Enum human name.
);
CREATE TABLE ENUM_OPENMP_WORK (
-- OpenMP work labels
id INTEGER NOT NULL PRIMARY KEY, -- Enum numerical value.
name TEXT, -- Enum symbol name.
label TEXT -- Enum human name.
);
CREATE TABLE ENUM_OPENMP_MUTEX (
-- OpenMP mutex labels
id INTEGER NOT NULL PRIMARY KEY, -- Enum numerical value.
name TEXT, -- Enum symbol name.
label TEXT -- Enum human name.
);
CREATE TABLE ENUM_OPENMP_TASK_FLAG (
-- OpenMP task flags labels
id INTEGER NOT NULL PRIMARY KEY, -- Enum numerical value.
name TEXT, -- Enum symbol name.
label TEXT -- Enum human name.
);
CREATE TABLE ENUM_OPENMP_TASK_STATUS (
-- OpenMP task status labels
id INTEGER NOT NULL PRIMARY KEY, -- Enum numerical value.
name TEXT, -- Enum symbol name.
label TEXT -- Enum human name.
);
CREATE TABLE ENUM_NVDRIVER_EVENT_ID (
-- NV-Driver event it labels
id INTEGER NOT NULL PRIMARY KEY, -- Enum numerical value.
name TEXT, -- Enum symbol name.
label TEXT -- Enum human name.
);
CREATE TABLE ENUM_WDDM_PAGING_QUEUE_TYPE (
-- WDDM paging queue type labels
id INTEGER NOT NULL PRIMARY KEY, -- Enum numerical value.
name TEXT, -- Enum symbol name.
label TEXT -- Enum human name.
);
CREATE TABLE ENUM_WDDM_PACKET_TYPE (
-- WDDM packet type labels
id INTEGER NOT NULL PRIMARY KEY, -- Enum numerical value.
name TEXT, -- Enum symbol name.
label TEXT -- Enum human name.
);
CREATE TABLE ENUM_WDDM_ENGINE_TYPE (
-- WDDM engine type labels
id INTEGER NOT NULL PRIMARY KEY, -- Enum numerical value.
name TEXT, -- Enum symbol name.
label TEXT -- Enum human name.
);
CREATE TABLE ENUM_WDDM_INTERRUPT_TYPE (
-- WDDM DMA interrupt type labels
id INTEGER NOT NULL PRIMARY KEY, -- Enum numerical value.
name TEXT, -- Enum symbol name.
label TEXT -- Enum human name.
);
CREATE TABLE ENUM_WDDM_VIDMM_OP_TYPE (
-- WDDM VidMm operation type labels
id INTEGER NOT NULL PRIMARY KEY, -- Enum numerical value.
name TEXT, -- Enum symbol name.
label TEXT -- Enum human name.
);
CREATE TABLE ENUM_NET_LINK_TYPE (
-- NIC link layer labels
id INTEGER NOT NULL PRIMARY KEY, -- Enum numerical value.
name TEXT, -- Enum symbol name.
label TEXT -- Enum human name.
);
CREATE TABLE ENUM_NET_DEVICE_ID (
-- NIC PCIe device id labels
id INTEGER NOT NULL PRIMARY KEY, -- Enum numerical value.
name TEXT, -- Enum symbol name.
label TEXT -- Enum human name.
);
CREATE TABLE ENUM_NET_VENDOR_ID (
-- NIC PCIe vendor id labels
id INTEGER NOT NULL PRIMARY KEY, -- Enum numerical value.
name TEXT, -- Enum symbol name.
label TEXT -- Enum human name.
);
CREATE TABLE ENUM_ETW_MEMORY_TRANSFER_TYPE (
-- memory transfer type labels
id INTEGER NOT NULL PRIMARY KEY, -- Enum numerical value.
name TEXT, -- Enum symbol name.
label TEXT -- Enum human name.
);
CREATE TABLE ENUM_PMU_EVENT_SOURCE (
-- PMU event source labels
id INTEGER NOT NULL PRIMARY KEY, -- Enum numerical value.
name TEXT, -- Enum symbol name.
label TEXT -- Enum human name.
);
CREATE TABLE ENUM_PMU_UNIT_TYPE (
-- PMU unit type labels
id INTEGER NOT NULL PRIMARY KEY, -- Enum numerical value.
name TEXT, -- Enum symbol name.
label TEXT -- Enum human name.
);
CREATE TABLE ENUM_VIDEO_ENGINE_TYPE (
-- Video engine type id labels
id INTEGER NOT NULL PRIMARY KEY, -- Enum numerical value.
name TEXT, -- Enum symbol name.
label TEXT -- Enum human name.
);
CREATE TABLE ENUM_VIDEO_ENGINE_CODEC (
-- Video engine codec labels
id INTEGER NOT NULL PRIMARY KEY, -- Enum numerical value.
name TEXT, -- Enum symbol name.
label TEXT -- Enum human name.
);
CREATE TABLE ENUM_DIAGNOSTIC_SEVERITY_LEVEL (
-- Diagnostic message severity level labels
id INTEGER NOT NULL PRIMARY KEY, -- Enum numerical value.
name TEXT, -- Enum symbol name.
label TEXT -- Enum human name.
);
CREATE TABLE ENUM_DIAGNOSTIC_SOURCE_TYPE (
-- Diagnostic message source type labels
id INTEGER NOT NULL PRIMARY KEY, -- Enum numerical value.
name TEXT, -- Enum symbol name.
label TEXT -- Enum human name.
);
CREATE TABLE ENUM_DIAGNOSTIC_TIMESTAMP_SOURCE (
-- Diagnostic message timestamp source lables
id INTEGER NOT NULL PRIMARY KEY, -- Enum numerical value.
name TEXT, -- Enum symbol name.
label TEXT -- Enum human name.
);
CREATE TABLE ENUM_NET_IB_DEVICE_TYPE (
-- network device types
id INTEGER NOT NULL PRIMARY KEY, -- Enum numerical value.
name TEXT, -- Enum symbol name.
label TEXT -- Enum human name.
);
CREATE TABLE ENUM_NET_IB_CONGESTION_EVENT_TYPE (
-- IB Switch congestion event types
id INTEGER NOT NULL PRIMARY KEY, -- Enum numerical value.
name TEXT, -- Enum symbol name.
label TEXT -- Enum human name.
);
CREATE TABLE ENUM_OSRT_FILE_ACCESS_EVENT_TYPE (
-- OSRT File Access event type
id INTEGER NOT NULL PRIMARY KEY, -- Enum numerical value.
name TEXT, -- Enum symbol name.
label TEXT -- Enum human name.
);
CREATE TABLE GENERIC_EVENT_SOURCES (
-- Generic event source modules
sourceId INTEGER NOT NULL PRIMARY KEY, -- Serialized GlobalId.
nameId INTEGER NOT NULL, -- REFERENCES StringIds(id) -- Event source name
timeSourceId INTEGER NOT NULL, -- REFERENCES ENUM_NSYS_GENERIC_EVENT_SOURCE(id)
sourceGroupId INTEGER NOT NULL, -- REFERENCES ENUM_NSYS_GENERIC_EVENT_GROUP(id)
hyperType TEXT, -- Hypervisor Type
hyperVersion TEXT, -- Hypervisor Version
hyperStructPrefix TEXT, -- Hypervisor Struct Prefix
hyperMacroPrefix TEXT, -- Hypervisor Macro Prefix
hyperFilterFlags INTEGER, -- Hypervisor Custom Filter Flags
hyperDomain TEXT, -- Hypervisor Domain
data TEXT -- JSON encoded generic event source description.
);
CREATE TABLE GENERIC_EVENT_TYPES (
-- Generic event type/schema descriptions.
typeId INTEGER NOT NULL PRIMARY KEY, -- Serialized GlobalId.
sourceId INTEGER NOT NULL, -- REFERENCES GENERIC_EVENT_SOURCES(sourceId)
nameId INTEGER NOT NULL, -- REFERENCES StringIds(id) -- Event type name
hyperComment TEXT, -- Event Type Hypervisor Comment
ftraceFormat TEXT, -- Event Type FTrace Format
etwProviderId INTEGER, -- Event Type ETW Provider Id
etwProviderNameId INTEGER, -- Event Type ETW Provider Name Id
etwTaskId INTEGER, -- Event Type ETW Task Id
etwTaskNameId INTEGER, -- Event Type ETW Task Name Id
etwEventId INTEGER, -- Event Type ETW Event Id
etwVersion INTEGER, -- Event Type ETW Version
etwGuidHigh INTEGER, -- Event Type ETW GUID high
etwGuidLow INTEGER, -- Event Type ETW GUID low
etwGuid TEXT, -- ETW Provider GUID.
data TEXT -- JSON encoded generic event type description.
);
CREATE TABLE GENERIC_EVENT_TYPE_FIELDS (
-- Generic event type/schema individual data field descriptions.
typeId INTEGER NOT NULL, -- Serialized GlobalId.
fieldIdx INTEGER NOT NULL, -- Index of type field
fieldNameId INTEGER NOT NULL, -- Name of field.
offset INTEGER NOT NULL, -- Field alignment offset size, in bytes.
size INTEGER NOT NULL, -- Field size, in bytes.
type INTEGER NOT NULL, -- REFERENCES ENUM_NSYS_GENERIC_EVENT_FIELD_TYPE(id)
hyperTypeName TEXT, -- Event Field Hypervisor Type Name
hyperFormat TEXT, -- Event Field Hypervisor Format
hyperComment TEXT, -- Event Field Hypervisor Comment
ftracePrefix TEXT, -- Event Field FTrace Prefix
ftraceSuffix TEXT, -- Event Field FTrace Suffix
etwFlags INTEGER, -- REFERENCES ENUM_NSYS_GENERIC_EVENT_FIELD_ETW_PROPERTY(id)
etwCountFieldIndex INTEGER, -- Event Field ETW Count Field Index
etwLengthFieldIndex INTEGER, -- Event Field ETW Length Field Index
etwType INTEGER, -- REFERENCES ENUM_NSYS_GENERIC_EVENT_FIELD_ETW_TYPE(id)
etwMapInfoFlags INTEGER, -- REFERENCES ENUM_NSYS_GENERIC_EVENT_FIELD_ETW_FLAGS(id)
etwOrderedFieldIndex INTEGER -- Event Field ETW Ordered Field Index
);
CREATE TABLE GENERIC_EVENT_TYPE_FIELD_MAP (
-- Generic event ENUM data. Mostly used by ETW.
typeId INTEGER NOT NULL, -- Serialized GlobalId.
fieldIdx INTEGER NOT NULL, -- Index of type field
enum INTEGER NOT NULL, -- Event Field ETW Map Info enum.
name TEXT NOT NULL, -- Event Field ETW Map Info Name.
nameId INTEGER NOT NULL -- Event Field ETW Map Info Name Id.
);
CREATE TABLE GENERIC_EVENTS (
-- Dynamic or unstructured event data.
genericEventId INTEGER NOT NULL PRIMARY KEY, -- Id of particular generic event
rawTimestamp INTEGER NOT NULL, -- Raw event timestamp recorded during profiling.
timestamp INTEGER NOT NULL, -- Event timestamp converted to the profiling session timeline.
typeId INTEGER NOT NULL, -- REFERENCES GENERIC_EVENT_TYPES(typeId)
globalTid INTEGER, -- Serialized GlobalId.
data TEXT -- JSON encoded event data.
);
CREATE TABLE GENERIC_EVENT_DATA (
-- GENERIC_EVENTS data values.
genericEventId INTEGER NOT NULL, -- REFERENCES GENERIC_EVENTS(genericEventId)
fieldIdx INTEGER NOT NULL, -- Index of type field
intVal INTEGER, -- Integer value, signed
uintVal INTEGER, -- Integer value, unsigned
floatVal REAL, -- Floating point value, 32-bit
doubleVal REAL -- Floating point value, 64-bit
);
CREATE TABLE ETW_PROVIDERS (
-- Names and identifiers of ETW providers captured in the report.
providerId INTEGER NOT NULL PRIMARY KEY, -- Provider ID.
providerNameId INTEGER NOT NULL, -- REFERENCES StringIds(id) -- Provider name
guid TEXT NOT NULL -- ETW Provider GUID.
);
CREATE TABLE ETW_TASKS (
-- Names and identifiers of ETW tasks captured in the report.
taskNameId INTEGER NOT NULL, -- REFERENCES StringIds(id) -- Task name
taskId INTEGER NOT NULL, -- The event task ID.
providerId INTEGER NOT NULL -- Provider ID.
);
CREATE TABLE ETW_EVENTS (
-- Raw ETW events captured in the report.
rawTimestamp INTEGER NOT NULL, -- Raw event timestamp recorded during profiling.
timestamp INTEGER NOT NULL, -- Event start timestamp (ns).
typeId INTEGER NOT NULL, -- REFERENCES GENERIC_EVENT_TYPES(typeId)
globalTid INTEGER, -- Serialized GlobalId.
opcode INTEGER, -- The event opcode.
data TEXT NOT NULL -- JSON encoded event data.
);
CREATE TABLE TARGET_INFO_GPU_METRICS (
-- GPU Metrics, metric names and ids.
typeId INTEGER NOT NULL, -- REFERENCES GENERIC_EVENT_TYPES(typeId)
sourceId INTEGER NOT NULL, -- REFERENCES GENERIC_EVENT_SOURCES(sourceId)
typeName TEXT NOT NULL, -- Name of event type.
metricId INTEGER NOT NULL, -- Id of metric in event; not assumed to be stable.
metricName TEXT NOT NULL -- Definitive name of metric.
);
CREATE TABLE GPU_METRICS (
-- GPU Metrics, events and values.
rawTimestamp INTEGER NOT NULL, -- Raw event timestamp recorded during profiling.
timestamp INTEGER NOT NULL, -- Event timestamp (ns).
typeId INTEGER NOT NULL, -- REFERENCES TARGET_INFO_GPU_METRICS(typeId) and GENERIC_EVENT_TYPES(typeId)
metricId INTEGER NOT NULL, -- REFERENCES TARGET_INFO_GPU_METRICS(metricId)
value INTEGER NOT NULL -- Counter data value
);
CREATE TABLE TARGET_INFO_SOC_METRICS (
-- SoC Metrics, metric names and ids.
typeId INTEGER NOT NULL, -- REFERENCES GENERIC_EVENT_TYPES(typeId)
sourceId INTEGER NOT NULL, -- REFERENCES GENERIC_EVENT_SOURCES(sourceId)
typeName TEXT NOT NULL, -- Name of event type.
metricId INTEGER NOT NULL, -- Id of metric in event; not assumed to be stable.
metricName TEXT NOT NULL -- Definitive name of metric.
);
CREATE TABLE SOC_METRICS (
-- SoC Metrics, events and values.
rawTimestamp INTEGER NOT NULL, -- Raw event timestamp recorded during profiling.
timestamp INTEGER NOT NULL, -- Event timestamp (ns).
typeId INTEGER NOT NULL, -- REFERENCES TARGET_INFO_SOC_METRICS(typeId) and GENERIC_EVENT_TYPES(typeId)
metricId INTEGER NOT NULL, -- REFERENCES TARGET_INFO_GPU_METRICS(metricId)
value INTEGER NOT NULL -- Counter data value
);
CREATE TABLE MPI_COMMUNICATORS (
-- Identification of MPI communication groups.
rank INTEGER, -- Active MPI rank
timestamp INTEGER, -- Time of MPI communicator creation.
commHandle INTEGER, -- MPI communicator handle.
parentHandle INTEGER, -- MPI communicator handle.
localRank INTEGER, -- Local MPI rank in a communicator.
size INTEGER, -- MPI communicator size.
groupRoot INTEGER, -- Root rank (global) in MPI communicator.
groupRootUid INTEGER, -- Group root's communicator ID.
members TEXT, -- MPI communicator members (index is global rank).
commUid INTEGER -- Globally unique MPI communicator ID.
);
CREATE TABLE NVTX_PAYLOAD_SCHEMAS (
-- NVTX payload schema attributes.
domainId INTEGER, -- User-controlled ID that can be used to group events.
schemaId INTEGER, -- Identifier of the payload schema.
name TEXT, -- Schema name.
type INTEGER, -- Schema type.
flags INTEGER, -- Schema flags.
numEntries INTEGER, -- Number of payload schema entries.
payloadSize INTEGER, -- Size of the static payload.
alignTo INTEGER -- Field alignment in bytes.
);
CREATE TABLE NVTX_PAYLOAD_SCHEMA_ENTRIES (
-- NVTX payload schema entries.
domainId INTEGER NOT NULL, -- User-controlled ID that can be used to group events.
schemaId INTEGER NOT NULL, -- Identifier of the payload schema.
idx INTEGER NOT NULL, -- Index of the entry in the payload schema.
flags INTEGER, -- Payload entry flags.
type INTEGER, -- Payload entry type.
name TEXT, -- Label of the payload entry.
description TEXT, -- Description of the payload entry.
arrayOrUnionDetail INTEGER, -- Array length (index) or selected union member.
offset INTEGER -- Entry offset in the binary data in bytes.
);
CREATE TABLE NVTX_PAYLOAD_ENUMS (
-- NVTX payload enum attributes.
domainId INTEGER, -- User-controlled ID that can be used to group events.
schemaId INTEGER, -- Identifier of the payload schema.
name TEXT, -- Schema name.
numEntries INTEGER, -- Number of entries in the enum.
size INTEGER -- Size of enumeration type in bytes.
);
CREATE TABLE NVTX_PAYLOAD_ENUM_ENTRIES (
-- NVTX payload enum entries.
domainId INTEGER NOT NULL, -- User-controlled ID that can be used to group events.
schemaId INTEGER NOT NULL, -- Identifier of the payload schema.
idx INTEGER NOT NULL, -- Index of the entry in the payload schema.
name TEXT, -- Name of the enum value.
value INTEGER, -- Value of the enum entry.
isFlag INTEGER -- Indicates that the entry sets a specific set of bits, which can be used to define bitsets.
);
CREATE TABLE NVTX_SCOPES (
-- NVTX scopes.
domainId INTEGER, -- User-controlled ID that can be used to group events.
scopeId INTEGER, -- Scope ID.
parentScopeId INTEGER, -- Parent scope ID.
path TEXT -- Scope path.
);
CREATE TABLE CUPTI_ACTIVITY_KIND_MEMCPY (
start INTEGER NOT NULL, -- Event start timestamp (ns).
end INTEGER NOT NULL, -- Event end timestamp (ns).
deviceId INTEGER NOT NULL, -- Device ID.
contextId INTEGER NOT NULL, -- Context ID.
greenContextId INTEGER, -- Green context ID.
streamId INTEGER NOT NULL, -- Stream ID.
correlationId INTEGER, -- REFERENCES CUPTI_ACTIVITY_KIND_RUNTIME(correlationId)
globalPid INTEGER, -- Serialized GlobalId.
bytes INTEGER NOT NULL, -- Number of bytes transferred (B).
copyKind INTEGER NOT NULL, -- REFERENCES ENUM_CUDA_MEMCPY_OPER(id)
deprecatedSrcId INTEGER, -- Deprecated, use srcDeviceId instead.
srcKind INTEGER, -- REFERENCES ENUM_CUDA_MEM_KIND(id)
dstKind INTEGER, -- REFERENCES ENUM_CUDA_MEM_KIND(id)
srcDeviceId INTEGER, -- Source device ID.
srcContextId INTEGER, -- Source context ID.
dstDeviceId INTEGER, -- Destination device ID.
dstContextId INTEGER, -- Destination context ID.
migrationCause INTEGER, -- REFERENCES ENUM_CUDA_UNIF_MEM_MIGRATION(id)
graphNodeId INTEGER, -- REFERENCES CUDA_GRAPH_NODE_EVENTS(graphNodeId)
virtualAddress INTEGER, -- Virtual base address of the page/s being transferred.
copyCount INTEGER -- The total number of memcopy operations traced in this record. In CUDA MemcpyBatchAsync APIs, multiple memcpy operations may be batched together for optimization purposes based on certain heuristics.
);
CREATE TABLE CUPTI_ACTIVITY_KIND_MEMSET (
start INTEGER NOT NULL, -- Event start timestamp (ns).
end INTEGER NOT NULL, -- Event end timestamp (ns).
deviceId INTEGER NOT NULL, -- Device ID.
contextId INTEGER NOT NULL, -- Context ID.
greenContextId INTEGER, -- Green context ID.
streamId INTEGER NOT NULL, -- Stream ID.
correlationId INTEGER, -- REFERENCES CUPTI_ACTIVITY_KIND_RUNTIME(correlationId)
globalPid INTEGER, -- Serialized GlobalId.
value INTEGER NOT NULL, -- Value assigned to memory.
bytes INTEGER NOT NULL, -- Number of bytes set (B).
graphNodeId INTEGER, -- REFERENCES CUDA_GRAPH_NODE_EVENTS(graphNodeId)
memKind INTEGER -- REFERENCES ENUM_CUDA_MEM_KIND(id)
);
CREATE TABLE CUPTI_ACTIVITY_KIND_MEM_DECOMPRESS (
start INTEGER NOT NULL, -- Event start timestamp (ns).
end INTEGER NOT NULL, -- Event end timestamp (ns).
eventClass INTEGER NOT NULL, -- REFERENCES ENUM_NSYS_EVENT_CLASS(id)
deviceId INTEGER NOT NULL, -- Device ID.
contextId INTEGER NOT NULL, -- Context ID.
streamId INTEGER NOT NULL, -- Stream ID.
correlationId INTEGER, -- REFERENCES CUPTI_ACTIVITY_KIND_RUNTIME(correlationId)
globalPid INTEGER, -- Serialized GlobalId.
ChannelID INTEGER NOT NULL, -- Channel Id of MemDecompress Operation.
sourceBytes INTEGER NOT NULL, -- Number of source bytes (B).
NumberOfOperations INTEGER NOT NULL -- Number of operations.
);
CREATE TABLE CUPTI_ACTIVITY_KIND_KERNEL (
start INTEGER NOT NULL, -- Event start timestamp (ns).
end INTEGER NOT NULL, -- Event end timestamp (ns).
deviceId INTEGER NOT NULL, -- Device ID.
contextId INTEGER NOT NULL, -- Context ID.
greenContextId INTEGER, -- Green context ID.
streamId INTEGER NOT NULL, -- Stream ID.
correlationId INTEGER, -- REFERENCES CUPTI_ACTIVITY_KIND_RUNTIME(correlationId)
globalPid INTEGER, -- Serialized GlobalId.
demangledName INTEGER NOT NULL, -- REFERENCES StringIds(id) -- Kernel function name w/ templates
shortName INTEGER NOT NULL, -- REFERENCES StringIds(id) -- Base kernel function name
mangledName INTEGER, -- REFERENCES StringIds(id) -- Raw C++ mangled kernel function name
launchType INTEGER, -- REFERENCES ENUM_CUDA_KERNEL_LAUNCH_TYPE(id)
cacheConfig INTEGER, -- REFERENCES ENUM_CUDA_FUNC_CACHE_CONFIG(id)
registersPerThread INTEGER NOT NULL, -- Number of registers required for each thread executing the kernel.
gridX INTEGER NOT NULL, -- X-dimension grid size.
gridY INTEGER NOT NULL, -- Y-dimension grid size.
gridZ INTEGER NOT NULL, -- Z-dimension grid size.
blockX INTEGER NOT NULL, -- X-dimension block size.
blockY INTEGER NOT NULL, -- Y-dimension block size.
blockZ INTEGER NOT NULL, -- Z-dimension block size.
staticSharedMemory INTEGER NOT NULL, -- Static shared memory allocated for the kernel (B).
dynamicSharedMemory INTEGER NOT NULL, -- Dynamic shared memory reserved for the kernel (B).
localMemoryPerThread INTEGER NOT NULL, -- Amount of local memory reserved for each thread (B).
localMemoryTotal INTEGER NOT NULL, -- Total amount of local memory reserved for the kernel (B).
gridId INTEGER NOT NULL, -- Unique grid ID of the kernel assigned at runtime.
sharedMemoryExecuted INTEGER, -- Shared memory size set by the driver.
graphNodeId INTEGER, -- REFERENCES CUDA_GRAPH_NODE_EVENTS(graphNodeId)
sharedMemoryLimitConfig INTEGER, -- REFERENCES ENUM_CUDA_SHARED_MEM_LIMIT_CONFIG(id)
qmdBulkReleaseDone INTEGER, -- QMD bulk release done timestamp from CWD events.
qmdPreexitDone INTEGER, -- QMD pre-exit done timestamp from CWD events.
qmdLastCtaDone INTEGER, -- QMD last CTA done timestamp from CWD events.
graphId INTEGER, -- Kernel graph ID.
clusterX INTEGER, -- Cluster X dimension.
clusterY INTEGER, -- Cluster Y dimension.
clusterZ INTEGER, -- Cluster Z dimension.
clusterSchedulingPolicy INTEGER, -- Cluster scheduling policy.
maxPotentialClusterSize INTEGER, -- Maximum potential cluster size.
maxActiveClusters INTEGER, -- Maximum active clusters.
sharedMemoryRequestedPercentage INTEGER, -- Shared memory requested percentage.
tensorSizeMinusOneElements TEXT NOT NULL -- TMA descriptor tensor size minus one elements array.
);
CREATE TABLE CUPTI_ACTIVITY_KIND_SYNCHRONIZATION (
start INTEGER NOT NULL, -- Event start timestamp (ns).
end INTEGER NOT NULL, -- Event end timestamp (ns).
deviceId INTEGER NOT NULL, -- Device ID.
contextId INTEGER NOT NULL, -- Context ID.
greenContextId INTEGER, -- Green context ID.
streamId INTEGER NOT NULL, -- Stream ID.
correlationId INTEGER, -- Correlation ID of the synchronization API to which this result is associated.
globalPid INTEGER, -- Serialized GlobalId.
deprecatedSyncType INTEGER, -- Deprecated, use syncType instead. For older report, REFERENCES ENUM_CUPTI_SYNC_TYPE(id)
syncType INTEGER NOT NULL, -- REFERENCES ENUM_CUPTI_SYNC_TYPE(id)
eventId INTEGER NOT NULL, -- Event ID for which the synchronization API is called.
eventSyncId INTEGER -- CUDA Event Sync ID to link the synchronization API to associated event record API.
);
CREATE TABLE CUPTI_ACTIVITY_KIND_CUDA_EVENT (
timestamp INTEGER, -- The device-side CUDA Event completion timestamp. 0 if not collected.
deviceId INTEGER NOT NULL, -- Device ID.
contextId INTEGER NOT NULL, -- Context ID.
greenContextId INTEGER, -- Green context ID.
streamId INTEGER NOT NULL, -- Stream ID.
correlationId INTEGER, -- Correlation ID of the event record API to which this result is associated.
globalPid INTEGER, -- Serialized GlobalId.
eventId INTEGER NOT NULL, -- Event ID for which the event record API is called.
eventSyncId INTEGER -- CUDA Event Sync ID to link event record API to related synchronization APIs.
);
CREATE TABLE CUPTI_ACTIVITY_KIND_GRAPH_HOST_NODE_AND_HOST_LAUNCH (
-- This table includes both CUPTI_ACTIVITY_KIND_GRAPH_HOST_NODE and CUPTI_ACTIVITY_KIND_HOST_LAUNCH events. These are stored as a single internal event type in Nsys reports. For HOST_LAUNCH events, graphNodeId and graphId fields will be NULL.
start INTEGER NOT NULL, -- Event start timestamp (ns).
end INTEGER NOT NULL, -- Event end timestamp (ns).
deviceId INTEGER NOT NULL, -- Device ID.
contextId INTEGER NOT NULL, -- Context ID.
greenContextId INTEGER, -- Green context ID.
streamId INTEGER NOT NULL, -- Stream ID.
correlationId INTEGER, -- REFERENCES CUPTI_ACTIVITY_KIND_RUNTIME(correlationId)
globalPid INTEGER, -- Serialized GlobalId.
graphNodeId INTEGER, -- REFERENCES CUDA_GRAPH_NODE_EVENTS(graphNodeId)
graphId INTEGER -- REFERENCES CUDA_GRAPH_EVENTS(graphId)
);
CREATE TABLE CUPTI_ACTIVITY_KIND_GRAPH_TRACE (
start INTEGER NOT NULL, -- Event start timestamp (ns).
end INTEGER NOT NULL, -- Event end timestamp (ns).
deviceId INTEGER NOT NULL, -- Device ID.
contextId INTEGER NOT NULL, -- Context ID.
greenContextId INTEGER, -- Green context ID.
streamId INTEGER NOT NULL, -- Stream ID.
correlationId INTEGER, -- REFERENCES CUPTI_ACTIVITY_KIND_RUNTIME(correlationId)
globalPid INTEGER, -- Serialized GlobalId.
graphId INTEGER NOT NULL, -- REFERENCES CUDA_GRAPH_EVENTS(graphId)
graphExecId INTEGER NOT NULL -- REFERENCES CUDA_GRAPH_EVENTS(graphExecId)
);
CREATE TABLE CUPTI_ACTIVITY_KIND_OVERHEAD (
start INTEGER NOT NULL, -- Event start timestamp (ns).
end INTEGER NOT NULL, -- Event end timestamp (ns).
eventClass INTEGER NOT NULL, -- REFERENCES ENUM_NSYS_EVENT_CLASS(id)
globalTid INTEGER, -- Serialized GlobalId.
correlationId INTEGER, -- ID used to identify events that this function call has triggered.
nameId INTEGER, -- REFERENCES StringIds(id) -- Function name
overheadType INTEGER NOT NULL -- REFERENCES ENUM_CUPTI_OVERHEAD_TYPE(id)
);
CREATE TABLE CUDA_HOST_CALLBACK (
-- Host-side callback functions triggered from CUDA streams. These represent CPU-side execution from CUDA graph host function nodes or cudaLaunchHostFunc() calls. Corresponding device-side activities are stored at the CUPTI_ACTIVITY_KIND_GRAPH_HOST_NODE_AND_HOST_LAUNCH table.
start INTEGER NOT NULL, -- Event start timestamp (ns).
end INTEGER NOT NULL, -- Event end timestamp (ns).
eventClass INTEGER NOT NULL, -- REFERENCES ENUM_NSYS_EVENT_CLASS(id)
globalTid INTEGER, -- Serialized GlobalId.
correlationId INTEGER, -- ID used to identify events that this function call has triggered.
nameId INTEGER -- REFERENCES StringIds(id) -- Function name
);
CREATE TABLE CUDNN_EVENTS (
start INTEGER NOT NULL, -- Event start timestamp (ns).
end INTEGER NOT NULL, -- Event end timestamp (ns).
eventClass INTEGER NOT NULL, -- REFERENCES ENUM_NSYS_EVENT_CLASS(id)
globalTid INTEGER, -- Serialized GlobalId.
nameId INTEGER NOT NULL -- REFERENCES StringIds(id) -- Function name
);
CREATE TABLE CUBLAS_EVENTS (
start INTEGER NOT NULL, -- Event start timestamp (ns).
end INTEGER NOT NULL, -- Event end timestamp (ns).
eventClass INTEGER NOT NULL, -- REFERENCES ENUM_NSYS_EVENT_CLASS(id)
globalTid INTEGER, -- Serialized GlobalId.
nameId INTEGER NOT NULL -- REFERENCES StringIds(id) -- Function name
);
CREATE TABLE CUDA_GRAPH_NODE_EVENTS (
start INTEGER NOT NULL, -- Event start timestamp (ns).
end INTEGER NOT NULL, -- Event end timestamp (ns).
eventClass INTEGER NOT NULL, -- REFERENCES ENUM_NSYS_EVENT_CLASS(id)
globalTid INTEGER, -- Serialized GlobalId.
nameId INTEGER NOT NULL, -- REFERENCES StringIds(id) -- Function name
graphNodeId INTEGER NOT NULL, -- Graph node ID.
originalGraphNodeId INTEGER -- Reference to the original graph node ID, if cloned node.
);
CREATE TABLE CUDA_GRAPH_EVENTS (
start INTEGER NOT NULL, -- Event start timestamp (ns).
end INTEGER NOT NULL, -- Event end timestamp (ns).
eventClass INTEGER NOT NULL, -- REFERENCES ENUM_NSYS_EVENT_CLASS(id)
globalTid INTEGER, -- Serialized GlobalId.
nameId INTEGER NOT NULL, -- REFERENCES StringIds(id) -- Function name
graphId INTEGER, -- Graph ID.
originalGraphId INTEGER, -- Reference to the original graph ID, if cloned.
graphExecId INTEGER -- Executable graph ID.
);
CREATE TABLE CUPTI_ACTIVITY_KIND_RUNTIME (
start INTEGER NOT NULL, -- Event start timestamp (ns).
end INTEGER NOT NULL, -- Event end timestamp (ns).
eventClass INTEGER NOT NULL, -- REFERENCES ENUM_NSYS_EVENT_CLASS(id)
globalTid INTEGER, -- Serialized GlobalId.
correlationId INTEGER, -- ID used to identify events that this function call has triggered.
nameId INTEGER NOT NULL, -- REFERENCES StringIds(id) -- Function name
returnValue INTEGER NOT NULL, -- Return value of the function call.
callchainId INTEGER -- REFERENCES CUDA_CALLCHAINS(id)
);
CREATE TABLE CUPTI_ACTIVITY_KIND_BLOCK_TRACE (
start INTEGER NOT NULL, -- Event start timestamp (ns).
end INTEGER NOT NULL, -- Event end timestamp (ns).
deviceId INTEGER, -- Device ID.
correlationId INTEGER, -- Correlation ID of the event record API to which this result is associated.
nodeId INTEGER, -- Node ID of the event record API to which this result is associated.
SMId INTEGER, -- SM ID of the event on which the particular event was running.
globalPid INTEGER, -- Serialized GlobalId.
BlockID INTEGER NOT NULL, -- Block ID.
UGPUId INTEGER, -- uGPU ID of the event on which the particular event was running.
CGAId INTEGER -- CGA ID of the event on which the particular event was running.
);
CREATE TABLE CUPTI_ACTIVITY_KIND_BLOCK_PHASE_TRACE (
start INTEGER NOT NULL, -- Event start timestamp (ns).
end INTEGER NOT NULL, -- Event end timestamp (ns).
deviceId INTEGER, -- Device ID.
correlationId INTEGER, -- Correlation ID of the event record API to which this result is associated.
nodeId INTEGER, -- Node ID of the event record API to which this result is associated.
SMId INTEGER, -- SM ID of the event on which the particular event was running.
globalPid INTEGER, -- Serialized GlobalId.
BlockID INTEGER NOT NULL, -- Block ID.
phase1Timestamp INTEGER NOT NULL, -- Phase start timestamp.
phase2Timestamp INTEGER NOT NULL, -- Phase stop timestamp.
UGPUId INTEGER, -- uGPU ID of the event on which the particular event was running.
CGAId INTEGER -- CGA ID of the event on which the particular event was running.
);
CREATE TABLE CUPTI_ACTIVITY_KIND_WARP_TRACE (
start INTEGER NOT NULL, -- Event start timestamp (ns).
end INTEGER NOT NULL, -- Event end timestamp (ns).
deviceId INTEGER, -- Device ID.
correlationId INTEGER, -- Correlation ID of the event record API to which this result is associated.
nodeId INTEGER, -- Node ID of the event record API to which this result is associated.
SMId INTEGER, -- SM ID of the event on which the particular event was running.
globalPid INTEGER, -- Serialized GlobalId.
BlockID INTEGER NOT NULL, -- Block ID.
WarpID INTEGER NOT NULL, -- Warp ID.
UGPUId INTEGER, -- uGPU ID of the event on which the particular event was running.
CGAId INTEGER -- CGA ID of the event on which the particular event was running.
);
CREATE TABLE CUPTI_ACTIVITY_KIND_WARP_PHASE_TRACE (
start INTEGER NOT NULL, -- Event start timestamp (ns).
end INTEGER NOT NULL, -- Event end timestamp (ns).
deviceId INTEGER, -- Device ID.
correlationId INTEGER, -- Correlation ID of the event record API to which this result is associated.
nodeId INTEGER, -- Node ID of the event record API to which this result is associated.
SMId INTEGER, -- SM ID of the event on which the particular event was running.
globalPid INTEGER, -- Serialized GlobalId.
BlockID INTEGER NOT NULL, -- Block ID.
WarpID INTEGER NOT NULL, -- Warp ID.
EventName INTEGER NOT NULL, -- Event Name.
InternalEventCount INTEGER NOT NULL, -- Internal event count.
eventType INTEGER NOT NULL, -- Event type, 0 = range, 1 = marker, 2 = warp start/end
WarpEventIds TEXT NOT NULL, -- warp event ids.
WarpEventTimestampOffsets TEXT NOT NULL, -- warp event timestamp offsets.
UGPUId INTEGER, -- uGPU ID of the event on which the particular event was running.
CGAId INTEGER -- CGA ID of the event on which the particular event was running.
);
CREATE TABLE CUDA_UM_CPU_PAGE_FAULT_EVENTS (
start INTEGER NOT NULL, -- Event start timestamp (ns).
globalPid INTEGER NOT NULL, -- Serialized GlobalId.
address INTEGER NOT NULL, -- Virtual address of the page that faulted.
originalFaultPc INTEGER, -- Program counter of the CPU instruction that caused the page fault.
CpuInstruction INTEGER NOT NULL, -- REFERENCES StringIds(id) -- Function name
module INTEGER NOT NULL, -- REFERENCES StringIds(id) -- Module name
unresolvedFaultPc INTEGER, -- True if the program counter was not resolved.
sourceFile INTEGER, -- Source file where the page fault occurred.
sourceLine INTEGER -- Source line number that caused the page fault in the source file.
);
CREATE TABLE CUDA_UM_GPU_PAGE_FAULT_EVENTS (
start INTEGER NOT NULL, -- Event start timestamp (ns).
end INTEGER NOT NULL, -- Event end timestamp (ns).
globalPid INTEGER NOT NULL, -- Serialized GlobalId.
deviceId INTEGER NOT NULL, -- Device ID.
address INTEGER NOT NULL, -- Virtual address of the page that faulted.
numberOfPageFaults INTEGER NOT NULL, -- Number of page faults for the same page.
faultAccessType INTEGER NOT NULL -- REFERENCES ENUM_CUDA_UNIF_MEM_ACCESS_TYPE(id)
);
CREATE TABLE CUDA_GPU_MEMORY_USAGE_EVENTS (
start INTEGER NOT NULL, -- Event start timestamp (ns).
globalPid INTEGER NOT NULL, -- Serialized GlobalId.
deviceId INTEGER NOT NULL, -- Device ID.
contextId INTEGER NOT NULL, -- Context ID.
address INTEGER NOT NULL, -- Virtual address of the allocation/deallocation.
pc INTEGER NOT NULL, -- Program counter of the allocation/deallocation.
bytes INTEGER NOT NULL, -- Number of bytes allocated/deallocated (B).
memKind INTEGER NOT NULL, -- REFERENCES ENUM_CUDA_MEM_KIND(id)
memoryOperationType INTEGER NOT NULL, -- REFERENCES ENUM_CUDA_DEV_MEM_EVENT_OPER(id)
name TEXT, -- Variable name, if available.
correlationId INTEGER, -- REFERENCES CUPTI_ACTIVITY_KIND_RUNTIME(correlationId)
streamId INTEGER, -- Stream ID.
localMemoryPoolAddress INTEGER, -- Base address of the local memory pool used
localMemoryPoolReleaseThreshold INTEGER, -- Release threshold of the local memory pool used
localMemoryPoolSize INTEGER, -- Size of the local memory pool used
localMemoryPoolUtilizedSize INTEGER, -- Utilized size of the local memory pool used
importedMemoryPoolAddress INTEGER, -- Base address of the imported memory pool used
importedMemoryPoolProcessId INTEGER -- Process ID of the imported memory pool used
);
CREATE TABLE CUDA_GPU_MEMORY_POOL_EVENTS (
start INTEGER NOT NULL, -- Event start timestamp (ns).
globalPid INTEGER NOT NULL, -- Serialized GlobalId.
deviceId INTEGER NOT NULL, -- Device ID.
address INTEGER NOT NULL, -- The base virtual address of the memory pool.
operationType INTEGER NOT NULL, -- REFERENCES ENUM_CUDA_MEMPOOL_OPER(id)
poolType INTEGER NOT NULL, -- REFERENCES ENUM_CUDA_MEMPOOL_TYPE(id)
correlationId INTEGER, -- REFERENCES CUPTI_ACTIVITY_KIND_RUNTIME(correlationId)
minBytesToKeep INTEGER, -- Minimum number of bytes to keep of the memory pool.
localMemoryPoolReleaseThreshold INTEGER, -- Release threshold of the local memory pool used
localMemoryPoolSize INTEGER, -- Size of the local memory pool used
localMemoryPoolUtilizedSize INTEGER -- Utilized size of the local memory pool used
);
CREATE TABLE CUDA_CALLCHAINS (
id INTEGER NOT NULL, -- Part of PRIMARY KEY (id, stackDepth).
symbol INTEGER NOT NULL, -- REFERENCES StringIds(id) -- Function name
module INTEGER NOT NULL, -- REFERENCES StringIds(id) -- Module name
unresolved INTEGER, -- True if the symbol was not resolved.
originalIP INTEGER, -- Instruction pointer value.
stackDepth INTEGER NOT NULL, -- Zero-base index of the given function in call stack.
PRIMARY KEY (id, stackDepth)
);
CREATE TABLE MPI_RANKS (
-- Mapping of global thread IDs (gtid) to MPI ranks
globalTid INTEGER NOT NULL, -- Serialized GlobalId.
rank INTEGER NOT NULL -- MPI rank
);
CREATE TABLE MPI_P2P_EVENTS (
start INTEGER NOT NULL, -- Event start timestamp (ns).
end INTEGER, -- Event end timestamp (ns).
globalTid INTEGER, -- Serialized GlobalId.
textId INTEGER, -- REFERENCES StringIds(id) -- Registered NVTX domain/string
commHandle INTEGER, -- MPI communicator handle.
commUid INTEGER, -- Globally unique MPI communicator ID.
tag INTEGER, -- MPI message tag
remoteRank INTEGER, -- MPI remote rank (destination or source)
size INTEGER, -- MPI message size in bytes
requestHandle INTEGER -- MPI request handle.
);
CREATE TABLE MPI_COLLECTIVES_EVENTS (
start INTEGER NOT NULL, -- Event start timestamp (ns).
end INTEGER, -- Event end timestamp (ns).
globalTid INTEGER, -- Serialized GlobalId.
textId INTEGER, -- REFERENCES StringIds(id) -- Registered NVTX domain/string
commHandle INTEGER, -- MPI communicator handle.
commUid INTEGER, -- Globally unique MPI communicator ID.
rootRank INTEGER, -- Root rank in the collective
size INTEGER, -- MPI message size in bytes (send size for bidirectional ops)
recvSize INTEGER, -- MPI receive size in bytes
requestHandle INTEGER -- MPI request handle.
);
CREATE TABLE MPI_START_WAIT_EVENTS (
-- MPI_Start*, MPI_Test* and MPI_Wait*
start INTEGER NOT NULL, -- Event start timestamp (ns).
end INTEGER, -- Event end timestamp (ns).
globalTid INTEGER, -- Serialized GlobalId.
textId INTEGER, -- REFERENCES StringIds(id) -- Registered NVTX domain/string
requestHandle INTEGER -- MPI request handle.
);
CREATE TABLE MPI_OTHER_EVENTS (
-- MPI events without additional parameters
start INTEGER NOT NULL, -- Event start timestamp (ns).
end INTEGER, -- Event end timestamp (ns).
globalTid INTEGER, -- Serialized GlobalId.
textId INTEGER -- REFERENCES StringIds(id) -- Registered NVTX domain/string
);
CREATE TABLE UCP_WORKERS (
globalTid INTEGER NOT NULL, -- Serialized GlobalId.
workerUid INTEGER NOT NULL -- UCP worker UID
);
CREATE TABLE UCP_SUBMIT_EVENTS (
start INTEGER NOT NULL, -- Event start timestamp (ns).
end INTEGER, -- Event end timestamp (ns).
globalTid INTEGER, -- Serialized GlobalId.
textId INTEGER, -- REFERENCES StringIds(id) -- Registered NVTX domain/string
bufferAddr INTEGER, -- Address of the message buffer
packedSize INTEGER, -- Message size (packed) in bytes
peerWorkerUid INTEGER, -- Peer's UCP worker UID
tag INTEGER -- UCP message tag
);
CREATE TABLE UCP_PROGRESS_EVENTS (
start INTEGER NOT NULL, -- Event start timestamp (ns).
end INTEGER, -- Event end timestamp (ns).
globalTid INTEGER, -- Serialized GlobalId.
textId INTEGER, -- REFERENCES StringIds(id) -- Registered NVTX domain/string
bufferAddr INTEGER, -- Address of the message buffer
packedSize INTEGER, -- Message size (packed) in bytes
peerWorkerUid INTEGER, -- Peer's UCP worker UID
tag INTEGER -- UCP message tag
);
CREATE TABLE UCP_EVENTS (
-- UCP events without additional parameters
start INTEGER NOT NULL, -- Event start timestamp (ns).
end INTEGER, -- Event end timestamp (ns).
globalTid INTEGER, -- Serialized GlobalId.
textId INTEGER -- REFERENCES StringIds(id) -- Registered NVTX domain/string
);
CREATE TABLE NVTX_EVENTS (
start INTEGER NOT NULL, -- Event start timestamp (ns).
end INTEGER, -- Event end timestamp (ns).
eventType INTEGER NOT NULL, -- REFERENCES ENUM_NSYS_EVENT_TYPE(id)
rangeId INTEGER, -- Correlation ID returned from a nvtxRangeStart call.
category INTEGER, -- User-controlled ID that can be used to group events.
color INTEGER, -- Encoded ARGB color value.
text TEXT, -- Explicit name/text (non-registered string)
globalTid INTEGER, -- Serialized GlobalId.
endGlobalTid INTEGER, -- Serialized GlobalId.
textId INTEGER, -- REFERENCES StringIds(id) -- Registered NVTX domain/string
domainId INTEGER, -- User-controlled ID that can be used to group events.
uint64Value INTEGER, -- One of possible payload value union members.
int64Value INTEGER, -- One of possible payload value union members.
doubleValue REAL, -- One of possible payload value union members.
uint32Value INTEGER, -- One of possible payload value union members.
int32Value INTEGER, -- One of possible payload value union members.
floatValue REAL, -- One of possible payload value union members.
jsonTextId INTEGER, -- One of possible payload value union members.
jsonText TEXT, -- One of possible payload value union members.
binaryData TEXT -- Binary payload. See docs for format.
);
CREATE TABLE OPENGL_API (
start INTEGER NOT NULL, -- Event start timestamp (ns).
end INTEGER NOT NULL, -- Event end timestamp (ns).
eventClass INTEGER NOT NULL, -- REFERENCES ENUM_NSYS_EVENT_TYPE(id)
globalTid INTEGER, -- Serialized GlobalId.
endGlobalTid INTEGER, -- Serialized GlobalId.
correlationId INTEGER, -- First ID matching an API call to GPU workloads.
endCorrelationId INTEGER, -- Last ID matching an API call to GPU workloads.
nameId INTEGER NOT NULL, -- REFERENCES StringIds(id) -- First function name
endNameId INTEGER, -- REFERENCES StringIds(id) -- Last function name
returnValue INTEGER NOT NULL, -- Return value of the function call.
frameId INTEGER, -- Index of the graphics frame starting from 1.
contextId INTEGER, -- Context ID.
gpu INTEGER, -- GPU index.
display INTEGER -- Display ID.
);
CREATE TABLE OPENGL_WORKLOAD (
start INTEGER NOT NULL, -- Event start timestamp (ns).
end INTEGER NOT NULL, -- Event end timestamp (ns).
eventClass INTEGER NOT NULL, -- REFERENCES ENUM_NSYS_EVENT_TYPE(id)
globalTid INTEGER, -- Serialized GlobalId.
endGlobalTid INTEGER, -- Serialized GlobalId.
correlationId INTEGER, -- First ID matching an API call to GPU workloads.
endCorrelationId INTEGER, -- Last ID matching an API call to GPU workloads.
nameId INTEGER NOT NULL, -- REFERENCES StringIds(id) -- First function name
endNameId INTEGER, -- REFERENCES StringIds(id) -- Last function name
returnValue INTEGER NOT NULL, -- Return value of the function call.
frameId INTEGER, -- Index of the graphics frame starting from 1.
contextId INTEGER, -- Context ID.
gpu INTEGER, -- GPU index.
display INTEGER -- Display ID.
);
CREATE TABLE KHR_DEBUG_EVENTS (
eventClass INTEGER NOT NULL, -- REFERENCES ENUM_NSYS_EVENT_TYPE(id)
start INTEGER NOT NULL, -- Event start timestamp (ns).
end INTEGER, -- Event end timestamp (ns).
textId INTEGER, -- REFERENCES StringIds(id) -- Debug marker/group text
globalTid INTEGER, -- Serialized GlobalId.
source INTEGER, -- REFERENCES ENUM_OPENGL_DEBUG_SOURCE(id)
khrdType INTEGER, -- REFERENCES ENUM_OPENGL_DEBUG_TYPE(id)
id INTEGER, -- KHR event ID.
severity INTEGER, -- REFERENCES ENUM_OPENGL_DEBUG_SEVERITY(id)
correlationId INTEGER, -- ID used to correlate KHR CPU trace to GPU trace.
context INTEGER -- Context ID.
);
CREATE TABLE OSRT_API (
-- OS runtime libraries traced to gather information about low-level userspace APIs.
start INTEGER NOT NULL, -- Event start timestamp (ns).
end INTEGER NOT NULL, -- Event end timestamp (ns).
eventClass INTEGER NOT NULL, -- REFERENCES ENUM_NSYS_EVENT_CLASS(id)
globalTid INTEGER, -- Serialized GlobalId.
nameId INTEGER NOT NULL, -- REFERENCES StringIds(id) -- Function name
returnValue INTEGER NOT NULL, -- Return value of the function call.
nestingLevel INTEGER, -- Zero-base index of the nesting level.
callchainId INTEGER NOT NULL, -- REFERENCES OSRT_CALLCHAINS(id)
argumentsId INTEGER NOT NULL -- REFERENCES OSRT_ARGUMENTS(id) -- Experimental.
);
CREATE TABLE OSRT_CALLCHAINS (
-- Callchains attached to OSRT events, depending on selected profiling settings.
id INTEGER NOT NULL, -- Part of PRIMARY KEY (id, stackDepth).
symbol INTEGER NOT NULL, -- REFERENCES StringIds(id) -- Function name
module INTEGER NOT NULL, -- REFERENCES StringIds(id) -- Module name
kernelMode INTEGER, -- True if kernel mode.
thumbCode INTEGER, -- True if thumb code.
unresolved INTEGER, -- True if the symbol was not resolved.
specialEntry INTEGER, -- True if artifical entry added during processing callchain.
originalIP INTEGER, -- Instruction pointer value.
unwindMethod INTEGER, -- REFERENCES ENUM_STACK_UNWIND_METHOD(id)
stackDepth INTEGER NOT NULL, -- Zero-base index of the given function in call stack.
PRIMARY KEY (id, stackDepth)
);
CREATE TABLE OSRT_ARGUMENTS (
-- Arguments OSRT functions were called with. This is an experimental feature and arguments are collected for some specific functions only. Please avoid relying on the content for now.
id INTEGER NOT NULL, -- Part of PRIMARY KEY (id, argumentIndex).
value INTEGER NOT NULL, -- Value of the argument.
argumentIndex INTEGER NOT NULL, -- Zero-base index of the argument.
PRIMARY KEY (id, argumentIndex)
);
CREATE TABLE OSRT_FILE_ACCESS_EVENTS (
-- OS Runtime events related to file accesses (opening, closing, reading, and writing).
fileAccessId INTEGER NOT NULL, -- REFERENCES OSRT_FILE_ACCESS_DESCRIPTORS(fileAccessId)
threadId INTEGER NOT NULL, -- Thread ID.
startedAt INTEGER NOT NULL, -- Event start timestamp (ns).
endedAt INTEGER NOT NULL, -- Event end timestamp (ns).
eventType INTEGER NOT NULL, -- REFERENCES ENUM_OSRT_FILE_ACCESS_EVENT_TYPE(id)
apiCallId INTEGER NOT NULL, -- REFERENCES StringIds(id) -- Function name
bytesProcessed INTEGER NOT NULL, -- Actual bytes read/written.
context TEXT NOT NULL -- Additional information about the event
);
CREATE TABLE OSRT_FILE_ACCESS_DESCRIPTORS (
-- Metadata of all the file accesses that were made by the OS during the recording.
fileAccessId INTEGER NOT NULL, -- File Access Id.
processId INTEGER NOT NULL, -- Process ID.
openedAt INTEGER NOT NULL, -- The time when the file was opened (ns).
closedAt INTEGER NOT NULL, -- The time when the file was closed (ns).
filePath TEXT NOT NULL -- The opened file path.
);
CREATE TABLE PROFILER_OVERHEAD (
start INTEGER NOT NULL, -- Event start timestamp (ns).
end INTEGER NOT NULL, -- Event end timestamp (ns).
globalTid INTEGER, -- Serialized GlobalId.
nameId INTEGER NOT NULL, -- REFERENCES StringIds(id) -- Function name
overheadType INTEGER NOT NULL -- REFERENCES ENUM_CUPTI_OVERHEAD_TYPE(id)
);
CREATE TABLE SCHED_EVENTS (
-- Thread scheduling events.
start INTEGER NOT NULL, -- Event start timestamp (ns).
cpu INTEGER NOT NULL, -- ID of CPU this thread was scheduled in or out.
isSchedIn INTEGER NOT NULL, -- 0 if thread was scheduled out, non-zero otherwise.
globalTid INTEGER, -- Serialized GlobalId.
threadState INTEGER, -- REFERENCES ENUM_SAMPLING_THREAD_STATE(id)
threadBlock INTEGER -- REFERENCES ENUM_SCHEDULING_THREAD_BLOCK(id)
);
CREATE TABLE COMPOSITE_EVENTS (
-- Thread sampling events.
id INTEGER NOT NULL PRIMARY KEY, -- ID of the composite event.
start INTEGER NOT NULL, -- Event start timestamp (ns).
cpu INTEGER, -- ID of CPU this thread was running on.
threadState INTEGER, -- REFERENCES ENUM_SAMPLING_THREAD_STATE(id)
globalTid INTEGER, -- Serialized GlobalId.
cpuCycles INTEGER NOT NULL -- Value of Performance Monitoring Unit (PMU) counter.
);
CREATE TABLE SAMPLING_CALLCHAINS (
-- Callchain entries obtained from composite events, used to construct function table views.
id INTEGER NOT NULL, -- REFERENCES COMPOSITE_EVENTS(id)
symbol INTEGER NOT NULL, -- REFERENCES StringIds(id) -- Function name
module INTEGER NOT NULL, -- REFERENCES StringIds(id) -- Module name
kernelMode INTEGER, -- True if kernel mode.
thumbCode INTEGER, -- True if thumb code.
unresolved INTEGER, -- True if the symbol was not resolved.
specialEntry INTEGER, -- True if artifical entry added during processing callchain.
originalIP INTEGER, -- Instruction pointer value.
unwindMethod INTEGER, -- REFERENCES ENUM_STACK_UNWIND_METHOD(id)
stackDepth INTEGER NOT NULL, -- Zero-base index of the given function in call stack.
PRIMARY KEY (id, stackDepth)
);
CREATE TABLE PERF_EVENT_SOC_OR_CPU_RAW_EVENT (
-- SoC and CPU raw event values from Sampled Performance Counters.
start INTEGER NOT NULL, -- Event start timestamp (ns).
end INTEGER NOT NULL, -- Event end timestamp (ns).
vmId INTEGER, -- VM ID.
componentId INTEGER, -- REFERENCES TARGET_INFO_COMPONENT(componentId)
eventId INTEGER, -- REFERENCES TARGET_INFO_PERF_METRIC(id)
count INTEGER -- Counter data value
);
CREATE TABLE PERF_EVENT_SOC_OR_CPU_METRIC_EVENT (
-- SoC and CPU metric values from Sampled Performance Counters.
start INTEGER NOT NULL, -- Event start timestamp (ns).
end INTEGER NOT NULL, -- Event end timestamp (ns).
vmId INTEGER, -- VM ID.
componentId INTEGER, -- REFERENCES TARGET_INFO_COMPONENT(componentId)
metricId INTEGER, -- REFERENCES TARGET_INFO_PERF_METRIC(id)
value REAL -- Metric data value
);
CREATE TABLE DX12_API (
id INTEGER NOT NULL PRIMARY KEY,
start INTEGER NOT NULL, -- Event start timestamp (ns).
end INTEGER NOT NULL, -- Event end timestamp (ns).
eventClass INTEGER NOT NULL, -- REFERENCES ENUM_NSYS_EVENT_CLASS(id)
globalTid INTEGER, -- Serialized GlobalId.
correlationId INTEGER, -- First ID matching an API call to GPU workloads.
endCorrelationId INTEGER, -- Last ID matching an API call to GPU workloads.
nameId INTEGER NOT NULL, -- REFERENCES StringIds(id) -- Function name
shortContextId INTEGER, -- Short form of the COM interface object address.
frameId INTEGER, -- Index of the graphics frame starting from 1.
color INTEGER, -- Encoded ARGB color value.
textId INTEGER, -- REFERENCES StringIds(id) -- PIX marker text
commandListType INTEGER, -- REFERENCES ENUM_D3D12_CMD_LIST_TYPE(id)
objectNameId INTEGER, -- REFERENCES StringIds(id) -- D3D12 object name
longContextId INTEGER -- Long form of the COM interface object address.
);
CREATE TABLE DX12_WORKLOAD (
start INTEGER NOT NULL, -- Event start timestamp (ns).
end INTEGER NOT NULL, -- Event end timestamp (ns).
eventClass INTEGER NOT NULL, -- REFERENCES ENUM_NSYS_EVENT_CLASS(id)
globalTid INTEGER, -- Serialized GlobalId.
correlationId INTEGER, -- First ID matching an API call to GPU workloads.
endCorrelationId INTEGER, -- Last ID matching an API call to GPU workloads.
nameId INTEGER NOT NULL, -- REFERENCES StringIds(id) -- Function name
shortContextId INTEGER, -- Short form of the COM interface object address.
frameId INTEGER, -- Index of the graphics frame starting from 1.
gpu INTEGER, -- GPU index.
color INTEGER, -- Encoded ARGB color value.
textId INTEGER, -- REFERENCES StringIds(id) -- PIX marker text
commandListType INTEGER, -- REFERENCES ENUM_D3D12_CMD_LIST_TYPE(id)
objectNameId INTEGER, -- REFERENCES StringIds(id) -- D3D12 object name
longContextId INTEGER -- Long form of the COM interface object address.
);
CREATE TABLE DX12_MEMORY_OPERATION (
gpu INTEGER, -- GPU index.
rangeStart INTEGER, -- Time offset denoting the beginning of a memory range (B).
rangeEnd INTEGER, -- Time offset denoting the end of a memory range (B).
subresourceId INTEGER, -- Subresource index.
heapType INTEGER, -- REFERENCES ENUM_D3D12_HEAP_TYPE(id)
heapFlags INTEGER, -- REFERENCES ENUM_D3D12_HEAP_FLAGS(id)
cpuPageProperty INTEGER, -- REFERENCES ENUM_D3D12_PAGE_PROPERTY(id)
nvApiFlags INTEGER, -- NV specific flags. See docs for specifics.
objectHandle INTEGER, -- Handle to the graphics object created or modified by the memory operation.
bindTargetHandle INTEGER, -- Handle to the target resource for bind operations.
memorySize INTEGER, -- Size of the memory allocation (B).
memoryOffset INTEGER, -- Offset within the memory allocation (B).
resourceFlags INTEGER, -- Combination of D3D12_RESOURCE_FLAGS enum values specifying resource usage options.
dimension INTEGER, -- D3D12_RESOURCE_DIMENSION enum value specifying the resource type.
traceEventId INTEGER NOT NULL -- REFERENCES DX12_API(id)
);
CREATE TABLE DXGI_API (
start INTEGER NOT NULL, -- Event start timestamp (ns).
end INTEGER NOT NULL, -- Event end timestamp (ns).
eventClass INTEGER NOT NULL, -- REFERENCES ENUM_NSYS_EVENT_CLASS(id)
globalTid INTEGER, -- Serialized GlobalId.
correlationId INTEGER, -- First ID matching an API call to GPU workloads.
endCorrelationId INTEGER, -- Last ID matching an API call to GPU workloads.
nameId INTEGER NOT NULL, -- REFERENCES StringIds(id) -- Function name
shortContextId INTEGER, -- Short form of the COM interface object address.
frameId INTEGER, -- Index of the graphics frame starting from 1.
color INTEGER, -- Encoded ARGB color value.
textId INTEGER -- REFERENCES StringIds(id) -- PIX marker text
);
CREATE TABLE NVAPI_API (
id INTEGER NOT NULL PRIMARY KEY,
start INTEGER NOT NULL, -- Event start timestamp (ns).
end INTEGER NOT NULL, -- Event end timestamp (ns).
eventClass INTEGER NOT NULL, -- REFERENCES ENUM_NSYS_EVENT_CLASS(id)
globalTid INTEGER, -- Serialized GlobalId.
nameId INTEGER NOT NULL, -- REFERENCES StringIds(id) -- Function name
longContextId INTEGER -- Long form of the COM interface object address.
);
CREATE TABLE NVAPI_MEMORY_OPERATION (
rangeStart INTEGER, -- Time offset denoting the beginning of a memory range (B).
rangeEnd INTEGER, -- Time offset denoting the end of a memory range (B).
subresourceId INTEGER, -- Subresource index.
heapType INTEGER, -- REFERENCES ENUM_D3D12_HEAP_TYPE(id)
heapFlags INTEGER, -- REFERENCES ENUM_D3D12_HEAP_FLAGS(id)
memoryProperty INTEGER, -- REFERENCES ENUM_D3D12_PAGE_PROPERTY(id)
nvApiFlags INTEGER, -- NV specific flags. See docs for specifics.
traceEventId INTEGER NOT NULL -- REFERENCES NVAPI_API(id)
);
CREATE TABLE VULKAN_API (
id INTEGER NOT NULL PRIMARY KEY,
start INTEGER NOT NULL, -- Event start timestamp (ns).
end INTEGER NOT NULL, -- Event end timestamp (ns).
eventClass INTEGER NOT NULL, -- REFERENCES ENUM_NSYS_EVENT_CLASS(id)
globalTid INTEGER, -- Serialized GlobalId.
correlationId INTEGER, -- First ID matching an API call to GPU workloads.
endCorrelationId INTEGER, -- Last ID matching an API call to GPU workloads.
nameId INTEGER NOT NULL, -- REFERENCES StringIds(id) -- Function name
contextId INTEGER, -- Short form of the interface object address.
objectNameId INTEGER, -- REFERENCES StringIds(id) -- Vulkan object name
interfaceAddress INTEGER -- Interface object address.
);
CREATE TABLE VULKAN_WORKLOAD (
start INTEGER NOT NULL, -- Event start timestamp (ns).
end INTEGER NOT NULL, -- Event end timestamp (ns).
eventClass INTEGER NOT NULL, -- REFERENCES ENUM_NSYS_EVENT_CLASS(id)
globalTid INTEGER, -- Serialized GlobalId.
correlationId INTEGER, -- First ID matching an API call to GPU workloads.
endCorrelationId INTEGER, -- Last ID matching an API call to GPU workloads.
nameId INTEGER NOT NULL, -- REFERENCES StringIds(id) -- Function name
gpu INTEGER, -- GPU index.
contextId INTEGER, -- Short form of the interface object address.
color INTEGER, -- Encoded ARGB color value.
textId INTEGER -- REFERENCES StringIds(id) -- Vulkan CPU debug marker string
);
CREATE TABLE VULKAN_DEBUG_API (
start INTEGER NOT NULL, -- Event start timestamp (ns).
end INTEGER NOT NULL, -- Event end timestamp (ns).
eventClass INTEGER NOT NULL, -- REFERENCES ENUM_NSYS_EVENT_CLASS(id)
globalTid INTEGER, -- Serialized GlobalId.
correlationId INTEGER, -- First ID matching an API call to GPU workloads.
endCorrelationId INTEGER, -- Last ID matching an API call to GPU workloads.
nameId INTEGER NOT NULL, -- REFERENCES StringIds(id) -- Function name
contextId INTEGER, -- Short form of the interface object address.
color INTEGER, -- Encoded ARGB color value.
textId INTEGER -- REFERENCES StringIds(id) -- Vulkan CPU debug marker string
);
CREATE TABLE VULKAN_PIPELINE_CREATION_EVENTS (
id INTEGER NOT NULL PRIMARY KEY, -- ID of the pipeline creation event.
duration INTEGER, -- Event duration (ns).
flags INTEGER, -- REFERENCES ENUM_VULKAN_PIPELINE_CREATION_FLAGS(id)
traceEventId INTEGER NOT NULL -- REFERENCES VULKAN_API(id) -- ID of the attached vulkan API.
);
CREATE TABLE VULKAN_PIPELINE_STAGE_EVENTS (
id INTEGER NOT NULL PRIMARY KEY, -- ID of the pipeline stage event.
duration INTEGER, -- Event duration (ns).
flags INTEGER, -- REFERENCES ENUM_VULKAN_PIPELINE_CREATION_FLAGS(id)
creationEventId INTEGER NOT NULL -- REFERENCES VULKAN_PIPELINE_CREATION_EVENTS(id) -- ID of the attached pipeline creation event.
);
CREATE TABLE VULKAN_MEMORY_OPERATION (
id INTEGER NOT NULL PRIMARY KEY, -- ID of the memory operation.
gpu INTEGER, -- GPU index.
rangeStart INTEGER, -- Time offset denoting the beginning of a memory range (B).
rangeEnd INTEGER, -- Time offset denoting the end of a memory range (B).
contextId INTEGER, -- Interface object address.
objectHandle INTEGER, -- Handle to the graphics object created or modified by the memory operation.
memorySize INTEGER, -- Size of the memory allocation (B).
memoryOffset INTEGER, -- Offset within the memory allocation (B).
bindTargetHandle INTEGER, -- Handle to the target resource for bind operations.
traceEventId INTEGER NOT NULL -- REFERENCES VULKAN_API(id)
);
CREATE TABLE VULKAN_MEMORY_TYPES (
id INTEGER NOT NULL PRIMARY KEY, -- ID of the memory type entry.
heapIndex INTEGER, -- Index of the heap that this memory type references.
heapFlags INTEGER, -- REFERENCES ENUM_VULKAN_HEAP_FLAGS(id)
memoryProperty INTEGER, -- REFERENCES ENUM_VULKAN_MEMORY_PROPERTY_FLAGS(id)
heapType INTEGER, -- REFERENCES ENUM_VULKAN_HEAP_TYPE(id)
memOpId INTEGER NOT NULL -- REFERENCES VULKAN_MEMORY_OPERATION(id) -- ID of the parent memory operation.
);
CREATE TABLE GPU_CONTEXT_SWITCH_EVENTS (
tag INTEGER NOT NULL, -- REFERENCES ENUM_GPU_CTX_SWITCH(id)
vmId INTEGER NOT NULL, -- VM ID.
seqNo INTEGER NOT NULL, -- Sequential event number.
contextId INTEGER NOT NULL, -- Context ID.
timestamp INTEGER NOT NULL, -- Event start timestamp (ns).
globalPid INTEGER, -- Serialized GlobalId.
gpuId INTEGER -- GPU index.
);
CREATE TABLE OPENMP_EVENT_KIND_THREAD (
start INTEGER NOT NULL, -- Event start timestamp (ns).
end INTEGER NOT NULL, -- Event end timestamp (ns).
eventClass INTEGER NOT NULL, -- REFERENCES ENUM_NSYS_EVENT_CLASS(id)
globalTid INTEGER, -- Serialized GlobalId.
correlationId INTEGER, -- Currently unused.
nameId INTEGER NOT NULL, -- REFERENCES StringIds(id) -- Event name
eventKind INTEGER, -- REFERENCES ENUM_OPENMP_EVENT_KIND(id)
threadId INTEGER, -- Internal thread sequence starting from 1.
threadType INTEGER -- REFERENCES ENUM_OPENMP_THREAD(id)
);
CREATE TABLE OPENMP_EVENT_KIND_PARALLEL (
start INTEGER NOT NULL, -- Event start timestamp (ns).
end INTEGER NOT NULL, -- Event end timestamp (ns).
eventClass INTEGER NOT NULL, -- REFERENCES ENUM_NSYS_EVENT_CLASS(id)
globalTid INTEGER, -- Serialized GlobalId.
correlationId INTEGER, -- Currently unused.
nameId INTEGER NOT NULL, -- REFERENCES StringIds(id) -- Event name
eventKind INTEGER, -- REFERENCES ENUM_OPENMP_EVENT_KIND(id)
parallelId INTEGER, -- Internal parallel region sequence starting from 1.
parentTaskId INTEGER -- ID for task that creates this parallel region.
);
CREATE TABLE OPENMP_EVENT_KIND_SYNC_REGION_WAIT (
start INTEGER NOT NULL, -- Event start timestamp (ns).
end INTEGER NOT NULL, -- Event end timestamp (ns).
eventClass INTEGER NOT NULL, -- REFERENCES ENUM_NSYS_EVENT_CLASS(id)
globalTid INTEGER, -- Serialized GlobalId.
correlationId INTEGER, -- Currently unused.
nameId INTEGER NOT NULL, -- REFERENCES StringIds(id) -- Event name
eventKind INTEGER, -- REFERENCES ENUM_OPENMP_EVENT_KIND(id)
parallelId INTEGER, -- ID of the parallel region that this event belongs to.
taskId INTEGER, -- ID of the task that this event belongs to.
kind INTEGER -- REFERENCES ENUM_OPENMP_SYNC_REGION(id)
);
CREATE TABLE OPENMP_EVENT_KIND_SYNC_REGION (
start INTEGER NOT NULL, -- Event start timestamp (ns).
end INTEGER NOT NULL, -- Event end timestamp (ns).
eventClass INTEGER NOT NULL, -- REFERENCES ENUM_NSYS_EVENT_CLASS(id)
globalTid INTEGER, -- Serialized GlobalId.
correlationId INTEGER, -- Currently unused.
nameId INTEGER NOT NULL, -- REFERENCES StringIds(id) -- Event name
eventKind INTEGER, -- REFERENCES ENUM_OPENMP_EVENT_KIND(id)
parallelId INTEGER, -- ID of the parallel region that this event belongs to.
taskId INTEGER, -- ID of the task that this event belongs to.
kind INTEGER -- REFERENCES ENUM_OPENMP_SYNC_REGION(id)
);
CREATE TABLE OPENMP_EVENT_KIND_TASK (
start INTEGER NOT NULL, -- Event start timestamp (ns).
end INTEGER NOT NULL, -- Event end timestamp (ns).
eventClass INTEGER NOT NULL, -- REFERENCES ENUM_NSYS_EVENT_CLASS(id)
globalTid INTEGER, -- Serialized GlobalId.
correlationId INTEGER, -- Currently unused.
nameId INTEGER NOT NULL, -- REFERENCES StringIds(id) -- Event name
eventKind INTEGER, -- REFERENCES ENUM_OPENMP_EVENT_KIND(id)
parallelId INTEGER, -- ID of the parallel region that this event belongs to.
taskId INTEGER, -- ID of the task that this event belongs to.
kind INTEGER -- REFERENCES ENUM_OPENMP_TASK_FLAG(id)
);
CREATE TABLE OPENMP_EVENT_KIND_MASTER (
start INTEGER NOT NULL, -- Event start timestamp (ns).
end INTEGER NOT NULL, -- Event end timestamp (ns).
eventClass INTEGER NOT NULL, -- REFERENCES ENUM_NSYS_EVENT_CLASS(id)
globalTid INTEGER, -- Serialized GlobalId.
correlationId INTEGER, -- Currently unused.
nameId INTEGER NOT NULL, -- REFERENCES StringIds(id) -- Event name
eventKind INTEGER, -- REFERENCES ENUM_OPENMP_EVENT_KIND(id)
parallelId INTEGER, -- ID of the parallel region that this event belongs to.
taskId INTEGER -- ID of the task that this event belongs to.
);
CREATE TABLE OPENMP_EVENT_KIND_REDUCTION (
start INTEGER NOT NULL, -- Event start timestamp (ns).
end INTEGER NOT NULL, -- Event end timestamp (ns).
eventClass INTEGER NOT NULL, -- REFERENCES ENUM_NSYS_EVENT_CLASS(id)
globalTid INTEGER, -- Serialized GlobalId.
correlationId INTEGER, -- Currently unused.
nameId INTEGER NOT NULL, -- REFERENCES StringIds(id) -- Event name
eventKind INTEGER, -- REFERENCES ENUM_OPENMP_EVENT_KIND(id)
parallelId INTEGER, -- ID of the parallel region that this event belongs to.
taskId INTEGER -- ID of the task that this event belongs to.
);
CREATE TABLE OPENMP_EVENT_KIND_TASK_CREATE (
start INTEGER NOT NULL, -- Event start timestamp (ns).
end INTEGER NOT NULL, -- Event end timestamp (ns).
eventClass INTEGER NOT NULL, -- REFERENCES ENUM_NSYS_EVENT_CLASS(id)
globalTid INTEGER, -- Serialized GlobalId.
correlationId INTEGER, -- Currently unused.
nameId INTEGER NOT NULL, -- REFERENCES StringIds(id) -- Event name
eventKind INTEGER, -- REFERENCES ENUM_OPENMP_EVENT_KIND(id)
parentTaskId INTEGER, -- ID of the parent task that is creating a new task.
newTaskId INTEGER -- ID of the new task that is being created.
);
CREATE TABLE OPENMP_EVENT_KIND_TASK_SCHEDULE (
start INTEGER NOT NULL, -- Event start timestamp (ns).
end INTEGER NOT NULL, -- Event end timestamp (ns).
eventClass INTEGER NOT NULL, -- REFERENCES ENUM_NSYS_EVENT_CLASS(id)
globalTid INTEGER, -- Serialized GlobalId.
correlationId INTEGER, -- Currently unused.
nameId INTEGER NOT NULL, -- REFERENCES StringIds(id) -- Event name
eventKind INTEGER, -- REFERENCES ENUM_OPENMP_EVENT_KIND(id)
parallelId INTEGER, -- ID of the parallel region that this event belongs to.
priorTaskId INTEGER, -- ID of the task that is being switched out.
priorTaskStatus INTEGER, -- REFERENCES ENUM_OPENMP_TASK_STATUS(id)
nextTaskId INTEGER -- ID of the task that is being switched in.
);
CREATE TABLE OPENMP_EVENT_KIND_CANCEL (
start INTEGER NOT NULL, -- Event start timestamp (ns).
end INTEGER NOT NULL, -- Event end timestamp (ns).
eventClass INTEGER NOT NULL, -- REFERENCES ENUM_NSYS_EVENT_CLASS(id)
globalTid INTEGER, -- Serialized GlobalId.
correlationId INTEGER, -- Currently unused.
nameId INTEGER NOT NULL, -- REFERENCES StringIds(id) -- Event name
eventKind INTEGER, -- REFERENCES ENUM_OPENMP_EVENT_KIND(id)
taskId INTEGER -- ID of the task that is being cancelled.
);
CREATE TABLE OPENMP_EVENT_KIND_MUTEX_WAIT (
start INTEGER NOT NULL, -- Event start timestamp (ns).
end INTEGER NOT NULL, -- Event end timestamp (ns).
eventClass INTEGER NOT NULL, -- REFERENCES ENUM_NSYS_EVENT_CLASS(id)
globalTid INTEGER, -- Serialized GlobalId.
correlationId INTEGER, -- Currently unused.
nameId INTEGER NOT NULL, -- REFERENCES StringIds(id) -- Event name
eventKind INTEGER, -- REFERENCES ENUM_OPENMP_EVENT_KIND(id)
kind INTEGER, -- REFERENCES ENUM_OPENMP_MUTEX(id)
waitId INTEGER, -- ID indicating the object being waited.
taskId INTEGER -- ID of the task that this event belongs to.
);
CREATE TABLE OPENMP_EVENT_KIND_CRITICAL_SECTION (
start INTEGER NOT NULL, -- Event start timestamp (ns).
end INTEGER NOT NULL, -- Event end timestamp (ns).
eventClass INTEGER NOT NULL, -- REFERENCES ENUM_NSYS_EVENT_CLASS(id)
globalTid INTEGER, -- Serialized GlobalId.
correlationId INTEGER, -- Currently unused.
nameId INTEGER NOT NULL, -- REFERENCES StringIds(id) -- Event name
eventKind INTEGER, -- REFERENCES ENUM_OPENMP_EVENT_KIND(id)
kind INTEGER, -- REFERENCES ENUM_OPENMP_MUTEX(id)
waitId INTEGER -- ID indicating the object being held.
);
CREATE TABLE OPENMP_EVENT_KIND_MUTEX_RELEASED (
start INTEGER NOT NULL, -- Event start timestamp (ns).
end INTEGER NOT NULL, -- Event end timestamp (ns).
eventClass INTEGER NOT NULL, -- REFERENCES ENUM_NSYS_EVENT_CLASS(id)
globalTid INTEGER, -- Serialized GlobalId.
correlationId INTEGER, -- Currently unused.
nameId INTEGER NOT NULL, -- REFERENCES StringIds(id) -- Event name
eventKind INTEGER, -- REFERENCES ENUM_OPENMP_EVENT_KIND(id)
kind INTEGER, -- REFERENCES ENUM_OPENMP_MUTEX(id)
waitId INTEGER, -- ID indicating the object being released.
taskId INTEGER -- ID of the task that this event belongs to.
);
CREATE TABLE OPENMP_EVENT_KIND_LOCK_INIT (
start INTEGER NOT NULL, -- Event start timestamp (ns).
end INTEGER NOT NULL, -- Event end timestamp (ns).
eventClass INTEGER NOT NULL, -- REFERENCES ENUM_NSYS_EVENT_CLASS(id)
globalTid INTEGER, -- Serialized GlobalId.
correlationId INTEGER, -- Currently unused.
nameId INTEGER NOT NULL, -- REFERENCES StringIds(id) -- Event name
eventKind INTEGER, -- REFERENCES ENUM_OPENMP_EVENT_KIND(id)
kind INTEGER, -- REFERENCES ENUM_OPENMP_MUTEX(id)
waitId INTEGER -- ID indicating object being created/destroyed.
);
CREATE TABLE OPENMP_EVENT_KIND_LOCK_DESTROY (
start INTEGER NOT NULL, -- Event start timestamp (ns).
end INTEGER NOT NULL, -- Event end timestamp (ns).
eventClass INTEGER NOT NULL, -- REFERENCES ENUM_NSYS_EVENT_CLASS(id)
globalTid INTEGER, -- Serialized GlobalId.
correlationId INTEGER, -- Currently unused.
nameId INTEGER NOT NULL, -- REFERENCES StringIds(id) -- Event name
eventKind INTEGER, -- REFERENCES ENUM_OPENMP_EVENT_KIND(id)
kind INTEGER, -- REFERENCES ENUM_OPENMP_MUTEX(id)
waitId INTEGER -- ID indicating object being created/destroyed.
);
CREATE TABLE OPENMP_EVENT_KIND_WORKSHARE (
start INTEGER NOT NULL, -- Event start timestamp (ns).
end INTEGER NOT NULL, -- Event end timestamp (ns).
eventClass INTEGER NOT NULL, -- REFERENCES ENUM_NSYS_EVENT_CLASS(id)
globalTid INTEGER, -- Serialized GlobalId.
correlationId INTEGER, -- Currently unused.
nameId INTEGER NOT NULL, -- REFERENCES StringIds(id) -- Event name
eventKind INTEGER, -- REFERENCES ENUM_OPENMP_EVENT_KIND(id)
kind INTEGER, -- REFERENCES ENUM_OPENMP_WORK(id)
parallelId INTEGER, -- ID of the parallel region that this event belongs to.
taskId INTEGER, -- ID of the task that this event belongs to.
count INTEGER -- Measure of the quantity of work involved in the region.
);
CREATE TABLE OPENMP_EVENT_KIND_DISPATCH (
start INTEGER NOT NULL, -- Event start timestamp (ns).
end INTEGER NOT NULL, -- Event end timestamp (ns).
eventClass INTEGER NOT NULL, -- REFERENCES ENUM_NSYS_EVENT_CLASS(id)
globalTid INTEGER, -- Serialized GlobalId.
correlationId INTEGER, -- Currently unused.
nameId INTEGER NOT NULL, -- REFERENCES StringIds(id) -- Event name
eventKind INTEGER, -- REFERENCES ENUM_OPENMP_EVENT_KIND(id)
kind INTEGER, -- REFERENCES ENUM_OPENMP_DISPATCH(id)
parallelId INTEGER, -- ID of the parallel region that this event belongs to.
taskId INTEGER -- ID of the task that this event belongs to.
);
CREATE TABLE OPENMP_EVENT_KIND_FLUSH (
start INTEGER NOT NULL, -- Event start timestamp (ns).
end INTEGER NOT NULL, -- Event end timestamp (ns).
eventClass INTEGER NOT NULL, -- REFERENCES ENUM_NSYS_EVENT_CLASS(id)
globalTid INTEGER, -- Serialized GlobalId.
correlationId INTEGER, -- Currently unused.
nameId INTEGER NOT NULL, -- REFERENCES StringIds(id) -- Event name
eventKind INTEGER, -- REFERENCES ENUM_OPENMP_EVENT_KIND(id)
threadId INTEGER -- ID of the thread that this event belongs to.
);
CREATE TABLE D3D11_PIX_DEBUG_API (
-- D3D11 debug marker events.
start INTEGER NOT NULL, -- Event start timestamp (ns).
end INTEGER NOT NULL, -- Event end timestamp (ns).
globalTid INTEGER, -- Serialized GlobalId.
correlationId INTEGER, -- First ID matching an API call to GPU workloads.
endCorrelationId INTEGER, -- Last ID matching an API call to GPU workloads.
nameId INTEGER NOT NULL, -- REFERENCES StringIds(id) -- Function name
shortContextId INTEGER, -- Short form of the COM interface object address.
frameId INTEGER, -- Index of the graphics frame starting from 1.
color INTEGER, -- Encoded ARGB color value.
textId INTEGER -- REFERENCES StringIds(id) -- PIX marker text
);
CREATE TABLE D3D12_PIX_DEBUG_API (
-- D3D12 debug marker events.
start INTEGER NOT NULL, -- Event start timestamp (ns).
end INTEGER NOT NULL, -- Event end timestamp (ns).
globalTid INTEGER, -- Serialized GlobalId.
correlationId INTEGER, -- First ID matching an API call to GPU workloads.
endCorrelationId INTEGER, -- Last ID matching an API call to GPU workloads.
nameId INTEGER NOT NULL, -- REFERENCES StringIds(id) -- Function name
shortContextId INTEGER, -- Short form of the COM interface object address.
frameId INTEGER, -- Index of the graphics frame starting from 1.
color INTEGER, -- Encoded ARGB color value.
textId INTEGER, -- REFERENCES StringIds(id) -- PIX marker text
commandListType INTEGER, -- REFERENCES ENUM_D3D12_CMD_LIST_TYPE(id)
objectNameId INTEGER, -- REFERENCES StringIds(id) -- D3D12 object name
longContextId INTEGER -- Long form of the COM interface object address.
);
CREATE TABLE WDDM_EVICT_ALLOCATION_EVENTS (
-- Raw ETW EvictAllocation events.
start INTEGER NOT NULL, -- Event start timestamp (ns).
end INTEGER NOT NULL, -- Event end timestamp (ns).
globalTid INTEGER, -- Serialized GlobalId.
gpu INTEGER NOT NULL, -- GPU index.
allocationHandle INTEGER NOT NULL -- Global allocation handle.
);
CREATE TABLE WDDM_PAGING_QUEUE_PACKET_START_EVENTS (
-- Raw ETW PagingQueuePacketStart events.
start INTEGER NOT NULL, -- Event start timestamp (ns).
end INTEGER NOT NULL, -- Event end timestamp (ns).
globalTid INTEGER, -- Serialized GlobalId.
gpu INTEGER NOT NULL, -- GPU index.
dxgDevice INTEGER, -- Address of an IDXGIDevice.
dxgAdapter INTEGER, -- Address of an IDXGIAdapter.
pagingQueue INTEGER NOT NULL, -- Address of the paging queue.
pagingQueuePacket INTEGER NOT NULL, -- Address of the paging queue packet.
sequenceId INTEGER NOT NULL, -- Internal sequence starting from 0.
alloc INTEGER, -- Allocation handle.
vidMmOpType INTEGER NOT NULL, -- REFERENCES ENUM_WDDM_VIDMM_OP_TYPE(id)
pagingQueueType INTEGER NOT NULL -- REFERENCES ENUM_WDDM_PAGING_QUEUE_TYPE(id)
);
CREATE TABLE WDDM_PAGING_QUEUE_PACKET_STOP_EVENTS (
-- Raw ETW PagingQueuePacketStop events.
start INTEGER NOT NULL, -- Event start timestamp (ns).
end INTEGER NOT NULL, -- Event end timestamp (ns).
globalTid INTEGER, -- Serialized GlobalId.
gpu INTEGER NOT NULL, -- GPU index.
pagingQueue INTEGER NOT NULL, -- Address of the paging queue.
pagingQueuePacket INTEGER NOT NULL, -- Address of the paging queue packet.
sequenceId INTEGER NOT NULL -- Internal sequence starting from 0.
);
CREATE TABLE WDDM_PAGING_QUEUE_PACKET_INFO_EVENTS (
-- Raw ETW PagingQueuePacketInfo events.
start INTEGER NOT NULL, -- Event start timestamp (ns).
end INTEGER NOT NULL, -- Event end timestamp (ns).
globalTid INTEGER, -- Serialized GlobalId.
gpu INTEGER NOT NULL, -- GPU index.
pagingQueue INTEGER NOT NULL, -- Address of the paging queue.
pagingQueuePacket INTEGER NOT NULL, -- Address of the paging queue packet.
sequenceId INTEGER NOT NULL -- Internal sequence starting from 0.
);
CREATE TABLE WDDM_QUEUE_PACKET_START_EVENTS (
-- Raw ETW QueuePacketStart events.
start INTEGER NOT NULL, -- Event start timestamp (ns).
end INTEGER NOT NULL, -- Event end timestamp (ns).
globalTid INTEGER, -- Serialized GlobalId.
gpu INTEGER NOT NULL, -- GPU index.
context INTEGER NOT NULL, -- The context ID of WDDM queue.
dmaBufferSize INTEGER NOT NULL, -- The dma buffer size.
dmaBuffer INTEGER NOT NULL, -- The reported address of dma buffer.
queuePacket INTEGER NOT NULL, -- The address of queue packet.
progressFenceValue INTEGER NOT NULL, -- The fence value.
packetType INTEGER NOT NULL, -- REFERENCES ENUM_WDDM_PACKET_TYPE(id)
submitSequence INTEGER NOT NULL, -- Internal sequence starting from 1.
allocationListSize INTEGER NOT NULL, -- The number of allocations referenced.
patchLocationListSize INTEGER NOT NULL, -- The number of patch locations.
present INTEGER NOT NULL, -- True or False if the packet is a present packet.
engineType INTEGER NOT NULL, -- REFERENCES ENUM_WDDM_ENGINE_TYPE(id)
syncObject INTEGER -- The address of fence object.
);
CREATE TABLE WDDM_QUEUE_PACKET_STOP_EVENTS (
-- Raw ETW QueuePacketStop events.
start INTEGER NOT NULL, -- Event start timestamp (ns).
end INTEGER NOT NULL, -- Event end timestamp (ns).
globalTid INTEGER, -- Serialized GlobalId.
gpu INTEGER NOT NULL, -- GPU index.
context INTEGER NOT NULL, -- The context ID of WDDM queue.
queuePacket INTEGER NOT NULL, -- The address of queue packet.
packetType INTEGER NOT NULL, -- REFERENCES ENUM_WDDM_PACKET_TYPE(id)
submitSequence INTEGER NOT NULL, -- Internal sequence starting from 1.
preempted INTEGER NOT NULL, -- True or False if the packet is preempted.
timeouted INTEGER NOT NULL, -- True or False if the packet is timeouted.
engineType INTEGER NOT NULL -- REFERENCES ENUM_WDDM_ENGINE_TYPE(id)
);
CREATE TABLE WDDM_QUEUE_PACKET_INFO_EVENTS (
-- Raw ETW QueuePacketInfo events.
start INTEGER NOT NULL, -- Event start timestamp (ns).
end INTEGER NOT NULL, -- Event end timestamp (ns).
globalTid INTEGER, -- Serialized GlobalId.
gpu INTEGER NOT NULL, -- GPU index.
context INTEGER NOT NULL, -- The context ID of WDDM queue.
packetType INTEGER NOT NULL, -- REFERENCES ENUM_WDDM_PACKET_TYPE(id)
submitSequence INTEGER NOT NULL, -- Internal sequence starting from 1.
engineType INTEGER NOT NULL -- REFERENCES ENUM_WDDM_ENGINE_TYPE(id)
);
CREATE TABLE WDDM_DMA_PACKET_START_EVENTS (
-- Raw ETW DmaPacketStart events.
start INTEGER NOT NULL, -- Event start timestamp (ns).
end INTEGER NOT NULL, -- Event end timestamp (ns).
globalTid INTEGER, -- Serialized GlobalId.
gpu INTEGER NOT NULL, -- GPU index.
context INTEGER NOT NULL, -- The context ID of WDDM queue.
queuePacketContext INTEGER NOT NULL, -- The queue packet context.
uliSubmissionId INTEGER NOT NULL, -- The queue packet submission ID.
dmaBuffer INTEGER NOT NULL, -- The reported address of dma buffer.
packetType INTEGER NOT NULL, -- REFERENCES ENUM_WDDM_PACKET_TYPE(id)
ulQueueSubmitSequence INTEGER NOT NULL, -- Internal sequence starting from 1.
quantumStatus INTEGER NOT NULL, -- The quantum Status.
engineType INTEGER NOT NULL -- REFERENCES ENUM_WDDM_ENGINE_TYPE(id)
);
CREATE TABLE WDDM_DMA_PACKET_STOP_EVENTS (
-- Raw ETW DmaPacketStop events.
start INTEGER NOT NULL, -- Event start timestamp (ns).
end INTEGER NOT NULL, -- Event end timestamp (ns).
globalTid INTEGER, -- Serialized GlobalId.
gpu INTEGER NOT NULL, -- GPU index.
context INTEGER NOT NULL, -- The context ID of WDDM queue.
uliCompletionId INTEGER NOT NULL, -- The queue packet completion ID.
packetType INTEGER NOT NULL, -- REFERENCES ENUM_WDDM_PACKET_TYPE(id)
ulQueueSubmitSequence INTEGER NOT NULL, -- Internal sequence starting from 1.
preempted INTEGER NOT NULL, -- True or False if the packet is preempted.
engineType INTEGER NOT NULL -- REFERENCES ENUM_WDDM_ENGINE_TYPE(id)
);
CREATE TABLE WDDM_DMA_PACKET_INFO_EVENTS (
-- Raw ETW DmaPacketInfo events.
start INTEGER NOT NULL, -- Event start timestamp (ns).
end INTEGER NOT NULL, -- Event end timestamp (ns).
globalTid INTEGER, -- Serialized GlobalId.
gpu INTEGER NOT NULL, -- GPU index.
context INTEGER NOT NULL, -- The context ID of WDDM queue.
uliCompletionId INTEGER NOT NULL, -- The queue packet completion ID.
faultedVirtualAddress INTEGER NOT NULL, -- The virtual address of faulted process.
faultedProcessHandle INTEGER NOT NULL, -- The address of faulted process.
packetType INTEGER NOT NULL, -- REFERENCES ENUM_WDDM_PACKET_TYPE(id)
ulQueueSubmitSequence INTEGER NOT NULL, -- Internal sequence starting from 1.
interruptType INTEGER NOT NULL, -- REFERENCES ENUM_WDDM_INTERRUPT_TYPE(id)
quantumStatus INTEGER NOT NULL, -- The quantum Status.
pageFaultFlags INTEGER NOT NULL, -- The page fault flag ID.
engineType INTEGER NOT NULL -- REFERENCES ENUM_WDDM_ENGINE_TYPE(id)
);
CREATE TABLE WDDM_HW_QUEUE_EVENTS (
-- Raw ETW HwQueueStart events.
start INTEGER NOT NULL, -- Event start timestamp (ns).
end INTEGER NOT NULL, -- Event end timestamp (ns).
globalTid INTEGER, -- Serialized GlobalId.
gpu INTEGER NOT NULL, -- GPU index.
context INTEGER NOT NULL, -- The context ID of WDDM queue.
hwQueue INTEGER NOT NULL, -- The address of HW queue.
parentDxgHwQueue INTEGER NOT NULL -- The address of parent Dxg HW queue.
);
CREATE TABLE NVVIDEO_ENCODER_API (
-- NV Video Encoder API traced to gather information about NVIDIA Video Codek SDK Encoder APIs.
start INTEGER NOT NULL, -- Event start timestamp (ns).
end INTEGER NOT NULL, -- Event end timestamp (ns).
eventClass INTEGER NOT NULL, -- REFERENCES ENUM_NSYS_EVENT_CLASS(id)
globalTid INTEGER, -- Serialized GlobalId.
nameId INTEGER NOT NULL, -- REFERENCES StringIds(id) -- Function name
apiId INTEGER -- REFERENCES GPU_VIDEO_ENGINE_WORKLOAD(apiId)
);
CREATE TABLE NVVIDEO_DECODER_API (
-- NV Video Encoder API traced to gather information about NVIDIA Video Codek SDK Decoder APIs.
start INTEGER NOT NULL, -- Event start timestamp (ns).
end INTEGER NOT NULL, -- Event end timestamp (ns).
eventClass INTEGER NOT NULL, -- REFERENCES ENUM_NSYS_EVENT_CLASS(id)
globalTid INTEGER, -- Serialized GlobalId.
nameId INTEGER NOT NULL, -- REFERENCES StringIds(id) -- Function name
apiId INTEGER -- REFERENCES GPU_VIDEO_ENGINE_WORKLOAD(apiId)
);
CREATE TABLE NVVIDEO_JPEG_API (
-- NV Video Encoder API traced to gather information about NVIDIA Video Codek SDK JPEG APIs.
start INTEGER NOT NULL, -- Event start timestamp (ns).
end INTEGER NOT NULL, -- Event end timestamp (ns).
eventClass INTEGER NOT NULL, -- REFERENCES ENUM_NSYS_EVENT_CLASS(id)
globalTid INTEGER, -- Serialized GlobalId.
nameId INTEGER NOT NULL -- REFERENCES StringIds(id) -- Function name
);
CREATE TABLE GPU_VIDEO_ENGINE_WORKLOAD (
-- Video engine workload events
start INTEGER NOT NULL, -- Event start timestamp (ns).
end INTEGER NOT NULL, -- Event end timestamp (ns).
globalEngineId INTEGER NOT NULL, -- Serialized GlobalId.
engineType INTEGER NOT NULL, -- REFERENCES ENUM_VIDEO_ENGINE_TYPE(id)
engineId INTEGER NOT NULL,
vmId INTEGER NOT NULL, -- Driver provided ID.
contextId INTEGER, -- Context ID.
globalPid INTEGER, -- Serialized GlobalId.
apiId INTEGER NOT NULL, -- ID used to correlate API and workload trace.
codecId INTEGER -- REFERENCES ENUM_VIDEO_ENGINE_CODEC(id)
);
CREATE TABLE GPU_VIDEO_ENGINE_MISSING (
-- Video engine missing ranges
start INTEGER NOT NULL, -- Event start timestamp (ns).
end INTEGER NOT NULL, -- Event end timestamp (ns).
globalEngineId INTEGER NOT NULL, -- Serialized GlobalId.
rangeCount INTEGER NOT NULL -- Number of missing ranges.
);
CREATE TABLE MEMORY_TRANSFER_EVENTS (
-- Raw ETW Memory Transfer events.
start INTEGER NOT NULL, -- Event start timestamp (ns).
globalTid INTEGER, -- Serialized GlobalId.
gpu INTEGER, -- GPU index.
taskId INTEGER NOT NULL, -- The event task ID.
eventId INTEGER NOT NULL, -- Event ID.
allocationGlobalHandle INTEGER NOT NULL, -- Address of the global allocation handle.
dmaBuffer INTEGER NOT NULL, -- The reported address of dma buffer.
size INTEGER NOT NULL, -- The size of the dma buffer in bytes.
offset INTEGER NOT NULL, -- The offset from the start of the reported dma buffer in bytes.
memoryTransferType INTEGER NOT NULL -- REFERENCES ENUM_ETW_MEMORY_TRANSFER_TYPE(id)
);
CREATE TABLE NV_LOAD_BALANCE_MASTER_EVENTS (
-- Raw ETW NV-wgf2um LoadBalanceMaster events.
start INTEGER NOT NULL, -- Event start timestamp (ns).
end INTEGER NOT NULL, -- Event end timestamp (ns).
globalTid INTEGER NOT NULL, -- Serialized GlobalId.
gpu INTEGER NOT NULL, -- GPU index.
eventId INTEGER NOT NULL, -- Event ID.
task TEXT NOT NULL, -- The task name.
frameCount INTEGER NOT NULL, -- The frame ID.
frameTime REAL NOT NULL, -- Frame duration.
averageFrameTime REAL NOT NULL, -- Average of frame duration.
averageLatency REAL NOT NULL, -- Average of latency.
minLatency REAL NOT NULL, -- The minimum latency.
averageQueuedFrames REAL NOT NULL, -- Average number of queued frames.
totalActiveMs REAL NOT NULL, -- Total active time in milliseconds.
totalIdleMs REAL NOT NULL, -- Total idle time in milliseconds.
idlePercent REAL NOT NULL, -- The percentage of idle time.
isGPUAlmostOneFrameAhead INTEGER NOT NULL -- True or False if GPU is almost one frame ahead.
);
CREATE TABLE NV_LOAD_BALANCE_EVENTS (
-- Raw ETW NV-wgf2um LoadBalance events.
start INTEGER NOT NULL, -- Event start timestamp (ns).
end INTEGER NOT NULL, -- Event end timestamp (ns).
globalTid INTEGER NOT NULL, -- Serialized GlobalId.
gpu INTEGER NOT NULL, -- GPU index.
eventId INTEGER NOT NULL, -- Event ID.
task TEXT NOT NULL, -- The task name.
averageFPS REAL NOT NULL, -- Average frame per second.
queuedFrames REAL NOT NULL, -- The amount of queued frames.
averageQueuedFrames REAL NOT NULL, -- Average number of queued frames.
currentCPUTime REAL NOT NULL, -- The current CPU time.
averageCPUTime REAL NOT NULL, -- Average CPU time.
averageStallTime REAL NOT NULL, -- Average of stall time.
averageCPUIdleTime REAL NOT NULL, -- Average CPU idle time.
isGPUAlmostOneFrameAhead INTEGER NOT NULL -- True or False if GPU is almost one frame ahead.
);
CREATE TABLE PROCESSES (
-- Names and identifiers of processes captured in the report.
globalPid INTEGER, -- Serialized GlobalId.
pid INTEGER, -- The process ID.
name TEXT -- The process name.
);
CREATE TABLE CUPTI_ACTIVITY_KIND_OPENACC_DATA (
-- OpenACC data events collected using CUPTI.
start INTEGER NOT NULL, -- Event start timestamp (ns).
end INTEGER NOT NULL, -- Event end timestamp (ns).
nameId INTEGER NOT NULL, -- REFERENCES StringIds(id) -- Event name
globalTid INTEGER, -- Serialized GlobalId.
eventKind INTEGER NOT NULL, -- REFERENCES ENUM_OPENACC_EVENT_KIND(id)
DeviceType INTEGER NOT NULL, -- REFERENCES ENUM_OPENACC_DEVICE(id)
lineNo INTEGER NOT NULL, -- Line number of the directive or program construct.
cuDeviceId INTEGER NOT NULL, -- CUDA device ID. Valid only if deviceType is acc_device_nvidia.
cuContextId INTEGER NOT NULL, -- CUDA context ID. Valid only if deviceType is acc_device_nvidia.
cuStreamId INTEGER NOT NULL, -- CUDA stream ID. Valid only if deviceType is acc_device_nvidia.
srcFile INTEGER, -- REFERENCES StringIds(id) -- Source file name or path
funcName INTEGER, -- REFERENCES StringIds(id) -- Function in which event occurred
correlationId INTEGER, -- REFERENCES CUPTI_ACTIVITY_KIND_RUNTIME(correlationId)
bytes INTEGER, -- Number of bytes.
varName INTEGER -- REFERENCES StringIds(id) -- Variable name
);
CREATE TABLE CUPTI_ACTIVITY_KIND_OPENACC_LAUNCH (
-- OpenACC launch events collected using CUPTI.
start INTEGER NOT NULL, -- Event start timestamp (ns).
end INTEGER NOT NULL, -- Event end timestamp (ns).
nameId INTEGER NOT NULL, -- REFERENCES StringIds(id) -- Event name
globalTid INTEGER, -- Serialized GlobalId.
eventKind INTEGER NOT NULL, -- REFERENCES ENUM_OPENACC_EVENT_KIND(id)
DeviceType INTEGER NOT NULL, -- REFERENCES ENUM_OPENACC_DEVICE(id)
lineNo INTEGER NOT NULL, -- Line number of the directive or program construct.
cuDeviceId INTEGER NOT NULL, -- CUDA device ID. Valid only if deviceType is acc_device_nvidia.
cuContextId INTEGER NOT NULL, -- CUDA context ID. Valid only if deviceType is acc_device_nvidia.
cuStreamId INTEGER NOT NULL, -- CUDA stream ID. Valid only if deviceType is acc_device_nvidia.
srcFile INTEGER, -- REFERENCES StringIds(id) -- Source file name or path
funcName INTEGER, -- REFERENCES StringIds(id) -- Function in which event occurred
correlationId INTEGER, -- REFERENCES CUPTI_ACTIVITY_KIND_RUNTIME(correlationId)
numGangs INTEGER, -- Number of gangs created for this kernel launch.
numWorkers INTEGER, -- Number of workers created for this kernel launch.
vectorLength INTEGER, -- Number of vector lanes created for this kernel launch.
kernelName INTEGER -- REFERENCES StringIds(id) -- Kernel name
);
CREATE TABLE CUPTI_ACTIVITY_KIND_OPENACC_OTHER (
-- OpenACC other events collected using CUPTI.
start INTEGER NOT NULL, -- Event start timestamp (ns).
end INTEGER NOT NULL, -- Event end timestamp (ns).
nameId INTEGER NOT NULL, -- REFERENCES StringIds(id) -- Event name
globalTid INTEGER, -- Serialized GlobalId.
eventKind INTEGER NOT NULL, -- REFERENCES ENUM_OPENACC_EVENT_KIND(id)
DeviceType INTEGER NOT NULL, -- REFERENCES ENUM_OPENACC_DEVICE(id)
lineNo INTEGER NOT NULL, -- Line number of the directive or program construct.
cuDeviceId INTEGER NOT NULL, -- CUDA device ID. Valid only if deviceType is acc_device_nvidia.
cuContextId INTEGER NOT NULL, -- CUDA context ID. Valid only if deviceType is acc_device_nvidia.
cuStreamId INTEGER NOT NULL, -- CUDA stream ID. Valid only if deviceType is acc_device_nvidia.
srcFile INTEGER, -- REFERENCES StringIds(id) -- Source file name or path
funcName INTEGER, -- REFERENCES StringIds(id) -- Function in which event occurred
correlationId INTEGER -- REFERENCES CUPTI_ACTIVITY_KIND_RUNTIME(correlationId)
);
CREATE TABLE NET_NIC_METRIC (
start INTEGER NOT NULL, -- Event start timestamp (ns).
end INTEGER NOT NULL, -- Event end timestamp (ns).
globalId INTEGER NOT NULL, -- Serialized GlobalId.
portId INTEGER NOT NULL, -- REFERENCES NET_IB_DEVICE_PORT_INFO(portNumber) -- Port ID
metricsListId INTEGER NOT NULL, -- REFERENCES TARGET_INFO_NETWORK_METRICS(metricsListId)
metricsIdx INTEGER NOT NULL, -- REFERENCES TARGET_INFO_NETWORK_METRICS(metricsIdx)
value INTEGER NOT NULL -- Counter data value
);
CREATE TABLE NET_IB_SWITCH_METRIC (
start INTEGER NOT NULL, -- Event start timestamp (ns).
end INTEGER NOT NULL, -- Event end timestamp (ns).
globalId INTEGER NOT NULL, -- Serialized GlobalId.
portId INTEGER NOT NULL, -- REFERENCES NET_IB_DEVICE_PORT_INFO(portNumber) -- Port ID
metricsListId INTEGER NOT NULL, -- REFERENCES TARGET_INFO_NETWORK_METRICS(metricsListId)
metricsIdx INTEGER NOT NULL, -- REFERENCES TARGET_INFO_NETWORK_METRICS(metricsIdx)
value INTEGER NOT NULL -- Counter data value
);
CREATE TABLE NET_IB_SWITCH_CONGESTION_EVENT (
start INTEGER NOT NULL, -- Event start timestamp (ns).
globalId INTEGER NOT NULL, -- Serialized GlobalId (view in hex).
congestionType INTEGER, -- REFERENCES ENUM_NET_IB_CONGESTION_EVENT_TYPE(id)
packetSLID INTEGER, -- Packet Source LID
packetDLID INTEGER, -- Packet Destination LID
packetSL INTEGER, -- Packet Service Level
packetOpCode INTEGER, -- Packet Operation Code
packetSourceQP INTEGER, -- Packet Source Queue Pair
packetDestinationQP INTEGER, -- Packet Destination Queue Pair
switchIngressPort INTEGER, -- Packet's Ingress Switch Port
switchEgressPort INTEGER -- Packet's Egress Switch Port
);
CREATE TABLE PMU_EVENTS (
-- CPU Core events.
start INTEGER NOT NULL, -- Event start timestamp (ns).
end INTEGER NOT NULL, -- Event end timestamp (ns).
globalVm INTEGER NOT NULL, -- Serialized GlobalId.
cpu INTEGER NOT NULL, -- CPU ID
counter_id INTEGER -- REFERENCES PMU_EVENT_COUNTERS(id)
);
CREATE TABLE PMU_EVENT_COUNTERS (
-- CPU Core events counters.
id INTEGER NOT NULL,
idx INTEGER NOT NULL, -- REFERENCES PMU_EVENT_REQUESTS(id).
value INTEGER NOT NULL -- Counter data value
);
CREATE TABLE TRACE_PROCESS_EVENT_NVMEDIA (
start INTEGER NOT NULL, -- Event start timestamp (ns).
end INTEGER NOT NULL, -- Event end timestamp (ns).
eventClass INTEGER NOT NULL, -- REFERENCES ENUM_NSYS_EVENT_CLASS(id)
globalTid INTEGER, -- Serialized GlobalId.
nameId INTEGER NOT NULL, -- REFERENCES StringIds(id) -- Function name
correlationId INTEGER -- First ID matching an API call to GPU workloads.
);
CREATE TABLE TEGRA_INTERNAL_API_CALLS (
start INTEGER NOT NULL, -- Event start timestamp (ns).
end INTEGER NOT NULL, -- Event end timestamp (ns).
eventClass INTEGER NOT NULL, -- REFERENCES ENUM_NSYS_EVENT_CLASS(id)
globalTid INTEGER, -- Serialized GlobalId.
nameId INTEGER NOT NULL -- REFERENCES StringIds(id) -- Function name
);
CREATE TABLE UNCORE_PMU_EVENTS (
-- PMU Uncore events.
start INTEGER NOT NULL, -- Event start timestamp (ns).
end INTEGER NOT NULL, -- Event end timestamp (ns).
globalVm INTEGER NOT NULL, -- Serialized GlobalId.
clusterId INTEGER, -- Cluster ID.
counterId INTEGER -- REFERENCES UNCORE_PMU_EVENT_VALUES(id).
);
CREATE TABLE UNCORE_PMU_EVENT_VALUES (
-- Uncore events values.
id INTEGER NOT NULL,
type INTEGER NOT NULL, -- REFERENCES ENUM_NSYS_EVENT_TYPE(id)
value INTEGER NOT NULL, -- Event value.
rawId INTEGER NOT NULL, -- Event value raw ID.
clusterId INTEGER -- Cluster ID.
);
CREATE TABLE DIAGNOSTIC_EVENT (
timestamp INTEGER NOT NULL, -- Event timestamp (ns).
timestampType INTEGER NOT NULL, -- REFERENCES ENUM_DIAGNOSTIC_TIMESTAMP_SOURCE(id)
source INTEGER NOT NULL, -- REFERENCES ENUM_DIAGNOSTIC_SOURCE_TYPE(id)
severity INTEGER NOT NULL, -- REFERENCES ENUM_DIAGNOSTIC_SEVERITY_LEVEL(id)
text TEXT NOT NULL, -- Diagnostic message text
globalPid INTEGER -- Serialized GlobalId.
);
CREATE TABLE SYSCALL (
start INTEGER NOT NULL, -- Event start timestamp (ns).
end INTEGER NOT NULL, -- Event end timestamp (ns).
eventClass INTEGER NOT NULL, -- REFERENCES ENUM_NSYS_EVENT_CLASS(id)
globalTid INTEGER, -- Serialized GlobalId.
nameId INTEGER NOT NULL, -- REFERENCES StringIds(id) -- Function name
callchainId INTEGER NOT NULL -- REFERENCES SYSCALL_CALLCHAINS(id)
);
CREATE TABLE SYSCALL_CALLCHAINS (
-- Callchains attached to syscall events, depending on selected profiling settings.
id INTEGER NOT NULL, -- Part of PRIMARY KEY (id, stackDepth).
stackDepth INTEGER NOT NULL, -- Zero-base index of the given function in call stack.
symbol INTEGER NOT NULL, -- REFERENCES StringIds(id) -- Function name
module INTEGER NOT NULL, -- REFERENCES StringIds(id) -- Module name
unresolved INTEGER, -- True if the symbol was not resolved.
PRIMARY KEY (id, stackDepth)
);
CREATE TABLE BANDWIDTH_USAGE_EVENTS (
start INTEGER NOT NULL, -- Event start timestamp (ns).
end INTEGER NOT NULL, -- Event end timestamp (ns).
globalVm INTEGER NOT NULL, -- Serialized GlobalId.
valuesId INTEGER -- REFERENCES BANDWIDTH_USAGE_VALUES(id)
);
CREATE TABLE BANDWIDTH_USAGE_VALUES (
-- BandwidthUsage event XmcClient values.
id INTEGER NOT NULL,
idx INTEGER NOT NULL,
value INTEGER NOT NULL, -- Counter data value
PRIMARY KEY (id, idx)
);
Note
GENERIC_EVENTS.typeId is a composite bit field that combines HW ID, VM ID, source ID, and type ID with the following structure:
<Hardware ID:8><VM ID:8><Source ID:16><Type ID:32>
The type ID is yet another composite bit field that combines the GPU metrics event tag and the GPU ID. To extract the latter, you need to get the lower 8 bits:
SELECT typeId & 0xFF AS gpuId FROM GENERIC_EVENTS
Some event types have been deprecated and are no longer supported by Nsight Systems. While tables for these event will no longer appear in exported SQL databases, databases exported by older versions of Nsight Systems may still contain them.
CREATE TABLE ETW_EVENTS_DEPRECATED_TABLE (
    [...]
);
CREATE TABLE GPU_MEMORY_BUDGET_EVENTS (
    -- Raw ETW VidMmProcessBudgetChange events (deprecated).

    [...]
);
CREATE TABLE GPU_MEMORY_USAGE_EVENTS (
    -- Raw ETW VidMmProcessUsageChange events (deprecated).

    [...]
);
CREATE TABLE DEMOTED_BYTES_EVENTS (
    -- Raw ETW VidMmProcessDemotedCommitmentChange events (deprecated).

    [...]
);
CREATE TABLE TOTAL_BYTES_RESIDENT_IN_SEGMENT_EVENTS (
    -- Raw ETW TotalBytesResidentInSegment events (deprecated).

    [...]
);
SQLite Schema Event Values#
Here are the set values stored in enums in the Nsight Systems SQLite schema
CUDA Memcopy Kind
0 - CUDA_MEMCPY_KIND_UNKNOWN
1 - CUDA_MEMCPY_KIND_HTOD
2 - CUDA_MEMCPY_KIND_DTOH
3 - CUDA_MEMCPY_KIND_HTOA
4 - CUDA_MEMCPY_KIND_ATOH
5 - CUDA_MEMCPY_KIND_ATOA
6 - CUDA_MEMCPY_KIND_ATOD
7 - CUDA_MEMCPY_KIND_DTOA
8 - CUDA_MEMCPY_KIND_DTOD
9 - CUDA_MEMCPY_KIND_HTOH
10 - CUDA_MEMCPY_KIND_PTOP
11 - CUDA_MEMCPY_KIND_UVM_HTOD
12 - CUDA_MEMCPY_KIND_UVM_DTOH
13 - CUDA_MEMCPY_KIND_UVM_DTOD
CUDA Memory Operations Memory Kind
0 - CUDA_MEMOPR_MEMORY_KIND_PAGEABLE
1 - CUDA_MEMOPR_MEMORY_KIND_PINNED
2 - CUDA_MEMOPR_MEMORY_KIND_DEVICE
3 - CUDA_MEMOPR_MEMORY_KIND_ARRAY
4 - CUDA_MEMOPR_MEMORY_KIND_MANAGED
5 - CUDA_MEMOPR_MEMORY_KIND_DEVICE_STATIC
6 - CUDA_MEMOPR_MEMORY_KIND_MANAGED_STATIC
7 - CUDA_MEMOPR_MEMORY_KIND_UNKNOWN
CUDA Event Class Values
0 - TRACE_PROCESS_EVENT_CUDA_RUNTIME
1 - TRACE_PROCESS_EVENT_CUDA_DRIVER
13 - TRACE_PROCESS_EVENT_CUDA_EGL_DRIVER
28 - TRACE_PROCESS_EVENT_CUDNN
29 - TRACE_PROCESS_EVENT_CUBLAS
33 - TRACE_PROCESS_EVENT_CUDNN_START
34 - TRACE_PROCESS_EVENT_CUDNN_FINISH
35 - TRACE_PROCESS_EVENT_CUBLAS_START
36 - TRACE_PROCESS_EVENT_CUBLAS_FINISH
67 - TRACE_PROCESS_EVENT_CUDABACKTRACE
77 - TRACE_PROCESS_EVENT_CUDA_GRAPH_NODE_CREATION
See CUPTI documentation for detailed information on collected event and data types.
NVTX Event Type Values
33 - NvtxCategory
34 - NvtxMark
39 - NvtxThread
59 - NvtxPushPopRange
60 - NvtxStartEndRange
75 - NvtxDomainCreate
76 - NvtxDomainDestroy
The difference between text and textId columns is that if an NVTX event message was passed via call to nvtxDomainRegisterString function, then the message will be available through textId field, otherwise the text field will contain the message if it was provided.
OpenGL Events
KHR event class values
62 - KhrDebugPushPopRange
63 - KhrDebugGpuPushPopRange
KHR source kind values
0x8249 - GL_DEBUG_SOURCE_THIRD_PARTY
0x824A - GL_DEBUG_SOURCE_APPLICATION
KHR type values
0x824C - GL_DEBUG_TYPE_ERROR
0x824D - GL_DEBUG_TYPE_DEPRECATED_BEHAVIOR
0x824E - GL_DEBUG_TYPE_UNDEFINED_BEHAVIOR
0x824F - GL_DEBUG_TYPE_PORTABILITY
0x8250 - GL_DEBUG_TYPE_PERFORMANCE
0x8251 - GL_DEBUG_TYPE_OTHER
0x8268 - GL_DEBUG_TYPE_MARKER
0x8269 - GL_DEBUG_TYPE_PUSH_GROUP
0x826A - GL_DEBUG_TYPE_POP_GROUP
KHR severity values
0x826B - GL_DEBUG_SEVERITY_NOTIFICATION
0x9146 - GL_DEBUG_SEVERITY_HIGH
0x9147 - GL_DEBUG_SEVERITY_MEDIUM
0x9148 - GL_DEBUG_SEVERITY_LOW
OSRT Event Class Values
OS runtime libraries can be traced to gather information about low-level userspace APIs. This traces the system call wrappers and thread synchronization interfaces exposed by the C runtime and POSIX Threads (pthread) libraries. This does not perform a complete runtime library API trace, but instead focuses on the functions that can take a long time to execute, or could potentially cause your thread be unscheduled from the CPU while waiting for an event to complete.
OSRT events may have callchains attached to them, depending on selected profiling settings. In such cases, one can use callchainId column to select relevant callchains from OSRT_CALLCHAINS table
OSRT event class values
27 - TRACE_PROCESS_EVENT_OS_RUNTIME
31 - TRACE_PROCESS_EVENT_OS_RUNTIME_START
32 - TRACE_PROCESS_EVENT_OS_RUNTIME_FINISH
DX12 Event Class Values
41 - TRACE_PROCESS_EVENT_DX12_API
42 - TRACE_PROCESS_EVENT_DX12_WORKLOAD
43 - TRACE_PROCESS_EVENT_DX12_START
44 - TRACE_PROCESS_EVENT_DX12_FINISH
52 - TRACE_PROCESS_EVENT_DX12_DISPLAY
59 - TRACE_PROCESS_EVENT_DX12_CREATE_OBJECT
PIX Event Class Values
65 - TRACE_PROCESS_EVENT_DX12_DEBUG_API
75 - TRACE_PROCESS_EVENT_DX11_DEBUG_API
Vulkan Event Class Values
53 - TRACE_PROCESS_EVENT_VULKAN_API
54 - TRACE_PROCESS_EVENT_VULKAN_WORKLOAD
55 - TRACE_PROCESS_EVENT_VULKAN_START
56 - TRACE_PROCESS_EVENT_VULKAN_FINISH
60 - TRACE_PROCESS_EVENT_VULKAN_CREATE_OBJECT
66 - TRACE_PROCESS_EVENT_VULKAN_DEBUG_API
Vulkan Flags
VALID_BIT = 0x00000001
CACHE_HIT_BIT = 0x00000002
BASE_PIPELINE_ACCELERATION_BIT = 0x00000004
WDDM Event Values
VIDMM operation type values
0 - None
101 - RestoreSegments
102 - PurgeSegments
103 - CleanupPrimary
104 - AllocatePagingBufferResources
105 - FreePagingBufferResources
106 - ReportVidMmState
107 - RunApertureCoherencyTest
108 - RunUnmapToDummyPageTest
109 - DeferredCommand
110 - SuspendMemorySegmentAccess
111 - ResumeMemorySegmentAccess
112 - EvictAndFlush
113 - CommitVirtualAddressRange
114 - UncommitVirtualAddressRange
115 - DestroyVirtualAddressAllocator
116 - PageInDevice
117 - MapContextAllocation
118 - InitPagingProcessVaSpace
200 - CloseAllocation
202 - ComplexLock
203 - PinAllocation
204 - FlushPendingGpuAccess
205 - UnpinAllocation
206 - MakeResident
207 - Evict
208 - LockInAperture
209 - InitContextAllocation
210 - ReclaimAllocation
211 - DiscardAllocation
212 - SetAllocationPriority
1000 - EvictSystemMemoryOfferList
Paging queue type values
0 - VIDMM_PAGING_QUEUE_TYPE_UMD
1 - VIDMM_PAGING_QUEUE_TYPE_Default
2 - VIDMM_PAGING_QUEUE_TYPE_Evict
3 - VIDMM_PAGING_QUEUE_TYPE_Reclaim
Packet type values
0 - DXGKETW_RENDER_COMMAND_BUFFER
1 - DXGKETW_DEFERRED_COMMAND_BUFFER
2 - DXGKETW_SYSTEM_COMMAND_BUFFER
3 - DXGKETW_MMIOFLIP_COMMAND_BUFFER
4 - DXGKETW_WAIT_COMMAND_BUFFER
5 - DXGKETW_SIGNAL_COMMAND_BUFFER
6 - DXGKETW_DEVICE_COMMAND_BUFFER
7 - DXGKETW_SOFTWARE_COMMAND_BUFFER
Engine type values
0 - DXGK_ENGINE_TYPE_OTHER
1 - DXGK_ENGINE_TYPE_3D
2 - DXGK_ENGINE_TYPE_VIDEO_DECODE
3 - DXGK_ENGINE_TYPE_VIDEO_ENCODE
4 - DXGK_ENGINE_TYPE_VIDEO_PROCESSING
5 - DXGK_ENGINE_TYPE_SCENE_ASSEMBLY
6 - DXGK_ENGINE_TYPE_COPY
7 - DXGK_ENGINE_TYPE_OVERLAY
8 - DXGK_ENGINE_TYPE_CRYPTO
DMA interrupt type values
1 = DXGK_INTERRUPT_DMA_COMPLETED
2 = DXGK_INTERRUPT_DMA_PREEMPTED
4 = DXGK_INTERRUPT_DMA_FAULTED
9 = DXGK_INTERRUPT_DMA_PAGE_FAULTED
Queue type values
0 = Queue_Packet
1 = Dma_Packet
2 = Paging_Queue_Packet
Driver Events
Load balance event type values
1 - LoadBalanceEvent_GPU
8 - LoadBalanceEvent_CPU
21 - LoadBalanceMasterEvent_GPU
22 - LoadBalanceMasterEvent_CPU
OpenMP Events
OpenMP event class values
78 - TRACE_PROCESS_EVENT_OPENMP
79 - TRACE_PROCESS_EVENT_OPENMP_START
80 - TRACE_PROCESS_EVENT_OPENMP_FINISH
OpenMP event kind values
15 - OPENMP_EVENT_KIND_TASK_CREATE
16 - OPENMP_EVENT_KIND_TASK_SCHEDULE
17 - OPENMP_EVENT_KIND_CANCEL
20 - OPENMP_EVENT_KIND_MUTEX_RELEASED
21 - OPENMP_EVENT_KIND_LOCK_INIT
22 - OPENMP_EVENT_KIND_LOCK_DESTROY
25 - OPENMP_EVENT_KIND_DISPATCH
26 - OPENMP_EVENT_KIND_FLUSH
27 - OPENMP_EVENT_KIND_THREAD
28 - OPENMP_EVENT_KIND_PARALLEL
29 - OPENMP_EVENT_KIND_SYNC_REGION_WAIT
30 - OPENMP_EVENT_KIND_SYNC_REGION
31 - OPENMP_EVENT_KIND_TASK
32 - OPENMP_EVENT_KIND_MASTER
33 - OPENMP_EVENT_KIND_REDUCTION
34 - OPENMP_EVENT_KIND_MUTEX_WAIT
35 - OPENMP_EVENT_KIND_CRITICAL_SECTION
36 - OPENMP_EVENT_KIND_WORKSHARE
OpenMP thread type values
1 - OpenMP Initial Thread
2 - OpenMP Worker Thread
3 - OpenMP Internal Thread
4 - Unknown
OpenMP sync region kind values
1 - Barrier
2 - Implicit barrier
3 - Explicit barrier
4 - Implementation-dependent barrier
5 - Taskwait
6 - Taskgroup
OpenMP task kind values
1 - Initial task
2 - Implicit task
3 - Explicit task
OpenMP prior task status values
1 - Task completed
2 - Task yielded to another task
3 - Task was cancelled
7 - Task was switched out for other reasons
OpenMP mutex kind values
1 - Waiting for lock
2 - Testing lock
3 - Waiting for nested lock
4 - Tesing nested lock
5 - Waitng for entering critical section region
6 - Waiting for entering atomic region
7 - Waiting for entering ordered region
OpenMP critical section kind values
5 - Critical section region
6 - Atomic region
7 - Ordered region
OpenMP workshare kind values
1 - Loop region
2 - Sections region
3 - Single region (executor)
4 - Single region (waiting)
5 - Workshare region
6 - Distrubute region
7 - Taskloop region
OpenMP dispatch kind values
1 - Iteration
2 - Section
Common SQLite Examples#
Common Helper Commands
When utilizing the sqlite3 command line tool, it’s helpful to have data printed as named columns, this can be done with:
.mode column
.headers on
The default column width is determined by the data in the first row of results. If this doesn’t work out well, you can specify widths manually.
.width 10 20 50
Obtaining Sample Report
The CLI interface of Nsight Systems was used to profile the radixSortThrust CUDA sample, then the resulting .nsys-rep file was exported using the nsys export.
nsys profile --trace=cuda,osrt radixSortThrust
nsys export --type sqlite report1.nsys-rep
Serialized Process and Thread Identifiers
Note
The globalTid field is a 64-bit identifier that encodes multiple components into a single value: <Hardware ID:8><VM ID:8><Process ID:24><Thread ID:24> It follows the structure:
Thread ID: bits 0–23
Process ID: bits 24–47
VM ID: bits 48–55
Hardware ID: bits 56–63
Goal: Extract readable process ID (PID) and thread ID (TID) values from Nsight Systems’s serialized identifier format.
Nsight Systems stores identifiers where events originated in serialized form to efficiently pack multiple values into a single field. This example shows how to decode them back to standard PID/TID format.
What the code does: Uses bit shifting and modulo operations to extract the embedded PID and TID values from the globalTid field.
For events that have globalTid or globalPid fields exported, use the following code to extract numeric TID and PID.
SELECT globalTid / 0x1000000 % 0x1000000 AS PID, globalTid % 0x1000000 AS TID FROM TABLE_NAME;
# Python equivalent:
def extract_pid_tid(global_tid):
    PID = (global_tid // 0x1000000) % 0x1000000
    TID = global_tid % 0x1000000
    return PID, TID
Note
globalTid field includes both TID and PID values, while globalPid only contains the PID value.
Understanding Event Types and Tags
Many tables in the nsys SQLite export use numeric codes for event types, tags, and classes. These codes represent different categories of events:
Event Types: Identify the kind of operation or marker (e.g., NVTX marks vs ranges)
Tags: Specify event phases like BEGIN/END for state transitions
Event Classes: Categorize broad event categories (e.g., different types of GPU operations)
When you see numeric values in queries, refer to the documentation sections above or query the relevant string tables to understand their meanings.
Correlate CUDA Kernel Launches With CUDA API Kernel Launches
Goal: Link CUDA runtime API calls to the actual GPU kernels they launch, enabling analysis of which API calls resulted in the longest-running kernels.
What the code does: 1. Adds human-readable columns to the runtime table 2. Joins runtime API calls with GPU kernel executions using correlation IDs 3. Populates kernel names and API function names from the string table 4. Finds the 10 longest API calls that resulted in kernel execution
ALTER TABLE CUPTI_ACTIVITY_KIND_RUNTIME ADD COLUMN name TEXT;
ALTER TABLE CUPTI_ACTIVITY_KIND_RUNTIME ADD COLUMN kernelName TEXT;

UPDATE CUPTI_ACTIVITY_KIND_RUNTIME SET kernelName =
    (SELECT value FROM StringIds
    JOIN CUPTI_ACTIVITY_KIND_KERNEL AS cuda_gpu
        ON cuda_gpu.shortName = StringIds.id
        AND CUPTI_ACTIVITY_KIND_RUNTIME.correlationId = cuda_gpu.correlationId);

UPDATE CUPTI_ACTIVITY_KIND_RUNTIME SET name =
    (SELECT value FROM StringIds WHERE nameId = StringIds.id);
Select the 10 longest CUDA API ranges that resulted in kernel execution.
SELECT name, kernelName, start, end FROM CUPTI_ACTIVITY_KIND_RUNTIME
    WHERE kernelName IS NOT NULL ORDER BY end - start LIMIT 10;
# Python equivalent workflow:
# 1. Load runtime and kernel data
# 2. Join on correlation_id to match API calls with kernels
# 3. Add readable names from string table
# 4. Sort by duration and get top 10

runtime_with_kernels = runtime.merge(kernels, on='correlationId')
runtime_with_kernels['duration'] = runtime_with_kernels['end'] - runtime_with_kernels['start']
top_10_longest = runtime_with_kernels.nlargest(10, 'duration')
Results:
name                    kernelName               start       end
----------------------  -----------------------  ----------  ----------
cudaLaunchKernel_v7000  RadixSortScanBinsKernel  658863435   658868490
cudaLaunchKernel_v7000  RadixSortScanBinsKernel  609755015   609760075
cudaLaunchKernel_v7000  RadixSortScanBinsKernel  632683286   632688349
cudaLaunchKernel_v7000  RadixSortScanBinsKernel  606495356   606500439
cudaLaunchKernel_v7000  RadixSortScanBinsKernel  603114486   603119586
cudaLaunchKernel_v7000  RadixSortScanBinsKernel  802729785   802734906
cudaLaunchKernel_v7000  RadixSortScanBinsKernel  593381170   593386294
cudaLaunchKernel_v7000  RadixSortScanBinsKernel  658759955   658765090
cudaLaunchKernel_v7000  RadixSortScanBinsKernel  681549917   681555059
cudaLaunchKernel_v7000  RadixSortScanBinsKernel  717812527   717817671
Remove Ranges Overlapping With Overhead
Goal: Identify and remove CUDA API calls that overlap with profiler overhead to get cleaner performance measurements.
What the code does: Uses spatial overlap detection to find CUDA runtime ranges that intersect with profiler overhead periods. The query checks for three types of overlap: range starts within overhead, range ends within overhead, or range completely encompasses overhead.
Use the this query to count CUDA API ranges overlapping with the overhead ones.
Replace “SELECT COUNT(*)” with “DELETE” to remove such ranges.
SELECT COUNT(*) FROM CUPTI_ACTIVITY_KIND_RUNTIME WHERE rowid IN
(
    SELECT cuda.rowid
    FROM PROFILER_OVERHEAD as overhead
    INNER JOIN CUPTI_ACTIVITY_KIND_RUNTIME as cuda ON
    (cuda.start BETWEEN overhead.start and overhead.end)
    OR (cuda.end BETWEEN overhead.start and overhead.end)
    OR (cuda.start < overhead.start AND cuda.end > overhead.end)
);
# Python equivalent for finding overlaps:
def ranges_overlap(range1_start, range1_end, range2_start, range2_end):
    return (range1_start <= range2_end and range1_end >= range2_start)

overlapping_ranges = []
for cuda_range in cuda_ranges:
    for overhead_range in overhead_ranges:
        if ranges_overlap(cuda_range.start, cuda_range.end,
                        overhead_range.start, overhead_range.end):
            overlapping_ranges.append(cuda_range)
Results:
COUNT(*)
----------
1095
Find CUDA API Calls that Resulted in the Original Graph Node Creation
Goal: Identify which CUDA API calls were responsible for creating the original nodes in CUDA graphs (as opposed to cloned or instantiated nodes).
What the code does: 1. Filters graph nodes to find only original creations (those without originalGraphNodeId) 2. Groups by graphNodeId to get the first occurrence 3. Correlates with CUDA runtime API calls that were active when the graph node was created 4. Joins with string table to get readable API function names
SELECT graph.graphNodeId, api.start, graph.start as graphStart, api.end,
    api.globalTid, api.correlationId, api.globalTid,
    (SELECT value FROM StringIds where api.nameId == id) as name
FROM CUPTI_ACTIVITY_KIND_RUNTIME as api
JOIN
    (
        SELECT start, graphNodeId, globalTid from CUDA_GRAPH_NODE_EVENTS
        GROUP BY graphNodeId
        HAVING COUNT(originalGraphNodeId) = 0
    ) as graph
ON api.globalTid == graph.globalTid AND api.start < graph.start AND api.end > graph.start
ORDER BY graphNodeId;
Results:
graphNodeId  start       graphStart  end         globalTid        correlationId  globalTid        name
-----------  ----------  ----------  ----------  ---------------  -------------  ---------------  -----------------------------
1            584366518   584378040   584379102   281560221750233  109            281560221750233  cudaGraphAddMemcpyNode_v10000
2            584379402   584382428   584383139   281560221750233  110            281560221750233  cudaGraphAddMemsetNode_v10000
3            584390663   584395352   584396053   281560221750233  111            281560221750233  cudaGraphAddKernelNode_v10000
4            584396314   584397857   584398438   281560221750233  112            281560221750233  cudaGraphAddMemsetNode_v10000
5            584398759   584400311   584400812   281560221750233  113            281560221750233  cudaGraphAddKernelNode_v10000
6            584401083   584403047   584403527   281560221750233  114            281560221750233  cudaGraphAddMemcpyNode_v10000
7            584403928   584404920   584405491   281560221750233  115            281560221750233  cudaGraphAddHostNode_v10000
29           632107852   632117921   632121407   281560221750233  144            281560221750233  cudaMemcpyAsync_v3020
30           632122168   632125545   632127989   281560221750233  145            281560221750233  cudaMemsetAsync_v3020
31           632131546   632133339   632135584   281560221750233  147            281560221750233  cudaMemsetAsync_v3020
34           632162514   632167393   632169297   281560221750233  151            281560221750233  cudaMemcpyAsync_v3020
35           632170068   632173334   632175388   281560221750233  152            281560221750233  cudaLaunchHostFunc_v10000
Backtraces for OSRT Ranges
Goal: Analyze operating system runtime (OSRT) function calls with their full call stacks to understand performance bottlenecks and call patterns.
What the code does: 1. Adds human-readable columns for function names, symbol names, and module names 2. Populates these from the string table for better readability 3. Shows how to query the longest OSRT call with its complete backtrace
Adding text columns makes results of the query below more human-readable.
ALTER TABLE OSRT_API ADD COLUMN name TEXT;
UPDATE OSRT_API SET name = (SELECT value FROM StringIds WHERE OSRT_API.nameId = StringIds.id);

ALTER TABLE OSRT_CALLCHAINS ADD COLUMN symbolName TEXT;
UPDATE OSRT_CALLCHAINS SET symbolName = (SELECT value FROM StringIds WHERE symbol = StringIds.id);

ALTER TABLE OSRT_CALLCHAINS ADD COLUMN moduleName TEXT;
UPDATE OSRT_CALLCHAINS SET moduleName = (SELECT value FROM StringIds WHERE module = StringIds.id);
Print backtrace of the longest OSRT range.
SELECT globalTid / 0x1000000 % 0x1000000 AS PID, globalTid % 0x1000000 AS TID,
    start, end, name, callchainId, stackDepth, symbolName, moduleName
FROM OSRT_API LEFT JOIN OSRT_CALLCHAINS ON callchainId == OSRT_CALLCHAINS.id
WHERE OSRT_API.rowid IN (SELECT rowid FROM OSRT_API ORDER BY end - start DESC LIMIT 1)
ORDER BY stackDepth LIMIT 10;
# Python equivalent for finding longest call with backtrace:
longest_call = osrt_api.loc[osrt_api['duration'].idxmax()]
backtrace = osrt_callchains[osrt_callchains['id'] == longest_call['callchainId']]
backtrace_ordered = backtrace.sort_values('stackDepth')
Results:
PID         TID         start       end         name                    callchainId  stackDepth  symbolName                      moduleName
----------  ----------  ----------  ----------  ----------------------  -----------  ----------  ------------------------------  ----------------------------------------
19163       19176       360897690   860966851   pthread_cond_timedwait  88           0           pthread_cond_timedwait@GLIBC_2  /lib/x86_64-linux-gnu/libpthread-2.27.so
19163       19176       360897690   860966851   pthread_cond_timedwait  88           1           0x7fbc983b7227                  /usr/lib/x86_64-linux-gnu/libcuda.so.418
19163       19176       360897690   860966851   pthread_cond_timedwait  88           2           0x7fbc9835d5c7                  /usr/lib/x86_64-linux-gnu/libcuda.so.418
19163       19176       360897690   860966851   pthread_cond_timedwait  88           3           0x7fbc983b64a8                  /usr/lib/x86_64-linux-gnu/libcuda.so.418
19163       19176       360897690   860966851   pthread_cond_timedwait  88           4           start_thread                    /lib/x86_64-linux-gnu/libpthread-2.27.so
19163       19176       360897690   860966851   pthread_cond_timedwait  88           5           __clone                         /lib/x86_64-linux-gnu/libc-2.27.so
Profiled processes output streams.
Goal: Access stdout and stderr output from profiled processes to correlate application output with performance data.
What the code does: Resolves file paths and content from string IDs to show the captured stdout/stderr streams from profiled applications.
ALTER TABLE ProcessStreams ADD COLUMN filename TEXT;
UPDATE ProcessStreams SET filename = (SELECT value FROM StringIds WHERE ProcessStreams.filenameId = StringIds.id);

ALTER TABLE ProcessStreams ADD COLUMN content TEXT;
UPDATE ProcessStreams SET content = (SELECT value FROM StringIds WHERE ProcessStreams.contentId = StringIds.id);
Select all collected stdout and stderr streams.
select globalPid / 0x1000000 % 0x1000000 AS PID, filename, content from ProcessStreams;
Results:
PID         filename                                                 content
----------  -------------------------------------------------------  --------------------------------------------------------------------------------------------------------------------
19163       /tmp/nvidia/nsight_systems/streams/pid_19163_stdout.log  /home/user_name/NVIDIA_CUDA-10.1_Samples/6_Advanced/radixSortThrust/radixSortThrust Starting...

GPU Device 0: "Quadro P2000" with compute capability 6.1


Sorting 1048576 32-bit unsigned int keys and values

radixSortThrust, Throughput = 401.0872 MElements/s, Time = 0.00261 s, Size = 1048576 elements
Test passed

19163       /tmp/nvidia/nsight_systems/streams/pid_19163_stderr.log
Thread Summary
Goal: Calculate CPU utilization statistics per thread to identify which threads are consuming the most CPU resources.
Note that Nsight Systems applies additional logic during sampling events processing to work around lost events. This means that the results of the below query might differ slightly from the ones shown in “Analysis Summary” tab.
Approach 1: Using CPU Cycles (when available)
What this code does: Calculates thread CPU utilization using hardware performance counter data (CPU cycles) which provides the most accurate measurement of actual CPU usage per thread.
SELECT
    globalTid / 0x1000000 % 0x1000000 AS PID,
    globalTid % 0x1000000 AS TID,
    ROUND(100.0 * SUM(cpuCycles) /
        (
            SELECT SUM(cpuCycles) FROM COMPOSITE_EVENTS
            GROUP BY globalTid / 0x1000000000000 % 0x100
        ),
        2
    ) as CPU_utilization,
    (SELECT value FROM StringIds WHERE id =
        (
            SELECT nameId FROM ThreadNames
            WHERE ThreadNames.globalTid = COMPOSITE_EVENTS.globalTid
        )
    ) as thread_name
FROM COMPOSITE_EVENTS
GROUP BY globalTid
ORDER BY CPU_utilization DESC
LIMIT 10;
Results:
PID         TID         CPU_utilization  thread_name
----------  ----------  ---------------  ---------------
19163       19163       98.4             radixSortThrust
19163       19168       1.35             CUPTI worker th
19163       19166       0.25             [NS]
Approach 2: Using Scheduling Events (when PMU data not available)
What this approach does: When CPU cycle counter data is not collected, this method calculates thread CPU time based on scheduling events (when threads are scheduled in/out), then calculates utilization percentages. This approach is less precise but still useful for understanding relative thread activity.
CREATE INDEX sched_start ON SCHED_EVENTS (start);

CREATE TABLE CPU_USAGE AS
SELECT
    first.globalTid as globalTid,
    (SELECT nameId FROM ThreadNames WHERE ThreadNames.globalTid = first.globalTid) as nameId,
    sum(second.start - first.start) as total_duration,
    count() as ranges_count
FROM SCHED_EVENTS as first
LEFT JOIN SCHED_EVENTS as second
ON second.rowid =
    (
        SELECT rowid
        FROM SCHED_EVENTS
        WHERE start > first.start AND globalTid = first.globalTid
        ORDER BY start ASC
        LIMIT 1
    )
WHERE first.isSchedIn != 0
GROUP BY first.globalTid
ORDER BY total_duration DESC;

SELECT
    globalTid / 0x1000000 % 0x1000000 AS PID,
    globalTid % 0x1000000 AS TID,
    (SELECT value FROM StringIds where nameId == id) as thread_name,
    ROUND(100.0 * total_duration / (SELECT SUM(total_duration) FROM CPU_USAGE), 2) as CPU_utilization
FROM CPU_USAGE
ORDER BY CPU_utilization DESC;
# Python equivalent for scheduling-based calculation:
def calculate_thread_cpu_time(sched_events):
    cpu_usage = {}
    for tid in unique_tids:
        tid_events = sched_events[sched_events['globalTid'] == tid]
        tid_events = tid_events[tid_events['isSchedIn'] == 1]  # Only sched-in events

        total_time = 0
        for i in range(len(tid_events) - 1):
            time_slice = tid_events.iloc[i+1]['start'] - tid_events.iloc[i]['start']
            total_time += time_slice

        cpu_usage[tid] = total_time
    return cpu_usage
Results:
PID         TID         thread_name      CPU_utilization
----------  ----------  ---------------  ---------------
19163       19163       radixSortThrust  93.74
19163       19169       radixSortThrust  3.22
19163       19168       CUPTI worker th  2.46
19163       19166       [NS]             0.44
19163       19172       radixSortThrust  0.07
19163       19167       [NS Comms]       0.05
19163       19176       radixSortThrust  0.02
19163       19170       radixSortThrust  0.0
Function Table
Goal: Create profiler-style function tables showing flat view (total time in each function across all call stacks) and bottom-up view (time spent directly in each function).
What the code does: Processes sampling callchain data to calculate time spent in functions, providing two views commonly used in profilers.
These examples demonstrate how to calculate Flat and BottomUp (for top level only) views statistics.
To set up:
ALTER TABLE SAMPLING_CALLCHAINS ADD COLUMN symbolName TEXT;
UPDATE SAMPLING_CALLCHAINS SET symbolName = (SELECT value FROM StringIds WHERE symbol = StringIds.id);

ALTER TABLE SAMPLING_CALLCHAINS ADD COLUMN moduleName TEXT;
UPDATE SAMPLING_CALLCHAINS SET moduleName = (SELECT value FROM StringIds WHERE module = StringIds.id);
To get flat view:
Flat view: Shows total time spent in each function across all call stacks (inclusive time).
SELECT symbolName, moduleName, ROUND(100.0 * sum(cpuCycles) /
    (SELECT SUM(cpuCycles) FROM COMPOSITE_EVENTS), 2) AS flatTimePercentage
FROM SAMPLING_CALLCHAINS
LEFT JOIN COMPOSITE_EVENTS ON SAMPLING_CALLCHAINS.id == COMPOSITE_EVENTS.id
GROUP BY symbol, module
ORDER BY flatTimePercentage DESC
LIMIT 5;
To get BottomUp view (top level only):
Bottom-up view: Shows time spent directly in each function (exclusive time, only leaf functions in call stacks).
SELECT symbolName, moduleName, ROUND(100.0 * sum(cpuCycles) /
    (SELECT SUM(cpuCycles) FROM COMPOSITE_EVENTS), 2) AS selfTimePercentage
FROM SAMPLING_CALLCHAINS
LEFT JOIN COMPOSITE_EVENTS ON SAMPLING_CALLCHAINS.id == COMPOSITE_EVENTS.id
WHERE stackDepth == 0
GROUP BY symbol, module
ORDER BY selfTimePercentage DESC
LIMIT 5;
# Python equivalent:
# Flat view - aggregate all occurrences of each function
flat_view = callchains.groupby(['symbol', 'module'])['cpuCycles'].sum()
flat_percentages = (flat_view / total_cycles * 100).sort_values(ascending=False)

# Bottom-up view - only leaf nodes (stackDepth == 0)
leaf_functions = callchains[callchains['stackDepth'] == 0]
bottomup_view = leaf_functions.groupby(['symbol', 'module'])['cpuCycles'].sum()
Results:
symbolName   moduleName   flatTimePercentage
-----------  -----------  ------------------
[Max depth]  [Max depth]  99.92
thrust::zip  /home/user_  24.17
thrust::zip  /home/user_  24.17
thrust::det  /home/user_  24.17
thrust::det  /home/user_  24.17
symbolName      moduleName                                   selfTimePercentage
--------------  -------------------------------------------  ------------------
0x7fbc984982b6  /usr/lib/x86_64-linux-gnu/libcuda.so.418.39  5.29
0x7fbc982d0010  /usr/lib/x86_64-linux-gnu/libcuda.so.418.39  2.81
thrust::iterat  /home/user_name/NVIDIA_CUDA-10.1_Samples/6_  2.23
thrust::iterat  /home/user_name/NVIDIA_CUDA-10.1_Samples/6_  1.55
void thrust::i  /home/user_name/NVIDIA_CUDA-10.1_Samples/6_  1.55
DX12 API Frame Duration Histogram
Goal: Analyze DirectX 12 application frame timing by measuring the duration between consecutive Present calls and creating a timing histogram.
What the code does: 1. Creates a view that pairs consecutive Present calls to calculate frame durations 2. Groups frame durations into millisecond buckets 3. Counts how many frames fall into each duration bucket
The example demonstrates how to calculate DX12 CPU frames durartion and construct a histogram out of it.
CREATE INDEX DX12_API_ENDTS ON DX12_API (end);

CREATE TEMP VIEW DX12_API_FPS AS SELECT end AS start,
    (SELECT end FROM DX12_API
        WHERE end > outer.end AND nameId == (SELECT id FROM StringIds
            WHERE value == "IDXGISwapChain::Present")
        ORDER BY end ASC LIMIT 1) AS end
FROM DX12_API AS outer
    WHERE nameId == (SELECT id FROM StringIds WHERE value == "IDXGISwapChain::Present")
ORDER BY end;
Number of frames with a duration of [X, X + 1] milliseconds.
SELECT
    CAST((end - start) / 1000000.0 AS INT) AS duration_ms,
    count(*)
FROM DX12_API_FPS
WHERE end IS NOT NULL
GROUP BY duration_ms
ORDER BY duration_ms;
# Python equivalent:
present_calls = dx12_api[dx12_api['function_name'] == 'IDXGISwapChain::Present']
present_calls = present_calls.sort_values('end')

frame_durations = []
for i in range(len(present_calls) - 1):
    duration = present_calls.iloc[i+1]['end'] - present_calls.iloc[i]['end']
    duration_ms = duration / 1000000.0  # Convert to milliseconds
    frame_durations.append(int(duration_ms))

# Create histogram
histogram = pd.Series(frame_durations).value_counts().sort_index()
Results:
duration_ms  count(*)
-----------  ----------
3            1
4            2
5            7
6            153
7            19
8            116
9            16
10           8
11           2
12           2
13           1
14           4
16           3
17           2
18           1
GPU Context Switch Events Enumeration
Goal: Track GPU context switches to understand GPU scheduling behavior and identify context switch patterns.
What the code does: Filters GPU context switch events to show only BEGIN (tag=8) and END (tag=7) events, which mark the boundaries of GPU context execution periods.
GPU Context Switch Event Tags: - 7: END events (context execution ends) - 8: BEGIN events (context execution begins)
GPU context duration is between first BEGIN and a matching END event.
SELECT (CASE tag WHEN 8 THEN "BEGIN" WHEN 7 THEN "END" END) AS tag,
    globalPid / 0x1000000 % 0x1000000 AS PID,
    vmId, seqNo, contextId, timestamp, gpuId FROM GPU_CONTEXT_SWITCH_EVENTS
WHERE tag in (7, 8) ORDER BY seqNo LIMIT 10;
Results:
tag         PID         vmId        seqNo       contextId   timestamp   gpuId
----------  ----------  ----------  ----------  ----------  ----------  ----------
BEGIN       23371       0           0           1048578     56759171    0
BEGIN       23371       0           1           1048578     56927765    0
BEGIN       23371       0           3           1048578     63799379    0
END         23371       0           4           1048578     63918806    0
BEGIN       19397       0           5           1048577     64014692    0
BEGIN       19397       0           6           1048577     64250369    0
BEGIN       19397       0           8           1048577     1918310004  0
END         19397       0           9           1048577     1918521098  0
BEGIN       19397       0           10          1048577     2024164744  0
BEGIN       19397       0           11          1048577     2024358650  0
Resolve NVTX Category Name
Goal: Decode NVTX category names for NVTX markers and ranges to make the profiling data more human-readable.
What the code does: Joins NVTX events with their category definitions to resolve category IDs into meaningful category names, making it easier to understand the purpose of different NVTX annotations.
NVTX Event Types:
33: Category definition events (define new categories)
34: Mark events (instantaneous markers)
59: Push/Pop range events (nested ranges)
60: Start/End range events (paired ranges)
The example demonstrates how to resolve NVTX category name for NVTX marks and ranges.
WITH
  event AS (
    SELECT *
    FROM NVTX_EVENTS
    WHERE eventType IN (34, 59, 60) -- mark, push/pop, start/end
  ),
  category AS (
    SELECT
      category,
      domainId,
      text AS categoryName
    FROM NVTX_EVENTS
    WHERE eventType == 33 -- category definition events
  )
SELECT
  start,
  end,
  globalTid,
  eventType,
  domainId,
  category,
  categoryName,
  text
FROM event JOIN category USING (category, domainId)
ORDER BY start;
Results:
start       end         globalTid        eventType   domainId    category    categoryName               text
----------  ----------  ---------------  ----------  ----------  ----------  -------------------------  ----------------
18281150    18311960    281534938484214  59          0           1           FirstCategoryUnderDefault  Push Pop Range A
18288187    18306674    281534938484214  59          0           2           SecondCategoryUnderDefaul  Push Pop Range B
18294247                281534938484214  34          0           1           FirstCategoryUnderDefault  Mark A
18300034                281534938484214  34          0           2           SecondCategoryUnderDefaul  Mark B
18345546    18372595    281534938484214  60          1           1           FirstCategoryUnderMyDomai  Start End Range
18352924    18378342    281534938484214  60          1           2           SecondCategoryUnderMyDoma  Start End Range
18359634                281534938484214  34          1           1           FirstCategoryUnderMyDomai  Mark A
18365448                281534938484214  34          1           2           SecondCategoryUnderMyDoma  Mark B
Rename CUDA Kernels with NVTX
Goal: Associate CUDA kernels with their surrounding NVTX ranges to provide more meaningful names and context for kernel analysis.
What the code does: 1. Finds the innermost NVTX push-pop range that encompasses each CUDA kernel launch 2. Maps the NVTX range text to the corresponding kernel execution 3. Enables analysis of kernels by their logical function rather than just their technical names
The example demonstrates how to map innermost NVTX push-pop range to a matching CUDA kernel run.
ALTER TABLE CUPTI_ACTIVITY_KIND_KERNEL ADD COLUMN nvtxRange TEXT;
CREATE INDEX nvtx_start ON NVTX_EVENTS (start);


UPDATE CUPTI_ACTIVITY_KIND_KERNEL SET nvtxRange = (
    SELECT NVTX_EVENTS.text
    FROM NVTX_EVENTS JOIN CUPTI_ACTIVITY_KIND_RUNTIME ON
        NVTX_EVENTS.eventType == 59 AND
        NVTX_EVENTS.globalTid == CUPTI_ACTIVITY_KIND_RUNTIME.globalTid AND
        NVTX_EVENTS.start <= CUPTI_ACTIVITY_KIND_RUNTIME.start AND
        NVTX_EVENTS.end >= CUPTI_ACTIVITY_KIND_RUNTIME.end
    WHERE
        CUPTI_ACTIVITY_KIND_KERNEL.correlationId == CUPTI_ACTIVITY_KIND_RUNTIME.correlationId
    ORDER BY NVTX_EVENTS.start DESC LIMIT 1
);

SELECT start, end, globalPid, StringIds.value as shortName, nvtxRange
FROM CUPTI_ACTIVITY_KIND_KERNEL JOIN StringIds ON shortName == id
ORDER BY start LIMIT 6;
# Python equivalent:
def find_innermost_nvtx_range(kernel_start, kernel_end, nvtx_ranges):
    # Find NVTX ranges that completely contain the kernel
    containing_ranges = []
    for nvtx in nvtx_ranges:
        if nvtx['start'] <= kernel_start and nvtx['end'] >= kernel_end:
            containing_ranges.append(nvtx)

    # Return the innermost (latest starting) range
    if containing_ranges:
        return max(containing_ranges, key=lambda x: x['start'])['text']
    return None
Results:
start       end         globalPid          shortName      nvtxRange
----------  ----------  -----------------  -------------  ----------
526545376   526676256   72057700439031808  MatrixMulCUDA
526899648   527030368   72057700439031808  MatrixMulCUDA  Add
527031648   527162272   72057700439031808  MatrixMulCUDA  Add
527163584   527294176   72057700439031808  MatrixMulCUDA  My Kernel
527296160   527426592   72057700439031808  MatrixMulCUDA  My Range
527428096   527558656   72057700439031808  MatrixMulCUDA
Select CUDA Calls With Backtraces
Goal: Analyze CUDA API calls along with their call stacks to understand the application code paths that lead to CUDA API usage.
What the code does: Joins CUDA runtime API calls with their associated call chains to show the complete stack trace for each CUDA call, helping identify where in the application CUDA calls originate.
ALTER TABLE CUPTI_ACTIVITY_KIND_RUNTIME ADD COLUMN name TEXT;
UPDATE CUPTI_ACTIVITY_KIND_RUNTIME SET name = (SELECT value FROM StringIds WHERE CUPTI_ACTIVITY_KIND_RUNTIME.nameId = StringIds.id);

ALTER TABLE CUDA_CALLCHAINS ADD COLUMN symbolName TEXT;
UPDATE CUDA_CALLCHAINS SET symbolName = (SELECT value FROM StringIds WHERE symbol = StringIds.id);

SELECT globalTid % 0x1000000 AS TID,
    start, end, name, callchainId, stackDepth, symbolName
FROM CUDA_CALLCHAINS JOIN CUPTI_ACTIVITY_KIND_RUNTIME ON callchainId == CUDA_CALLCHAINS.id
ORDER BY callchainId, stackDepth LIMIT 11;
Results:
TID         start       end         name           callchainId  stackDepth  symbolName
----------  ----------  ----------  -------------  -----------  ----------  --------------
11928       168976467   169077826   cuMemAlloc_v2  1            0           0x7f13c44f02ab
11928       168976467   169077826   cuMemAlloc_v2  1            1           0x7f13c44f0b8f
11928       168976467   169077826   cuMemAlloc_v2  1            2           0x7f13c44f3719
11928       168976467   169077826   cuMemAlloc_v2  1            3           cuMemAlloc_v2
11928       168976467   169077826   cuMemAlloc_v2  1            4           cudart::driver
11928       168976467   169077826   cuMemAlloc_v2  1            5           cudart::cudaAp
11928       168976467   169077826   cuMemAlloc_v2  1            6           cudaMalloc
11928       168976467   169077826   cuMemAlloc_v2  1            7           cudaError cuda
11928       168976467   169077826   cuMemAlloc_v2  1            8           main
11928       168976467   169077826   cuMemAlloc_v2  1            9           __libc_start_m
11928       168976467   169077826   cuMemAlloc_v2  1            10          _start
SLI Peer-to-Peer Query
Goal: Filter and analyze SLI (Scalable Link Interface) peer-to-peer memory transfers between GPUs based on size, timing, and other criteria.
What the code does: Demonstrates how to query SLI P2P events with filtering conditions on resource size, time range, and sorting by transfer size to identify significant GPU-to-GPU transfers.
SLI P2P Event Classes: - 62: Peer-to-peer transfer events between GPUs
The example demonstrates how to query SLI Peer-to-Peer events with resource size greater than value and within a time range sorted by resource size descending.
SELECT *
FROM SLI_P2P
WHERE resourceSize < 98304 AND start > 1568063100 AND end < 1579468901
ORDER BY resourceSize DESC;
# Python equivalent:
filtered_transfers = sli_p2p[
    (sli_p2p['resourceSize'] < 98304) &
    (sli_p2p['start'] > 1568063100) &
    (sli_p2p['end'] < 1579468901)
].sort_values('resourceSize', ascending=False)
Results:
start       end         eventClass  globalTid          gpu         frameId     transferSkipped  srcGpu      dstGpu      numSubResources  resourceSize  subResourceIdx  smplWidth   smplHeight  smplDepth   bytesPerElement  dxgiFormat  logSurfaceNames  transferInfo  isEarlyPushManagedByNvApi  useAsyncP2pForResolve  transferFuncName  regimeName  debugName   bindType
----------  ----------  ----------  -----------------  ----------  ----------  ---------------  ----------  ----------  ---------------  ------------  --------------  ----------  ----------  ----------  ---------------  ----------  ---------------  ------------  -------------------------  ---------------------  ----------------  ----------  ----------  ----------
1570351100  1570351101  62          72057698056667136  0           771         0                256         512         1                1048576       0               256         256         1           16               2                            3             0                          0
1570379300  1570379301  62          72057698056667136  0           771         0                256         512         1                1048576       0               64          64          64          4                31                           3             0                          0
1572316400  1572316401  62          72057698056667136  0           773         0                256         512         1                1048576       0               256         256         1           16               2                            3             0                          0
1572345400  1572345401  62          72057698056667136  0           773         0                256         512         1                1048576       0               64          64          64          4                31                           3             0                          0
1574734300  1574734301  62          72057698056667136  0           775         0                256         512         1                1048576       0               256         256         1           16               2                            3             0                          0
1574767200  1574767201  62          72057698056667136  0           775         0                256         512         1                1048576       0               64          64          64          4                31                           3             0                          0
Generic Events
Goal: Analyze system-level events captured through generic event collection (like ftrace) to understand system behavior and syscall patterns.
What the code does: Demonstrates how to query generic events stored in JSON format, specifically showing how to create a histogram of syscall usage by process ID. The query uses a subquery to find the specific event type ID for “raw_syscalls:sys_enter” events, then counts occurrences by process ID.
Syscall usage histogram by PID:
SELECT json_extract(data, '$.common_pid') AS PID, count(*) AS total
FROM GENERIC_EVENTS WHERE PID IS NOT NULL AND typeId = (
  SELECT typeId FROM GENERIC_EVENT_TYPES
  WHERE json_extract(data, '$.Name') = "raw_syscalls:sys_enter")
GROUP BY PID
ORDER BY total DESC
LIMIT 10;
# Python equivalent:
import json

# Filter for syscall enter events
syscall_events = []
for event in generic_events:
    data = json.loads(event['data'])
    if 'common_pid' in data:
        syscall_events.append(data['common_pid'])

# Count syscalls by PID
pid_counts = pd.Series(syscall_events).value_counts().head(10)
Results:
PID         total
----------  ----------
5551        32811
9680        3988
4328        1477
9564        1246
4376        1204
4377        1167
4357        656
4355        655
4356        640
4354        633
Fetching Generic Events in JSON Format
Goal: Export generic events, types, and sources in JSON format for external analysis tools or custom processing pipelines.
What the code does: Constructs JSON objects from the database tables containing generic event data, enabling export to JSON Lines format for further processing with external tools.
Text and JSON export modes don’t include generic events. Use the below queries (without the LIMIT clause) to extract JSON lines representation of generic events, types, and sources.
SELECT json_insert('{}',
    '$.sourceId', sourceId,
    '$.data', json(data)
)
FROM GENERIC_EVENT_SOURCES LIMIT 2;

SELECT json_insert('{}',
    '$.typeId', typeId,
    '$.sourceId', sourceId,
    '$.data', json(data)
)
FROM GENERIC_EVENT_TYPES LIMIT 2;

SELECT json_insert('{}',
    '$.rawTimestamp', rawTimestamp,
    '$.timestamp', timestamp,
    '$.typeId', typeId,
    '$.data', json(data)
)
FROM GENERIC_EVENTS LIMIT 2;
Results:
json_insert('{}',
    '$.sourceId', sourceId,
    '$.data', json(data)
)
---------------------------------------------------------------------------------------------------------------
{"sourceId":72057602627862528,"data":{"Name":"FTrace","TimeSource":"ClockMonotonicRaw","SourceGroup":"FTrace"}}
json_insert('{}',
    '$.typeId', typeId,
    '$.sourceId', sourceId,
    '$.data', json(data)
)
--------------------------------------------------------------------------------------------------------------------
{"typeId":72057602627862547,"sourceId":72057602627862528,"data":{"Name":"raw_syscalls:sys_enter","Format":"\"NR %ld (%lx, %lx, %lx, %lx, %lx, %lx)\", REC->id, REC->args[0], REC->args[1], REC->args[2], REC->args[3], REC->args[4], REC->args[5]","Fields":[{"Name":"common_pid","Prefix":"int","Suffix":""},{"Name":"id","Prefix":"long","S
{"typeId":72057602627862670,"sourceId":72057602627862528,"data":{"Name":"irq:irq_handler_entry","Format":"\"irq=%d name=%s\", REC->irq, __get_str(name)","Fields":[{"Name":"common_pid","Prefix":"int","Suffix":""},{"Name":"irq","Prefix":"int","Suffix":""},{"Name":"name","Prefix":"__data_loc char[]","Suffix":""},{"Name":"common_type",
json_insert('{}',
    '$.rawTimestamp', rawTimestamp,
    '$.timestamp', timestamp,
    '$.typeId', typeId,
    '$.data', json(data)
)
--------------------------------------------------------------------------------------------------------------------
{"rawTimestamp":1183694330725221,"timestamp":6236683,"typeId":72057602627862670,"data":{"common_pid":"0","irq":"66","name":"327696","common_type":"142","common_flags":"9","common_preempt_count":"0"}}
{"rawTimestamp":1183694333695687,"timestamp":9207149,"typeId":72057602627862670,"data":{"common_pid":"0","irq":"66","name":"327696","common_type":"142","common_flags":"9","common_preempt_count":"0"}}
Arrow#
The Arrow type exported file, .arrows, uses the IPC stream format to store all tables in a
file. The tables can be read by opening the file as an arrow stream. For example one can use the
open_stream function from the arrow python package. For more information on the interfaces that
can be used to read an IPC stream file, please refer to the Apache Arrow documentation
[1, 2].
The name of each table is included in the schema metadata. Thus, while reading each table, the user
can extract the table title from the metadata. The table name metadata field has the key
table_name. The titles of all the available tables can be found in section
SQLite Schema Reference.
A sample function that reads all Arrow tables in a .arrows file is provided below in Python:
import pyarrow as pa

def read_tables(arrow_file):
    with pa.input_stream(arrow_file) as source:
        while source.tell() < source.size():
            try:
                yield pa.ipc.open_stream(arrow_file).read_all()
            except:
                continue
The Arrow directory exporter type, _arwdir, will create a directory with one arrow file per
table/dataset.
JSON Lines#
In the JSON Lines export format (JSON Lines Documentation), events and other report data (such as strings and processes) are serialized into JSON objects, with each object written to a new line.
Output layout:
{"id":0,"table":"StringIds","value":"[Unknown]"}
{"globalPid":284057963331584,"name":"chrome","pid":153958,"table":"PROCESSES"}
{"globalTid":281523009882942,"nameId":442,"priority":20,"table":"ThreadNames"}
{"name":"COLLECT_GPU_CTX_SW_TRACE","table":"META_DATA_CAPTURE","value":"false"}
...
Note the presence of the “table” field in each JSON object. This field allows readers to identify
the type of the event and corresponds to the table name in the sqlite export.