User Guide#
NVIDIA Nsight Systems user guide
Preparing Your Application for Profiling#
Nsight Systems does not require any application changes to enable profiling; however, by making some simple modifications and additions, you can greatly increase the effectiveness of your profiling and the usability of the resulting data.
Focused Profiling#
By default, Nsight Systems collects a profile over the entire run of your application. But, as explained below, you typically only want to profile the region(s) of your application containing some or all of the performance-critical code. Limiting profiling to performance-critical regions reduces the amount of data that both you and the tools must process, and focuses attention on the code where optimization will result in the greatest performance gains.
There are several common situations where limiting profiling to a region of the application is helpful.
The application is a test harness wrapping all or part of your algorithm. The test harness may initial the data, run the algorithm cold, and then check the results for correctness. Using a test harness is a common and productive way to quickly iterate and test algorithm changes. When profiling, you will want to collect profile data for the functionality, but not for the test harness initialization and validation.
The application operates in phases, where a different set of algorithms is active in each phase. When the performance of each phase of the application can be optimized independently of the others, you want to profile each phase separately to focus your optimization efforts.
The application contains algorithms that operate over a large number of iterations, but the performance of the algorithm does not vary significantly across those iterations. In this case you can collect profile data from a subset of the iterations.
Nsight Systems supports two methods of code annotations to limit profile duration.
To limit profiling to a region of your CUDA application, CUDA provides functions to start and stop data collection. cudaProfilerStart() is used to start profiling and cudaProfilerStop() is used to stop profiling. To use these functions you must include cuda_profiler_api.h.
To limit profiling to a region of CPU activity, you can use the NVIDIA Tools Extension API (NVTX) to set range(s) for profiling.
Marking and Labeling Regions#
To understand what the application’s CPU threads are doing beyond CUDA function calls, you can use the NVIDIA Tools Extension API (NVTX). When you add NVTX markers and ranges to your application, the Timeline View shows when your CPU threads are executing within those regions. The Timeline View also projects these ranges onto the GPU timeline, allowing you to see what GPU activity was launched within each CPU range.
Using custom names for CPU and CUDA resources can also improve understanding of application behavior, especially for applications that have many host threads, devices, contexts, or streams. You can use the NVIDIA Tools Extension API to assign custom names for your CPU and GPU resources. Your custom names will then be displayed in the Timeline View.
Profiling from the CLI#
Installing the CLI on Your Target#
The Nsight Systems CLI provides a simple interface to collect on a target without using the GUI. The collected data can then be copied to any system and analyzed later.
The CLI is distributed in the Target directory of the standard Nsight Systems download package.
If you wish to run the CLI without root (recommended mode), you will want to install in a directory where you have full access.
Note
You must run the CLI on Windows as administrator.
Command Line Options#
The Nsight Systems command lines can have one of two forms:
nsys [global_option]
or
nsys [command_switch][optional command_switch_options][application] [optional application_options]
All command line options are case-sensitive. For command switch options, when short options are used, the parameters should follow the switch after a space; e.g., -s process-tree. When long options are used, the switch should be followed by an equal sign and then the parameter(s); e.g., --sample=process-tree.
For this version of Nsight Systems, if you launch a process from the command line to begin analysis, the launched process will be terminated when collection is complete, including runs with --duration set, unless the user specifies the --kill none option (details below). The exception is that if the user uses NVTX, cudaProfilerStart/Stop, or hotkeys to control the duration, the application will continue unless --kill is set.
The Nsight Systems CLI supports concurrent analysis by using sessions. Each Nsight Systems session is defined by a sequence of CLI commands that define one or more collections (e.g., when and what data is collected). A session begins with either a start, launch, or profile command. A session ends with a shutdown command, when a profile command terminates, or, if requested, when all the process tree(s) launched in the session exit. Multiple sessions can run concurrently on the same system.
CLI Global Options#
Short |
Long |
Description |
|---|---|---|
-h |
|
Help message providing information about available command switches and their options. |
-v |
|
Output Nsight Systems CLI version information. |
CLI Command Switches#
The Nsight Systems command line interface can be used in two modes. You may
launch your application and begin analysis with options specified to the
nsys profile command. Alternatively, you can control the launch of an
application and data collection using interactive CLI commands.
Command |
Description |
|---|---|
analyze |
Post process existing Nsight Systems result, either in .nsys-rep or SQLite format, to generate expert systems report. |
export |
Generates an export file from an existing |
finalize |
Generate report files from deferred collections. When |
launch |
In interactive mode, launches an application in an environment that supports the requested options. The launch command can be executed before or after a start command. |
profile |
A fully formed profiling description requiring and accepting no further input. The command switch options used (see below table) determine when the collection starts, stops, what collectors are used (e.g., API trace, IP sampling, etc.), what processes are monitored, etc. |
recipe |
Post process one or more existing Nsight Systems results to generate statistical information and create various plots. See the Post-Collection Analysis Guide for details. |
sessions |
Gives information about all sessions running on the system. |
shutdown |
Disconnects the CLI process from the launched application and forces the CLI process to exit. If a collection is pending or active, it is canceled. |
start |
Starts a collection in interactive mode. The start command can be executed before or after a launch command. |
stats |
Post process existing Nsight Systems result, either in |
status |
Reports on the status of a CLI-based collection or the suitability of the profiling environment. |
stop |
Stops a collection that was started in interactive mode. When executed, all active collections stop, the CLI process terminates but the application continues running. |
CLI Profile Command Switch Options#
After choosing the profile command switch, the following options are available. Usage:
nsys [global-options] profile [options] [application] [application-arguments]
Option |
Available Parameters (default in bold) |
Switch Description |
|
|---|---|---|---|
|
none, tegra-accelerators |
Collect other accelerators workload trace from the hardware engine units. Available in Nsight Systems Embedded Platforms Edition only. This option will also enable collection of hardware accelerator related ftrace events. |
|
|
< command > |
Execute a command after the collection starts. The command will be reused for subsequent starts until
it is reset or cleared. Pass the option with no value to clear the previously set command. The executed
process receives the following environment variables: Note NSYS_SESSION_NAME - the current session name NSYS_CALLBACK_NAME - the current callback name Note Available on x86 Linux only. |
|
|
< command > |
Execute a command after the report is ready. The command is reused for subsequent stops until it is
reset or cleared. Pass the option with no value to clear the previously set command. The executed
process receives the following environment variables: Note NSYS_SESSION_NAME - the current session name NSYS_CALLBACK_NAME - the current callback name NSYS_REPORT_PATH - the path to the generated report file Note Available on x86 Linux only. |
|
|
true, false |
Derive report file name from collected data using details of the profiled graphics application. Format:
|
|
|
auto, fp, lbr, dwarf, none |
Select the backtrace method to use while sampling. The option |
|
|
none, cudaProfilerApi, hotkey, nvtx |
When Note Hotkey works for graphic applications only. |
|
|
none, stop, stop-shutdown, repeat[:N][:mode], repeat-shutdown:N [:mode] |
Default is stop-shutdown. Specify the desired behavior when a capture range ends. Applicable only when
used along with the
If |
|
|
true, false |
Collect clock frequency changes. Available only in Nsight Systems Embedded Platforms Edition and Arm server (SBSA) platforms. |
|
|
< filename >, none |
Open a file that contains profile switches and parse the switches. Note additional switches on the command line will override switches in the file. This flag can be specified more than once. |
|
|
0x16, 0x17, …, none |
Collect per-cluster Uncore PMU counters. Multiple values can be selected, separated by commas only (no
spaces). Use the |
|
|
0x11,0x13,…, none |
Collect per-core PMU counters. Multiple values can be selected, separated by commas only (no spaces).
Use the |
|
|
‘help’ or the end users selected events in the format ‘x,y’, 2 |
Default is Instructions Retired. Select the CPU Core events to sample. Use the
|
|
|
0,1,2,…, none |
Collect metrics on the CPU core. Multiple values can be selected, separated by commas only (no spaces).
Use the Note Only available on Grace. |
|
|
‘help’ or a comma separated list |
Choose the CPU core events and metrics desired. Use name or alias. Not available on Nsight Systems Embedded Platforms Edition. |
|
|
0x2a,0x2c,…, none |
Collect per-socket Uncore PMU counters. Multiple values can be selected, separated by commas only (no
spaces). Use the |
|
|
‘help’ or the users selected events as ‘x,y’, none |
Select the Uncore CPU Socket events to sample. Use the |
|
|
0,1,2,…, none |
Collect Uncore metrics on the CPU socket. Multiple values can be selected, separated by commas only (no
spaces). Use the Note Only available on Grace. |
|
|
process-tree, system-wide, none |
Trace OS thread scheduling activity. Select Note If the |
|
|
auto, true, false |
Trace CUDA Event completion on the device side, and get better correlation support among CUDA Event
APIs. Applicable only when CUDA tracing is enabled. “CUDA Event” refers to the synchronization
mechanism (cudaEventRecord, cudaStreamWaitEvent etc.). Enabling this feature may increase runtime
overhead and the likelihood of false dependencies across CUDA Streams, similar to CUDA Event’s timing
functionality when cudaEventDisableTiming is not disabled. |
|
|
milliseconds |
Set the interval when buffered CUDA data is automatically saved to storage in milliseconds. The CUDA
data buffer saves may cause profiler overhead. Buffer save behavior can be controlled with this switch.
If the CUDA flush interval is set to 0 on systems running CUDA 11.0 or newer, buffers are saved when
they fill. If a flush interval is set to a non-zero value on such systems, buffers are saved only when
the flush interval expires. If a flush interval is set and the profiler runs out of available buffers
before the flush interval expires, additional buffers will be allocated as needed. In this case,
setting a flush interval can reduce buffer save overhead but increase memory use by the profiler. If
the flush interval is set to 0 on systems running older versions of CUDA, buffers are saved at the end
of the collection. If the profiler runs out of available buffers, additional buffers are allocated as
needed. If a flush interval is set to a non-zero value on such systems, buffers are saved when the
flush interval expires. A |
|
|
graph, node |
If |
|
|
true, false |
Track the GPU memory usage by CUDA kernels. Applicable only when CUDA tracing is enabled. Note This feature may cause significant runtime overhead. |
|
|
true, false |
By default, Nsight Systems skips CUDA APIs that are not critical for performance analysis. If enabled, Nsight Systems will trace all CUDA APIs, including those less relevant to performance analysis. Note This feature may cause significant runtime overhead. |
|
|
process-tree, system-wide |
Select Note Only CUDA processes launched by the same user after the collection start will be traced. |
|
|
true, false |
This switch tracks the page faults that occur when CPU code tries to access a memory page that resides on the device. Note that this feature may cause significant runtime overhead. Not available on Nsight Systems Embedded Platforms Edition. |
|
|
true, false |
This switch tracks the page faults that occur when GPU code tries to access a memory page that resides on the host. Note that this feature may cause significant runtime overhead. Not available on Nsight Systems Embedded Platforms Edition. |
|
|
all, none, kernel, memory, sync, other |
When tracing CUDA APIs, enable the collection of a backtrace when a CUDA API is invoked. Significant
runtime overhead may occur. Values may be combined using Note CPU sampling must be enabled. |
|
|
<directory paths> |
A colon-separated list of directories with symbol files. Available only on Linux and QNX devices. |
|
|
< seconds >, 0 |
Collection start delay in seconds. |
|
|
< seconds > |
Collection duration in seconds; duration must be greater than zero. The launched process will be
terminated when the specified profiling duration expires unless the user specifies the |
|
|
60 <= integer |
Stop the recording session after this many frames have been captured. When it is selected, command cannot include any other stop options. If not specified, the default is disabled. |
|
|
true, false |
Nsight Systems trace initialization involves creating and discarding a D3D device. Enabling this flag,
|
|
|
true, false, batch, individual, none |
If individual or true, trace each DX12 workload’s GPU activity individually. If batch, trace DX12
workloads’ GPU activity in |
|
|
true, false |
If true, trace wait calls that block on fences for DX12. Note that this switch is applicable only when
|
|
|
<filepath kernel_symbols.json> |
XHV sampling config file. Available in Nsight Systems Embedded Platforms Edition only. |
|
|
A=B |
Set environment variable(s) for the application process to be launched. Environment variables should be defined as A=B. Multiple environment variables can be specified as A=B,C=D. |
|
|
|
Use the specified plugin. The option can be specified multiple times to enable multiple plugins.
Plugin arguments are separated by commas only (no spaces). On non-Windows platforms, commas can be
escaped with a backslash |
|
|
“<name>,<guid>”, or path to JSON file |
Add custom ETW trace provider(s). If you want to specify more attributes than Name and GUID, provide a JSON configuration file as as outlined below. This switch can be used multiple times to add multiple providers. Note: Only available for Windows targets. |
|
|
system-wide, none |
Use the |
|
|
Integers from 1 to 1000 milliseconds, 10 |
The interval between each event sample collection. Minimum event sampling interval is 1 mSec. Maximum event sampling interval is 1000 mSec. Not available in Nsight Systems Embedded Platforms Edition. |
|
|
Time in milliseconds, 2000 |
The interval sampling an event group before switching to the next group when using event multiplexing.
is set with the |
|
|
arrow, arrowdir, hdf, jsonlines, sqlite, parquetdir, text, none |
Create additional output file(s) based on the data collected. This option can be given more than once. Warning If the collection captures a large amount of data, creating the export file may take several minutes to complete. |
|
|
true, false |
If |
|
|
true, false |
If true, overwrite all existing result files with same output filename (.nsys-rep, .sqlite, .h5, .txt, .jsonl, .arrows, _arwdir, _pqtdir). |
|
|
Collect ftrace events. Argument should list events to collect as: subsystem1/event1,subsystem2/event2. Requires root. No ftrace events are collected by default. |
||
|
Skip initial ftrace setup and collect already configured events. Default resets the ftrace configuration. |
||
|
< directory path > |
Specify a directory containing GDS (GPUDirect Storage) libraries (must contain libcufile.so). Use this
argument if the GDS libraries are located in a different path than the default. This argument is used
together with |
|
|
true, false |
When true, collect GDS (GPUDirect Storage) metrics. This option is only supported on Linux x64 and SBSA targets. |
|
|
GPU ID, help, all, none |
Collect GPU Metrics from specified devices. Determine GPU IDs by using |
|
|
integer, 10000 |
Specify GPU Metrics sampling frequency. Minimum supported frequency is 10 (Hz). Maximum supported frequency is 200000 (Hz). |
|
|
alias, file:<file name> |
Specify metric set for GPU Metrics. The argument must be one of the aliases reported by
|
|
|
help, <id1,id2,…>, all, none |
Analyze video devices. |
|
|
true, false |
Trace GPU context switches. See the GPU Context Switch topic for details. |
|
|
<tag>, none |
Print the help message. The option can take one optional argument that will be used as a tag. If a tag is provided, only options relevant to the tag will be printed. |
|
|
‘F1’ to ‘F12’, F12 |
Hotkey to trigger the profiling session. Note that this switch is applicable only when
|
|
|
<NIC names>, none |
A comma-separated list of NIC names. The NICs which |
|
|
<file paths>, none |
A comma-separated list of file paths. Paths of an existing ibdiagnet db_csv files, containing networks
information data. Nsight Systems will read the networks’ information from these files. Don’t use |
|
|
<directory path>, none |
Sets the path of a directory into which ibdiagnet network discovery data will be written. Use this
option together with the |
|
|
<IB switch GUIDs>, none |
The |
|
|
<NIC name> |
|
|
|
1 <= integer <= 100, 50 |
Set the percent of InfiniBand switch congestion events to be collected using the
|
|
|
1 < integer <= 1023, 75 |
The |
|
|
<IB switch GUIDs> |
Add comma-separated list of InfiniBand switch GUIDs by using the |
|
|
<NIC name> |
|
|
|
true, false |
When true, the current environment variables and the tool’s environment variables will be specified for the launched process. When false, only the tool’s environment variables will be specified for the launched process. |
|
|
true, false |
When false, Nsight Systems will collect the environment variables of the launched process. When true, the environment variables will not be collected. Note Available on Linux only. |
|
|
true, false |
Use detours for injection. If false, process injection will be performed by windows hooks which allows it to bypass anti-cheat software. |
|
|
true, false |
Trace Interrupt Service Routines (ISRs) and Deferred Procedure Calls (DPCs). Requires administrative privileges. Available only on Windows devices. |
|
|
none, sigkill, sigterm, signal number |
Send signal to the target application’s process group. Can be used with |
|
|
openmpi, mpich |
When using |
|
|
none, all, api, api-coll, api-group, api-p2p, ce-batch, ce-coll, ce-sync, coll, default, rt, gpu, group, kernel-launch, p2p, proxy-counters, proxy-op, proxy-step |
Comma-separated list of NCCL events to record, takes priority over |
|
|
lf, hf, none |
Collect metrics from NIC/HCA devices. The ‘hf’ option collects high frequency metrics but lacks RoCE, IPoIB, and ‘Send Waits’ metrics. The ‘lf’ option collects all available metrics but at a lower sampling frequency. The deprecated ‘true’ option is accepted for backwards compatibility and corresponds to ‘lf’. The ‘true’ option will be removed in a future release. System scope. Not available on Nsight Systems Embedded Platforms Edition. |
|
|
range@domain, range, range@*, none |
Specify NVTX range and domain to trigger the profiling session. This option is applicable only when
used along with |
|
|
default, <domain_names> |
Choose to exclude NVTX events from a comma separated list of domains. Note Only one of |
|
|
default, <domain_names> |
Choose to only include NVTX events from a comma separated list of domains. Note Only one of |
|
|
true, false |
If true, trace the OpenGL workloads’ GPU activity. Note that this switch is applicable only when
|
|
|
‘help’ or the end users selected events in the format ‘x,y’ |
Select the OS events to sample. Use the |
|
|
integer, 24 |
Set the depth for the backtraces collected for OS runtime libraries calls. |
|
|
integer, 6144 |
The |
|
|
nanoseconds, 80000 |
The |
|
|
< nanoseconds >, 1000 ns |
Set the duration, in nanoseconds, that Operating System Runtime (osrt) APIs must execute before they are traced. Values significantly less than 1000 may cause significant overhead and result in extremely large result files. Note This setting is ignored for APIs that interact with files when |
|
|
true, false |
Collect file access data when tracing Operating System Runtime (osrt) APIs that interact with files. Note When this setting is set to true the |
|
|
< filename >, report# |
Set the report file name. Any |
|
|
main, system-wide process-tree, |
Select which process(es) to trace. Available in Nsight Systems Embedded Platforms Edition only. Nsight Systems Workstation Edition will always trace system-wide in this version of the tool. |
|
|
cuda, none |
Collect Python backtrace event when tracing the selected API’s trigger. This option is supported
on Arm server (SBSA) platforms and x86 Linux targets. Note: tracing and backtraces of the selected API
and CPU sampling must be enabled. For example, |
|
|
<json_file> |
Specify the path to the JSON file containing the requested NVTX annotations. |
|
|
true, false |
Collect Python backtrace sampling events. This option is supported on Arm server (SBSA) platforms, x86 Linux and Windows targets. Note: When profiling Python-only workflows, consider disabling the CPU sampling option to reduce overhead. |
|
|
1 < integers < 2000, 1000 |
The |
|
|
autograd-nvtx, autograd-shapes-nvtx, functions-trace, functions-trace, functions-trace- shapes, none |
Enable automatic annotations of PyTorch functions. |
|
|
functions-trace, none |
Enable automatic annotations of Dask functions |
|
|
class/event,event, class/event:mode, class:mode,help, none |
Multiple values can be selected, separated by commas only (no spaces). See the
|
|
|
system,process,fast, wide, system:fast |
The |
|
|
true, false |
Resolve symbols of captured samples and backtraces. |
|
|
true, false |
Retain ETW files generated by the trace, merge and move the files to the output directory. |
|
|
< username >, none |
Run the target application as the specified username. If not specified, the target application will be run by the same user as Nsight Systems. Requires root privileges. Available for Linux targets only. |
|
|
process-tree, system-wide, xhv, xhv-system-wide, none |
Select how to collect CPU IP/backtrace samples. If Note
Note If set to |
|
|
integer <= 32, 1 |
The number of CPU IP samples collected for every CPU IP/backtrace sample collected. For example, if set to 4, on the fourth CPU IP sample collected, a backtrace will also be collected. Lower values increase the amount of data collected. Higher values can reduce collection overhead and reduce the number of CPU IP samples dropped. If DWARF backtraces are collected, the default is 4, otherwise the default is 1. This option is not available on Nsight Systems Embedded Platforms Edition or on non-Linux targets. |
|
|
100 < integers < 8000, 1000 |
Specify the sampling/backtracing frequency. The minimum supported frequency is 100 Hz. The maximum supported frequency is 8000 Hz. This option is supported only on QNX, Linux for Tegra, and Windows targets. |
|
|
integer |
Default is determined dynamically. The number of CPU Cycle events counted before a CPU instruction
pointer (IP) sample is collected. If configured, backtraces may also be collected. The smaller the
sampling period, the higher the sampling rate. Note that smaller sampling periods will increase
overhead and significantly increase the size of the result file(s). Requires the
|
|
|
integer |
Default is determined dynamically. The number of events counted before a CPU instruction pointer (IP) sample is collected. The event used to trigger the collection of a sample is determined dynamically. For example, on Intel based platforms, it will probably be “Reference Cycles” and on AMD platforms, “CPU Cycles”. If configured, backtraces may also be collected. The smaller the sampling period, the . higher the sampling rate Note that smaller sampling periods will increase overhead and significantly increase the size of the result file(s). This option is available only on Linux targets. |
|
|
timer, sched, perf, cuda |
Specify backtrace collection trigger. Multiple APIs can be selected, separated by commas only (no spaces). Available on Nsight Systems Embedded Platforms Edition targets only. |
|
|
[a-Z][0-9,a-Z,spaces] |
Default is profile-<id>-<application>. Name the session created by the command. Name must start with an
alphabetical character followed by printable or space characters. Any |
|
|
true, false |
If true, send the target process’s stdout and stderr streams to both the console and stdout/stderr files which are added to the report file. If false, only send the target process stdout and stderr streams to the stdout/stderr files which are added to the report file. |
|
|
true, false |
Collect SoC Metrics. Available in Nsight Systems Embedded Platforms Edition only. |
|
|
integer, 10000 |
Specify SoC Metrics sampling frequency. Minimum supported frequency is ‘100’ (Hz). Maximum supported frequency is ‘1000000’ (Hz). Available in Nsight Systems Embedded Platforms Edition only. |
|
|
alias, file:<file name> |
Specify metric set for SoC Metrics. The argument must be one of the aliases reported by
|
|
|
1 <= integer |
Start the recording session when the frame index reaches the frame number preceding the start frame index. Note when it is selected cannot include any other start options. If not specified, the default is disabled. |
|
|
true, false |
Delays collection indefinitely until the nsys start command is executed for this session.
Enabling this option overrides the |
|
|
true, false |
Generate summary statistics after the collection. Warning When set to true, an SQLite database will be created after the collection. If the collection captures a large amount of data, creating the database file may take several minutes to complete. |
|
|
true, false |
If true, stop collecting automatically when the launched process has exited or when the duration expires - whichever occurs first. If false, duration must be set and the collection stops only when the duration expires. Nsight Systems does not officially support runs longer than 5 minutes. |
|
|
process-tree, pid-namespace, none |
Collect system calls. The value defines the collection scope: |
|
|
cuda, opengl, nvtx, osrt, cuda-sw, cudnn, cublas, cusolver, cublas-verbose, cusparse-verbose, cudla, cudla-verbose, cusolver-verbose, dx11, dx12, openacc, dx11-annotations, dx12-annotations, opengl-annotations, openmp, mpi, nccl, tegra-accelerators, ucx, openxr, oshmem, openxr-annotations, python-gil, gds, s3, s3-verbose, wddm, vulkan-annotations, vulkan, nvvideo, none |
Select the API(s) to be traced. The osrt switch controls the OS runtime libraries tracing. Multiple
APIs can be selected, separated by commas only (no spaces). Since OpenACC and cuXXX APIs
are tightly linked with CUDA, selecting one of those APIs will automatically enable CUDA tracing.
cublas, cudla, cusparse and cusolver all have XXX-verbose options available.
Reflex SDK latency markers will be automatically collected when DX or vulkan API trace is enabled.
See information on Note cuDNN is not available on Windows target. Note The |
|
|
true, false |
If true, trace any child process after fork and before they call one of the exec functions. Beware, tracing in this interval relies on undefined behavior and might cause your application to crash or deadlock. This option is only available on Linux target platforms. |
|
|
true, false |
Collect vsync events. If collection of vsync events is enabled, display/display_scanline ftrace events will also be captured. Available in Nsight Systems Embedded Platforms Edition only. |
|
|
true, false, batch, ,none individual |
Default is individual. If individual or true, trace each Vulkan workload’s GPU activity individually.
If batch, trace Vulkan workloads’ GPU activity in |
|
|
primary, all |
If |
|
|
true, false |
If |
|
|
true, false |
If |
|
|
true, false |
If |
|
|
< filepath pct.json > |
Collect hypervisor trace. Available in Nsight Systems Embedded Platforms Edition only. |
|
|
all, none, core, sched, irq, trap |
Available in Nsight Systems Embedded Platforms Edition only. |
|
CLI Analyze Command Switch Options#
The nsys analyze command generates and outputs a report to the terminal
using expert system rules on existing results. Reports are generated from an
SQLite export of a .nsys-rep file. If a .nsys-rep file is specified,
Nsight Systems will look for an accompanying SQLite file and use it. If no
SQLite export file exists, one will be created.
After choosing the analyze command switch, the following options are
available. Usage:
nsys [global-options] analyze [options] [input-file]
Option |
Available Parameters (default in bold) |
Switch Description |
|---|---|---|
|
<tag>, |
Print the help message. The option can take one optional argument that will be used as a tag. If a tag is provided, only options relevant to the tag will be printed. |
|
column, table, csv, tsv, json, hdoc, htable, . |
Specify the output format. The special name “.” indicates the default format for the given output. The default format for console is column, while files and process outputs default to csv. This option may be used multiple times. Multiple formats may also be specified using a comma-separated list (<name[:args…][,name[:args…]…]>). See options available with each format at Available Export Formats . |
|
true, |
Force a re-export of the SQLite file from the specified report, even if an SQLite file already exists. |
|
true, |
Overwrite any existing output files. |
|
<format_name>, ALL,
|
With no argument, list a summary of the available output formats. If a format name is given, a more
detailed explanation of the format is displayed. If |
|
<rule_name>, ALL,
|
With no argument, list available rules with a short description. If a rule name is given, a more
detailed explanation of the rule is displayed. If |
|
|
Specify the output mechanism. There are three output mechanisms: print to console, output to file, or
output to command. This option may be used multiple times. Multiple outputs may also be specified using
a comma-separated list. If the given output name is “-”, the output will be displayed on the console.
If the output name starts with “@”, the output designates a command to run. The nsys command will be
executed and the analysis output will be piped into the command. Any other output is assumed to be the
base path and name for a file. If a file basename is given, the filename used will be:
<basename>_<analysis&args>.<output_format>. The default base (including path) is the name of the
SQLite file (as derived from the input file or |
|
Do not display verbose messages, only display errors. |
|
|
cuda_memcpy_async,
cuda_memcpy_sync,
cuda_memset_sync,
cuda_api_sync,
gpu_gaps,
gpu_time_util,
dx12_mem_ops, |
Specify the rule(s) to execute, including any arguments. This option may be used multiple times.
Multiple rules may also be specified using a comma-separated list. See
Expert Systems Analysis section and |
|
<file.sqlite> |
Specify the SQLite export filename. If this file exists, it will be used. If this file doesn’t exist
(or if |
|
nsec, usec, msec,
|
Set basic unit of time. The argument of the switch is matched by using the longest prefix matching.
This means that it is not necessary to write a whole word as the switch argument. It is similar to
passing a “:time=<unit>” argument to every formatter, although the formatter uses more strict naming
conventions. See |
CLI Export Command Switch Options#
After choosing the export command switch, the following options are available. Usage:
nsys [global-options] export [options] [nsys-rep-file]
Option |
Available Parameters (default in bold) |
Switch Description |
|---|---|---|
|
This option only applies to “directory of files” output formats with existing export files. If this option is given, an error will not be reported and the existing output files will not be over-written. |
|
|
true, false |
If true, overwrite all existing result files with same output filename (nsys-rep, SQLITE, HDF, TEXT, JSONLINES, ARROW, ARROWDIR, PARQUETDIR). |
|
<tag> |
Print the help message. The option can take one optional argument that will be used as a tag. If a tag is provided, only options relevant to the tag will be printed. |
|
true, false |
Controls if NVTX extended payloads are exported as binary data. This option affects SQLite, Arrow, and Arrow/Parquet directory exports only. |
|
true, false |
Controls if repetitive JSON blocks are included in an export or not. Some events contain dynamically defined payloads. These payloads are often exported as JSON blocks to preserve their free-form structure. Unfortunately, blocks of JSON text are not an efficient way to represent data, and can cause the export files to become quite large. To address this, some classes of events (such as GENERIC_EVENT data) were extended to export payload data in the native export format. For those events that have an export-native representation, this flag enables or disables the export of the equivalent JSON blocks. Note This does not suppress all JSON output. Some tables, like``META_DATA_*`` tables and
Note This flag has nothing to do with JSON Lines exports, (i.e., |
|
true, false |
Controls if table creation is lazy or not. When true, a table will only be created when it contains data. This option will be deprecated in the future, and all exports will be non-lazy. This affects SQLite, HDF5, Arrow, and Arrow/Parquet directory exports only. |
|
<filename> <inputfile.ext> |
Set the .output filename. The default is the input filename with the extension for the chosen format. |
|
true, false |
If true, do not display progress bar. |
|
sqlite, hdf, text, info, arrow, jsonlines, arrowdir, parquetdir, |
Export format type. HDF format is supported only on x86_64 Linux and Windows. |
|
<pattern> [,<pattern>…] |
Value is a comma-separated list of search patterns (no spaces). This option can be given more than once. If set, only tables that match one or more of the patterns will be exported. If not set, all tables will be exported. This feature applies to SQLite, HDFS, Arrow, and Arrow/Parquet directory exports only. The patterns are case-insensitive POSIX basic regular expressions. Note This is an advanced feature intended for expert users. This option does not enforce any type of
dependency or relationship between tables and will truly export only the listed tables. If partial
exports are used with analytics features such as |
|
<timerange> [,<timerange>…] |
Value is a comma-separated list of time ranges (no spaces). This option can be given more than once. If set, only events that fall within at least one of the given ranges will be exported. If not set, all events will be exported. This feature applies to SQLite, HDFS, Arrow, and Arrow/Parquet directory exports only. Note This is an advanced feature intended for expert users. This option does not enforce any type of dependency or relationship between related events (such as CUDA launch APIs and CUDA kernel executions). If analysis scripts that rely on missing data are run over filtered exports unexpected or misleading results may be generated. It is the responsibility of the user to ensure all relevant and interrelated events are exported. The format of a time-range is: The time values are a series of integer or floating-point values followed by an optional unit. If no
unit is given, the number is assumed to be in nanoseconds. Positive and negative values are supported,
as well as scientific The following units are understood:
For example, the value By default, the time ranges have START END S/E :S/E S/E: :S/E:
| =========== | T T T T
============== | F T F T
| ============== F F T T
================= F F F T
===== | or | ==== F F F F
While many events have both a start and end time, some events only have a single timestamp. These types
of events are treated as an event with a start time equal to the end time. If an event’s end time is
before the start time, the end time is adjusted to the start time. If used in conjunction with the
|
|
true, false |
If true, all timestamp values in the report will be shifted to UTC wall-clock time, as defined by the
UNIX epoch. This option can be used in conjunction with the |
|
signed integer, in nanoseconds 0 |
If given, all timestamp values in the report will be shifted by the given amount. This option can be
used in conjunction with the |
CLI Finalize Command Switch Options#
After choosing the finalize command switch, the following options are available. Usage:
nsys [global-options] finalize [options] [subcommand]
Option |
Available Parameters (default in bold) |
Switch Description |
|---|---|---|
|
all, <uuid> |
Discard deferred collections without generating reports. Use |
|
true, false |
If true, overwrite existing report files when finalizing. Default is false. |
|
<tag> |
Print the help message. The option can take one optional argument that will be used as a tag. If a tag is provided, only options relevant to the tag will be printed. |
|
<uuid> |
Finalize a specific deferred collection identified by its UUID. Use |
|
directory path |
Output directory for finalized report files. The original filename is retained. By default, reports are placed in the directory specified during collection. |
|
session name |
Filter deferred collections by session name. |
CLI Finalize List Subcommand#
The finalize list subcommand displays pending deferred collections. Usage:
nsys [global-options] finalize list [options]
Option |
Available Parameters (default in bold) |
Switch Description |
|---|---|---|
|
plain, json |
Controls the output format. |
|
session name |
Filter deferred collections by session name. |
|
true, false |
Controls whether a header should appear in the output. |
CLI Launch Command Switch Options#
After choosing the launch command switch, the following options are available. Usage:
nsys [global-options] launch [options] <application> [application-arguments]
Option |
Available Parameters (default in bold) |
Switch Description |
|---|---|---|
|
auto, fp, lbr, dwarf, none |
Select the backtrace method to use while sampling. The option |
|
true, false |
Collect clock frequency changes. Available only in Nsight Systems Embedded Platforms Edition and Arm server (SBSA) platforms. |
|
0x16, 0x17, …, none |
Collect per-cluster Uncore PMU counters. Multiple values can be selected, separated by commas only (no
spaces). Use the |
|
< filename >, none |
Open a file that contains profile switches and parse the switches. Note additional switches on the command line will override switches in the file. This flag can be specified more than once. |
|
0x11,0x13,…, none |
Collect per-core PMU counters. Multiple values can be selected, separated by commas only (no spaces).
Use the |
|
‘help’ or the end users selected events in the format ‘x,y’, 2 |
Default is Instructions Retired. Select the CPU Core events to sample. Use the
|
|
0x2a,0x2c,…, none |
Collect per-socket Uncore PMU counters. Multiple values can be selected, separated by commas only (no
spaces). Use the |
|
‘help’ or the users selected events as ‘x,y’, none |
Select the Uncore CPU Socket events to sample. Use the |
|
process-tree, system-wide, none |
Trace OS thread scheduling activity. Select Note If the |
|
auto, true, false |
Trace CUDA Event completion on the device side, and get better correlation support among CUDA Event
APIs. Applicable only when CUDA tracing is enabled. “CUDA Event” refers to the synchronization
mechanism (cudaEventRecord, cudaStreamWaitEvent etc.). Enabling this feature may increase runtime
overhead and the likelihood of false dependencies across CUDA Streams, similar to CUDA Event’s timing
functionality when cudaEventDisableTiming is not disabled. |
|
milliseconds |
Set the interval when buffered CUDA data is automatically saved to storage in milliseconds. The CUDA
data buffer saves may cause profiler overhead. Buffer save behavior can be controlled with this switch.
If the CUDA flush interval is set to 0 on systems running CUDA 11.0 or newer, buffers are saved when
they fill. If a flush interval is set to a non-zero value on such systems, buffers are saved only when
the flush interval expires. If a flush interval is set and the profiler runs out of available buffers
before the flush interval expires, additional buffers will be allocated as needed. In this case,
setting a flush interval can reduce buffer save overhead but increase memory use by the profiler. If
the flush interval is set to 0 on systems running older versions of CUDA, buffers are saved at the end
of the collection. If the profiler runs out of available buffers, additional buffers are allocated as
needed. If a flush interval is set to a non-zero value on such systems, buffers are saved when the
flush interval expires. A |
|
true, false |
Track the GPU memory usage by CUDA kernels. Applicable only when CUDA tracing is enabled. Note This feature may cause significant runtime overhead. |
|
true, false |
By default, Nsight Systems skips CUDA APIs that are not critical for performance analysis. If enabled, Nsight Systems will trace all CUDA APIs, including those less relevant to performance analysis. Note This feature may cause significant runtime overhead. |
|
true, false |
This switch tracks the page faults that occur when CPU code tries to access a memory page that resides on the device. Note that this feature may cause significant runtime overhead. Not available on Nsight Systems Embedded Platforms Edition. |
|
true, false |
This switch tracks the page faults that occur when GPU code tries to access a memory page that resides on the host. Note that this feature may cause significant runtime overhead. Not available on Nsight Systems Embedded Platforms Edition. |
|
all, none, kernel, memory, sync, other |
When tracing CUDA APIs, enable the collection of a backtrace when a CUDA API is invoked. Significant
runtime overhead may occur. Values may be combined using Note CPU sampling must be enabled. |
|
graph, node |
If |
|
true, false |
Nsight Systems trace initialization involves creating and discarding a D3D device. Enabling this flag,
|
|
true, false, batch, individual, none |
If individual or true, trace each DX12 workload’s GPU activity individually. If batch, trace DX12
workloads’ GPU activity in |
|
true, false |
If true, trace wait calls that block on fences for DX12. Note that this switch is applicable only when
|
|
A=B |
Set environment variable(s) for the application process to be launched. Environment variables should be defined as A=B. Multiple environment variables can be specified as A=B,C=D. |
|
< directory path > |
Specify a directory containing GDS (GPUDirect Storage) libraries (must contain libcufile.so). Use this
argument if the GDS libraries are located in a different path than the default. This argument is used
together with |
|
true, false |
When true, collect GDS (GPUDirect Storage) metrics. This option is only supported on Linux x64 and SBSA targets. |
|
help, <id1,id2,…>, all, none |
Analyze video devices. |
|
<tag>, none |
Print the help message. The option can take one optional argument that will be used as a tag. If a tag is provided, only options relevant to the tag will be printed. |
|
‘F1’ to ‘F12’, F12 |
Hotkey to trigger the profiling session. Note that this switch is applicable only when
|
|
true, false |
When true, the current environment variables and the tool’s environment variables will be specified for the launched process. When false, only the tool’s environment variables will be specified for the launched process. |
|
true, false |
Use detours for injection. If false, process injection will be performed by windows hooks which allows it to bypass anti-cheat software. |
|
true, false |
Trace Interrupt Service Routines (ISRs) and Deferred Procedure Calls (DPCs). Requires administrative privileges. Available only on Windows devices. |
|
openmpi, mpich |
When using |
|
none, all, api, api-coll, api-group, api-p2p, ce-batch, ce-coll, ce-sync, coll, default, rt, gpu, group, kernel-launch, p2p, proxy-counters, proxy-op, proxy-step |
Comma-separated list of NCCL events to record, takes priority over |
|
range@domain, range, range@*, none |
Specify NVTX range and domain to trigger the profiling session. This option is applicable only when
used along with |
|
default, <domain_names> |
Choose to exclude NVTX events from a comma separated list of domains. Note Only one of |
|
default, <domain_names> |
Choose to only include NVTX events from a comma separated list of domains. Note Only one of |
|
<json_file> |
Specify the path to the JSON file containing the requested NVTX annotations. |
|
true, false |
If true, trace the OpenGL workloads’ GPU activity. Note that this switch is applicable only when
|
|
‘help’ or the end users selected events in the format ‘x,y’ |
Select the OS events to sample. Use the |
|
integer, 24 |
Set the depth for the backtraces collected for OS runtime libraries calls. |
|
integer, 6144 |
The |
|
nanoseconds, 80000 |
The |
|
< nanoseconds >, 1000 ns |
Set the duration, in nanoseconds, that Operating System Runtime (osrt) APIs must execute before they are traced. Values significantly less than 1000 may cause significant overhead and result in extremely large result files. Note This setting is ignored for APIs that interact with files when |
|
true, false |
Collect file access data when tracing Operating System Runtime (osrt) APIs that interact with files. Note When this setting is set to true the |
|
cuda, none |
Collect Python backtrace event when tracing the selected API’s trigger. This option is supported
on Arm server (SBSA) platforms and x86 Linux targets. Note: tracing and backtraces of the selected API
and CPU sampling must be enabled. For example, |
|
true, false |
Collect Python backtrace sampling events. This option is supported on Arm server (SBSA) platforms, x86 Linux and Windows targets. Note: When profiling Python-only workflows, consider disabling the CPU sampling option to reduce overhead. |
|
1 < integers < 2000, 1000 |
The |
|
autograd-nvtx, autograd-shapes-nvtx, functions-trace, functions-trace- shapes, none |
Enable automatic annotations of PyTorch functions. |
|
functions-trace, none |
Enable automatic annotations of Dask functions |
|
class/event,event, class/event:mode, class:mode,help, none |
Multiple values can be selected, separated by commas only (no spaces). See the
|
|
system,process,fast, wide, system:fast |
The |
|
true, false |
Resolve symbols of captured samples and backtraces. |
|
true, false |
Retain ETW files generated by the trace, merge and move the files to the output directory. |
|
< username >, none |
Run the target application as the specified username. If not specified, the target application will be run by the same user as Nsight Systems. Requires root privileges. Available for Linux targets only. |
|
process-tree, system-wide, xhv, xhv-system-wide, none |
Select how to collect CPU IP/backtrace samples. If Note
Note If set to |
|
integer <= 32, 1 |
The number of CPU IP samples collected for every CPU IP/backtrace sample collected. For example, if set to 4, on the fourth CPU IP sample collected, a backtrace will also be collected. Lower values increase the amount of data collected. Higher values can reduce collection overhead and reduce the number of CPU IP samples dropped. If DWARF backtraces are collected, the default is 4, otherwise the default is 1. This option is not available on Nsight Systems Embedded Platforms Edition or on non-Linux targets. |
|
100 < integers < 8000, 1000 |
Specify the sampling/backtracing frequency. The minimum supported frequency is 100 Hz. The maximum supported frequency is 8000 Hz. This option is supported only on QNX, Linux for Tegra, and Windows targets. |
|
integer |
Default is determined dynamically. The number of CPU Cycle events counted before a CPU instruction
pointer (IP) sample is collected. If configured, backtraces may also be collected. The smaller the
sampling period, the higher the sampling rate. Note that smaller sampling periods will increase
overhead and significantly increase the size of the result file(s). Requires the
|
|
integer |
Default is determined dynamically. The number of events counted before a CPU instruction pointer (IP) sample is collected. The event used to trigger the collection of a sample is determined dynamically. For example, on Intel based platforms, it will probably be “Reference Cycles” and on AMD platforms, “CPU Cycles”. If configured, backtraces may also be collected. The smaller the sampling period, the . higher the sampling rate Note that smaller sampling periods will increase overhead and significantly increase the size of the result file(s). This option is available only on Linux targets. |
|
timer, sched, perf, cuda |
Specify backtrace collection trigger. Multiple APIs can be selected, separated by commas only (no spaces). Available on Nsight Systems Embedded Platforms Edition targets only. |
|
session identifier, none |
Launch the application in the indicated session. The option argument must represent a valid session
name or ID as reported by |
|
[a-Z][0-9,a-Z,spaces] |
Default is profile-<id>-<application>. Name the session created by the command. Name must start with an
alphabetical character followed by printable or space characters. Any |
|
true, false |
If true, send the target process’s stdout and stderr streams to both the console and stdout/stderr files which are added to the report file. If false, only send the target process stdout and stderr streams to the stdout/stderr files which are added to the report file. |
|
cuda, opengl, nvtx, osrt, cuda-sw, cudnn, cublas, cusolver, cublas-verbose, cusparse-verbose, cudla, cudla-verbose, cusolver-verbose, dx11, dx12, openacc, dx11-annotations, dx12-annotations, opengl-annotations, openmp, mpi, nccl, tegra-accelerators, ucx, openxr, oshmem, openxr-annotations, python-gil, gds, s3, s3-verbose, wddm, vulkan-annotations, vulkan, nvvideo, none |
Select the API(s) to be traced. The osrt switch controls the OS runtime libraries tracing. Multiple
APIs can be selected, separated by commas only (no spaces). Since OpenACC and cuXXX APIs
are tightly linked with CUDA, selecting one of those APIs will automatically enable CUDA tracing.
cublas, cudla, cusparse and cusolver all have XXX-verbose options available.
Reflex SDK latency markers will be automatically collected when DX or vulkan API trace is enabled.
See information on Note cuDNN is not available on Windows target. Note The |
|
true, false |
If true, trace any child process after fork and before they call one of the exec functions. Beware, tracing in this interval relies on undefined behavior and might cause your application to crash or deadlock. This option is only available on Linux target platforms. |
|
true, false, batch, ,none individual |
Default is individual. If individual or true, trace each Vulkan workload’s GPU activity individually.
If batch, trace Vulkan workloads’ GPU activity in |
|
primary, all |
If |
|
true, false |
If |
|
true, false |
If |
|
true, false |
If |
CLI Sessions Command Switch Subcommands#
After choosing the sessions command switch, the following subcommands are available. Usage:
nsys [global-options] sessions [subcommand]
Subcommand |
Description |
|---|---|
list |
List all active sessions including ID, name, and state information |
CLI Sessions List Command Switch Options#
After choosing the sessions list command switch, the following options are available. Usage:
nsys [global-options] sessions list [options]
Option |
Available Parameters (default in bold) |
Switch Description |
|---|---|---|
|
<tag> |
Print the help message. The option can take one optional argument that will be used as a tag. If a tag is provided, only options relevant to the tag will be printed. |
|
true, false |
Controls whether a header should appear in the output. |
|
plain, json |
Output format used for session list. |
CLI Shutdown Command Switch Options#
After choosing the shutdown command switch, the following options are available. Usage:
nsys [global-options] shutdown [options]
Option |
Available Parameters (default in bold) |
Switch Description |
|---|---|---|
|
<tag> |
Print the help message. The option can take one optional argument that will be used as a tag. If a tag is provided, only options relevant to the tag will be printed. |
|
On Linux: none, sigkill, sigterm, signal number On Windows: true, false |
Send signal to the target application’s process group when shutting down session. |
|
session identifier |
Shutdown the indicated session. The option argument must represent a valid session name or ID as
reported by |
CLI Start Command Switch Options#
After choosing the start command switch, the following options are available. Usage:
nsys [global-options] start [options]
Option |
Available Parameters (default in bold) |
Switch Description |
|
|---|---|---|---|
|
none, tegra-accelerators |
Collect other accelerators workload trace from the hardware engine units. Available in Nsight Systems Embedded Platforms Edition only. This option will also enable collection of hardware accelerator related ftrace events. |
|
|
< command > |
Execute a command after the collection starts. The command will be reused for subsequent starts until
it is reset or cleared. Pass the option with no value to clear the previously set command. The executed
process receives the following environment variables: Note NSYS_SESSION_NAME - the current session name NSYS_CALLBACK_NAME - the current callback name Note Available on x86 Linux only. |
|
|
< command > |
Execute a command after the report is ready. The command is reused for subsequent stops until it is
reset or cleared. Pass the option with no value to clear the previously set command. The executed
process receives the following environment variables: Note NSYS_SESSION_NAME - the current session name NSYS_CALLBACK_NAME - the current callback name NSYS_REPORT_PATH - the path to the generated report file Note Available on x86 Linux only. |
|
|
auto, fp, lbr, dwarf, none |
Select the backtrace method to use while sampling. The option |
|
|
none, cudaProfilerApi, hotkey, nvtx |
When Note Hotkey works for graphic applications only. |
|
|
none, stop, stop-shutdown, repeat[:N][:mode], repeat-shutdown:N [:mode] |
Default is stop-shutdown. Specify the desired behavior when a capture range ends. Applicable only when
used along with the
If |
|
|
0x11,0x13,…, none |
Collect per-core PMU counters. Multiple values can be selected, separated by commas only (no spaces).
Use the |
|
|
‘help’ or the end users selected events in the format ‘x,y’, 2 |
Default is Instructions Retired. Select the CPU Core events to sample. Use the
|
|
|
0,1,2,…, none |
Collect metrics on the CPU core. Multiple values can be selected, separated by commas only (no spaces).
Use the Note Only available on Grace. |
|
|
‘help’ or a comma separated list |
Choose the CPU core events and metrics desired. Use name or alias. Not available on Nsight Systems Embedded Platforms Edition. |
|
|
0x2a,0x2c,…, none |
Collect per-socket Uncore PMU counters. Multiple values can be selected, separated by commas only (no
spaces). Use the |
|
|
‘help’ or the users selected events as ‘x,y’, none |
Select the Uncore CPU Socket events to sample. Use the |
|
|
0,1,2,…, none |
Collect Uncore metrics on the CPU socket. Multiple values can be selected, separated by commas only (no
spaces). Use the Note Only available on Grace. |
|
|
process-tree, system-wide, none |
Trace OS thread scheduling activity. Select Note If the |
|
|
<directory paths> |
A colon-separated list of directories with symbol files. Available only on Linux and QNX devices. |
|
|
true, false |
When false, Nsight Systems will collect the environment variables of the launched process. When true, the environment variables will not be collected. Note Available on Linux only. |
|
|
|
Use the specified plugin. The option can be specified multiple times to enable multiple plugins.
Plugin arguments are separated by commas only (no spaces). On non-Windows platforms, commas can be
escaped with a backslash |
|
|
“<name>,<guid>”, or path to JSON file |
Add custom ETW trace provider(s). If you want to specify more attributes than Name and GUID, provide a JSON configuration file as as outlined below. This switch can be used multiple times to add multiple providers. Note: Only available for Windows targets. |
|
|
system-wide, none |
Use the |
|
|
Integers from 1 to 1000 milliseconds, 10 |
The interval between each event sample collection. Minimum event sampling interval is 1 mSec. Maximum event sampling interval is 1000 mSec. Not available in Nsight Systems Embedded Platforms Edition. |
|
|
arrow, arrowdir, hdf, jsonlines, sqlite, parquetdir, text, none |
Create additional output file(s) based on the data collected. This option can be given more than once. Warning If the collection captures a large amount of data, creating the export file may take several minutes to complete. |
|
|
true, false |
If |
|
|
true, false |
If true, overwrite all existing result files with same output filename (.nsys-rep, .sqlite, .h5, .txt, .jsonl, .arrows, _arwdir, _pqtdir). |
|
|
Collect ftrace events. Argument should list events to collect as: subsystem1/event1,subsystem2/event2. Requires root. No ftrace events are collected by default. |
||
|
Skip initial ftrace setup and collect already configured events. Default resets the ftrace configuration. |
||
|
< directory path > |
Specify a directory containing GDS (GPUDirect Storage) libraries (must contain libcufile.so). Use this
argument if the GDS libraries are located in a different path than the default. This argument is used
together with |
|
|
true, false |
When true, collect GDS (GPUDirect Storage) metrics. This option is only supported on Linux x64 and SBSA targets. |
|
|
GPU ID, help, all, none |
Collect GPU Metrics from specified devices. Determine GPU IDs by using |
|
|
integer, 10000 |
Specify GPU Metrics sampling frequency. Minimum supported frequency is 10 (Hz). Maximum supported frequency is 200000 (Hz). |
|
|
alias, file:<file name> |
Specify metric set for GPU Metrics. The argument must be one of the aliases reported by
|
|
|
help, <id1,id2,…>, all, none |
Analyze video devices. |
|
|
true, false |
Trace GPU context switches. See the GPU Context Switch topic for details. |
|
|
<tag>, none |
Print the help message. The option can take one optional argument that will be used as a tag. If a tag is provided, only options relevant to the tag will be printed. |
|
|
<NIC names>, none |
A comma-separated list of NIC names. The NICs which |
|
|
<file paths>, none |
A comma-separated list of file paths. Paths of an existing ibdiagnet db_csv files, containing networks
information data. Nsight Systems will read the networks’ information from these files. Don’t use |
|
|
<directory path>, none |
Sets the path of a directory into which ibdiagnet network discovery data will be written. Use this
option together with the |
|
|
<IB switch GUIDs>, none |
The |
|
|
<NIC name> |
|
|
|
1 <= integer <= 100, 50 |
Set the percent of InfiniBand switch congestion events to be collected using the
|
|
|
1 < integer <= 1023, 75 |
The |
|
|
<IB switch GUIDs> |
Add comma-separated list of InfiniBand switch GUIDs by using the |
|
|
<NIC name> |
|
|
|
true, false |
Trace Interrupt Service Routines (ISRs) and Deferred Procedure Calls (DPCs). Requires administrative privileges. Available only on Windows devices. |
|
|
lf, hf, none |
Collect metrics from NIC/HCA devices. The ‘hf’ option collects high frequency metrics but lacks RoCE, IPoIB, and ‘Send Waits’ metrics. The ‘lf’ option collects all available metrics but at a lower sampling frequency. The deprecated ‘true’ option is accepted for backwards compatibility and corresponds to ‘lf’. The ‘true’ option will be removed in a future release. System scope. Not available on Nsight Systems Embedded Platforms Edition. |
|
|
‘help’ or the end users selected events in the format ‘x,y’ |
Select the OS events to sample. Use the |
|
|
< filename >, report# |
Set the report file name. Any |
|
|
main, system-wide process-tree, |
Select which process(es) to trace. Available in Nsight Systems Embedded Platforms Edition only. Nsight Systems Workstation Edition will always trace system-wide in this version of the tool. |
|
|
true, false |
Retain ETW files generated by the trace, merge and move the files to the output directory. |
|
|
process-tree, system-wide, xhv, xhv-system-wide, none |
Select how to collect CPU IP/backtrace samples. If Note
Note If set to |
|
|
integer <= 32, 1 |
The number of CPU IP samples collected for every CPU IP/backtrace sample collected. For example, if set to 4, on the fourth CPU IP sample collected, a backtrace will also be collected. Lower values increase the amount of data collected. Higher values can reduce collection overhead and reduce the number of CPU IP samples dropped. If DWARF backtraces are collected, the default is 4, otherwise the default is 1. This option is not available on Nsight Systems Embedded Platforms Edition or on non-Linux targets. |
|
|
100 < integers < 8000, 1000 |
Specify the sampling/backtracing frequency. The minimum supported frequency is 100 Hz. The maximum supported frequency is 8000 Hz. This option is supported only on QNX, Linux for Tegra, and Windows targets. |
|
|
integer |
Default is determined dynamically. The number of CPU Cycle events counted before a CPU instruction
pointer (IP) sample is collected. If configured, backtraces may also be collected. The smaller the
sampling period, the higher the sampling rate. Note that smaller sampling periods will increase
overhead and significantly increase the size of the result file(s). Requires the
|
|
|
integer |
Default is determined dynamically. The number of events counted before a CPU instruction pointer (IP) sample is collected. The event used to trigger the collection of a sample is determined dynamically. For example, on Intel based platforms, it will probably be “Reference Cycles” and on AMD platforms, “CPU Cycles”. If configured, backtraces may also be collected. The smaller the sampling period, the . higher the sampling rate Note that smaller sampling periods will increase overhead and significantly increase the size of the result file(s). This option is available only on Linux targets. |
|
|
timer, sched, perf, cuda |
Specify backtrace collection trigger. Multiple APIs can be selected, separated by commas only (no spaces). Available on Nsight Systems Embedded Platforms Edition targets only. |
|
|
session identifier, none |
Start the collection in the indicated session. The option argument must represent a valid session name
or ID as reported by |
|
|
[a-Z][0-9,a-Z,spaces] |
Default is profile-<id>-<application>. Name the session created by the command. Name must start with an
alphabetical character followed by printable or space characters. Any |
|
|
true, false |
If true, send the target process’s stdout and stderr streams to both the console and stdout/stderr files which are added to the report file. If false, only send the target process stdout and stderr streams to the stdout/stderr files which are added to the report file. |
|
|
true, false |
Collect SoC Metrics. Available in Nsight Systems Embedded Platforms Edition only. |
|
|
integer, 10000 |
Specify SoC Metrics sampling frequency. Minimum supported frequency is ‘100’ (Hz). Maximum supported frequency is ‘1000000’ (Hz). Available in Nsight Systems Embedded Platforms Edition only. |
|
|
alias, file:<file name> |
Specify metric set for SoC Metrics. The argument must be one of the aliases reported by
|
|
|
true, false |
Generate summary statistics after the collection. Warning When set to true, an SQLite database will be created after the collection. If the collection captures a large amount of data, creating the database file may take several minutes to complete. |
|
|
true, false |
If true, stop collecting automatically when the launched process has exited or when the duration expires - whichever occurs first. If false, duration must be set and the collection stops only when the duration expires. Nsight Systems does not officially support runs longer than 5 minutes. |
|
|
process-tree, pid-namespace, none |
Collect system calls. The value defines the collection scope: |
|
|
true, false |
Collect vsync events. If collection of vsync events is enabled, display/display_scanline ftrace events will also be captured. Available in Nsight Systems Embedded Platforms Edition only. |
|
|
< filepath pct.json > |
Collect hypervisor trace. Available in Nsight Systems Embedded Platforms Edition only. |
|
|
all, none, core, sched, irq, trap |
Available in Nsight Systems Embedded Platforms Edition only. |
|
|
<filepath kernel_symbols.json> |
XHV sampling config file. Available in Nsight Systems Embedded Platforms Edition only. |
|
CLI Stats Command Switch Options#
The nsys stats command generates a series of summary or trace reports.
These reports can be output to the console, or to individual files, or piped to
external processes. Reports can be rendered in a variety of different output
formats, from human readable columns of text, to formats more appropriate for
data exchange, such as CSV.
Reports are generated from an SQLite export of a .nsys-rep file. If a .nsys-rep file is specified, Nsight Systems will look for an accompanying SQLite file and use it. If no SQLite file exists, one will be exported and created.
Individual reports are generated by calling out to scripts that read data from the SQLite file and return their report data in CSV format. Nsight Systems ingests this data and formats it as requested, then displays the data to the console, writes it to a file, or pipes it to an external process. Adding new reports is as simple as writing a script that can read the SQLite file and generate the required CSV output. See the shipped scripts as an example. Both reports and formatters may take arguments to tweak their processing. For details on shipped scripts and formatters, see Statistical Analysis .
Reports are processed using a three-tuple that consists of:
The requested report (and any arguments),
The presentation format (and any arguments), and
The output (filename, console, or external process).
The first report specified uses the first format specified, and is presented via the first output specified. The second report uses the second format for the second output, and so forth. If more reports are specified than formats or outputs, the format and/or output list is expanded to match the number of provided reports by repeating the last specified element of the list (or the default, if nothing was specified).
nsys stats is a very powerful command and can handle complex argument
structures, please see the topic below on Example Stats Command Sequences.
After choosing the stats command switch, the following options are
available. Usage:
nsys [global-options] stats [options] [input-file]
Option |
Available Parameters (default in bold) |
Switch Description |
|---|---|---|
|
<tag> |
Print the help message. The option can take one optional argument that will be used as a tag. If a tag is provided, only options relevant to the tag will be printed. |
|
column, table, csv, tsv, json, hdoc, htable, . |
Specify the output format. The special name “.” indicates the default format for the given output. The
default format for console is column, while files and process outputs default to csv. This option may
be used multiple times. Multiple formats may also be specified using a comma-separated list
( |
|
true, false |
Force a re-export of the SQLite file from the specified .nsys-rep file, even if an SQLite file already exists. |
|
true, false |
Overwrite any existing report file(s). |
|
<format_name>, ALL, [none] |
With no argument, give a summary of the available output formats. If a format name is given, a more
detailed explanation of that format is displayed. If |
|
<report_name>, ALL, [none] |
With no argument, list a summary of the available summary and trace reports. If a report name is given,
a more detailed explanation of the report is displayed. If |
|
-, @<command>, <basename>, . |
Specify the output mechanism. There are three output mechanisms: print to console, output to file, or
output to command. This option may be used multiple times. Multiple outputs may also be specified using
a comma-separated list. If the given output name is “-”, the output will be displayed on the console.
If the output name starts with “@”, the output designates a command to run. The nsys command will be
executed and the analysis output will be piped into the command. Any other output is assumed to be the
base path and name for a file. If a file basename is given, the filename used will be:
|
|
Do not display verbose messages, only display errors. |
|
|
See Report Scripts |
Specify the report(s) to generate, including any arguments. This option may be used multiple times.
Multiple reports may also be specified using a comma-separated list ( |
|
<path> |
Add a directory to the path used to find report scripts. This is usually only needed if you have one or
more directories with personal scripts. This option may be used multiple times. Each use adds a new
directory to the end of the path. A search path can also be defined using the environment variable
|
|
<file.sqlite> |
Specify the SQLite export filename. If this file exists, it will be used. If this file doesn’t exist
(or if |
|
nsec, usec, msec, nanoseconds, microseconds, milliseconds, seconds |
Set basic unit of time. The argument of the switch is matched by using the longest prefix matching,
meaning that it is not necessary to write a whole word as the switch argument. It is similar to passing
a |
CLI Status Command Switch Options#
The nsys status command returns the current state of the CLI. After choosing the status command switch, the following options are available. Usage:
nsys [global-options] status [options]
Option |
Available Parameters (default in bold) |
Switch Description |
|---|---|---|
|
Prints information for all the available profiling environments. |
|
|
Returns information about the system regarding suitability of the profiling environment. |
|
|
<tag> |
Print the help message. The option can take one optional argument that will be used as a tag. If a tag is provided, only options relevant to the tag will be printed. |
|
Returns information about the system regarding suitability of the network profiling environment. |
|
|
session identifier |
Print the status of the indicated session. The option argument must represent a valid session name or
ID as reported by |
CLI Stop Command Switch Options#
After choosing the stop command switch, the following options are available. Usage:
nsys [global-options] stop [options]
Option |
Available Parameters (default in bold) |
Switch Description |
|---|---|---|
|
Defer the generation of the report file so that the stop command returns quickly. The raw data will
be retained in a temporary location. Use |
|
|
<tag> |
Print the help message. The option can take one optional argument that will be used as a tag. If a tag is provided, only options relevant to the tag will be printed. |
|
time in seconds |
Indicate how many seconds of collected data previous to the stop command should be retained in the result file. Zero is treated as a special setting that retains all of the data. |
|
session identifier |
Stop the indicated session. The option argument must represent a valid session name or ID as reported
by |
Example Single Command Lines#
Version Information
nsys -v
Effect: Prints tool version information to the screen.
Run with elevated privilege
sudo nsys profile <app>
Effect: Nsight Systems CLI (and target application) will run with elevated
privilege. This is necessary for some features, such as FTrace or system-wide
CPU sampling. If you don’t want the target application to be elevated, use
--run-as option.
Default analysis run
nsys profile <application>
    [application-arguments]
Effect: Launch the application using the given arguments. Start collecting immediately and end collection when the application stops. Trace CUDA, OpenGL, NVTX, and OS runtime libraries APIs. Collect CPU Instruction Pointer (IP) sampling information and thread scheduling information. With Nsight Systems Embedded Platforms Edition this will only analysis the single process. With Nsight Systems Workstation Edition this will trace the process tree. Generate the report#.nsys-rep file in the default location, incrementing the report number if needed to avoid overwriting any existing output files.
Limited trace only run
nsys profile --trace=cuda,nvtx -d 20
    --sample=none --cpuctxsw=none -o my_test <application>
    [application-arguments]
Effect: Launch the application using the given arguments. Start collecting
immediately and end collection after 20 seconds or when the application ends.
Trace CUDA and NVTX APIs. Do not collect CPU sampling information or thread
scheduling information. Profile any child processes. Generate the output file as
my_test.nsys-rep in the current working directory.
Delayed start run
nsys profile -e TEST_ONLY=0 -y 20
    <application> [application-arguments]
Effect: Set environment variable TEST_ONLY=0. Launch the application using the given arguments. Start collecting after 20 seconds and end collection at application exit. Trace CUDA, OpenGL, NVTX, and OS runtime libraries APIs. Collect CPU sampling and thread schedule information. Profile any child processes. Generate the report#.nsys-rep file in the default location, incrementing if needed to avoid overwriting any existing output files.
Run application, start/stop collection using NVTX
nsys profile -c nvtx -w true -p MESSAGE@DOMAIN <application> [application-arguments]
Effect: Create interactive CLI process and set it up to begin collecting as soon
as an NVTX range with a given message in a given domain (capture range) is opened.
Launch application for default analysis, sending application output to the
terminal. Stop collection when all capture ranges are closed, when the user
calls nsys stop, or when the root process terminates. Generate the
report#.nsys-rep in the default location.
Note
The Nsight Systems CLI only triggers the profiling session for the first capture range.
NVTX capture range can be specified:
Message@Domain: All ranges with given message in given domain are capture ranges. For example:
nsys profile -c nvtx -w true -p profiler@service ./app
This would make the profiling start when the first range with message “profiler” is opened in domain “service.”
Message@*: All ranges with given message in all domains are capture ranges. For example:
nsys profile -c nvtx -w true -p profiler@* ./app
This would make the profiling start when the first range with message “profiler” is opened in any domain.
Message: All ranges with given message in default domain are capture ranges. For example:
nsys profile -c nvtx -w true -p profiler ./app
This would make the profiling start when the first range with message “profiler” is opened in the default domain.
By default, only messages provided by NVTX registered strings are considered. This avoids the need to perform a string match on every NVTX string encountered in the application, which creates significant additional overhead. It is strongly recommended to always use NVTX registered strings. If you do not use registered strings you will have to enable the full match by launching your application with
NSYS_NVTX_PROFILER_REGISTER_ONLY=0environment:nsys profile -c nvtx -w true -p profiler@service -e NSYS_NVTX_PROFILER_REGISTER_ONLY=0 ./app
Note
The separator ‘@’ can be escaped with backslash ‘\’. If multiple separators without escape character are specified, only the last one is applied, all others are discarded.
Collect ftrace events
nsys profile --ftrace=drm/drm_vblank_event
    -d 20
Effect: Collect ftrace drm_vblank_event events for 20 seconds. Generate the
report#.nsys-rep file in the current working directory. Note that ftrace event
collection requires running as root. To get a list of ftrace events available
from the kernel, run the following:
sudo cat /sys/kernel/debug/tracing/available_events
Run GPU metric sampling on one TU10x
nsys profile --gpu-metrics-devices=0
    --gpu-metrics-set=tu10x-gfxt <application>
Effect: Launch application. Collect default options and GPU metrics for the
first GPU (a TU10x), using the tu10x-gfxt metric set at the default frequency
(10 kHz). Profile any child processes. Generate the report#.nsys-rep file
in the default location, incrementing if needed to avoid overwriting any
existing output files.
Run GPU metric sampling on all GPUs at a set frequency
nsys profile --gpu-metrics-devices=all
    --gpu-metrics-frequency=20000 <application>
Effect: Launch application. Collect default options and GPU metrics for all available GPUs using the first suitable metric set for each and sampling at 20 kHz. Profile any child processes. Generate the report#.nsys-rep file in the default location, incrementing if needed to avoid overwriting any existing output files.
Collect CPU IP/backtrace and CPU context switch
nsys profile --sample=system-wide --duration=5
Effect: Collects both CPU IP/backtrace samples using the default backtrace mechanism and traces CPU context switch activity for the whole system for 5 seconds. Note that it requires root permission or a Linux paranoid level of 0 or less to run. No hardware or OS events are sampled. Post processing of this collection will take longer due to the large number of symbols to be resolved caused by system-wide sampling.
Get list of available CPU core events and metrics
nsys profile --cpu-metrics=help
Effect: Lists the CPU core events and derived metrics that can be sampled and also gives the maximum number of CPU events that can be sampled concurrently.
Collect system-wide CPU events and metrics, and trace application
nsys profile --event-sample=system-wide
    --cpu-metrics=ITLB_WALK,DTLB_WALK,ipc --event-sampling-interval=5 <app> [app args]
Effect:Collects CPU IP/backtrace samples using the default backtrace mechanism, traces CPU context switch activity, collects CPU core events: ITLB_WALK, DTLB_WALK and CPU core metrics: ipc every 5 ms for the whole system. Note that it requires root permission or a Linux paranoid level of 0 or less to run. Note that CUDA, NVTX, OpenGL, and OSRT within the app launched by Nsight Systems are traced by default while using this command. Post processing of this collection will take longer due to the large number of symbols to be resolved caused by system-wide sampling.
Collect custom ETW trace using configuration file
nsys profile --etw-provider=file.JSON
Effect: Configure custom ETW collectors using the contents of file.JSON. Collect
data for 20 seconds. Generate the report#.nsys-rep file in the current
working directory.
A template JSON configuration file is located at in the Nsight Systems
installation directory as \\target-windows-x64\\etw_providers_template.json.
This path will show up automatically if you call the following:
nsys profile --help
The level attribute can only be set to one of the following:
TRACE_LEVEL_CRITICAL
TRACE_LEVEL_ERROR
TRACE_LEVEL_WARNING
TRACE_LEVEL_INFORMATION
TRACE_LEVEL_VERBOSE
The flags attribute can only be set to one or more of the following:
EVENT_TRACE_FLAG_ALPC
EVENT_TRACE_FLAG_CSWITCH
EVENT_TRACE_FLAG_DBGPRINT
EVENT_TRACE_FLAG_DISK_FILE_IO
EVENT_TRACE_FLAG_DISK_IO
EVENT_TRACE_FLAG_DISK_IO_INIT
EVENT_TRACE_FLAG_DISPATCHER
EVENT_TRACE_FLAG_DPC
EVENT_TRACE_FLAG_DRIVER
EVENT_TRACE_FLAG_FILE_IO
EVENT_TRACE_FLAG_FILE_IO_INIT
EVENT_TRACE_FLAG_IMAGE_LOAD
EVENT_TRACE_FLAG_INTERRUPT
EVENT_TRACE_FLAG_JOB
EVENT_TRACE_FLAG_MEMORY_HARD_FAULTS
EVENT_TRACE_FLAG_MEMORY_PAGE_FAULTS
EVENT_TRACE_FLAG_NETWORK_TCPIP
EVENT_TRACE_FLAG_NO_SYSCONFIG
EVENT_TRACE_FLAG_PROCESS
EVENT_TRACE_FLAG_PROCESS_COUNTERS
EVENT_TRACE_FLAG_PROFILE
EVENT_TRACE_FLAG_REGISTRY
EVENT_TRACE_FLAG_SPLIT_IO
EVENT_TRACE_FLAG_SYSTEMCALL
EVENT_TRACE_FLAG_THREAD
EVENT_TRACE_FLAG_VAMAP
EVENT_TRACE_FLAG_VIRTUAL_ALLOC
Typical case: profile a Python script that uses CUDA
nsys profile --trace=cuda,cudnn,cublas,osrt,nvtx
    --cudabacktrace=all --python-backtrace=cuda --python-sampling=true
    --delay=60 python my_dnn_script.py
Effect: Launch a Python script and start profiling it 60 seconds after the launch, tracing CUDA, cuDNN, cuBLAS, OS runtime APIs, and NVTX as well as collecting CPU IP and Python call stack samples and thread scheduling information. CUDA and Python call stacks are also collected on CUDA API calls.
Typical case: profile a Python script that uses PyTorch and CUDA
nsys profile --trace=cuda,cudnn,cublas,osrt,nvtx --pytorch=functions-trace-shapes,autograd-nvtx
    --cudabacktrace=all --python-backtrace=cuda --python-sampling=true
    --delay=60 python my_torch_script.py
Effect: Launch a Python script and start profiling it 60 seconds after the
launch, tracing CUDA, cuDNN, cuBLAS, OS runtime APIs, and NVTX as well as
collecting CPU IP and Python call stack samples and thread scheduling information.
PyTorch functions are traced, and tensor shapes are collected via --pytorch=functions-trace-shapes
to provide detailed information about the structure and execution of the neural network model.
CUDA and Python call stacks are also collected on CUDA API calls.
Typical case: profile an app that uses Vulkan
nsys profile --trace=vulkan,osrt,nvtx
    --delay=60 ./myapp
Effect: Launch an app and start profiling it 60 seconds after the launch, tracing Vulkan, OS runtime APIs, and NVTX as well as collecting CPU sampling and thread schedule information.
Example Interactive CLI Command Sequences#
Collect from beginning of application, end manually
nsys start --stop-on-exit=false
nsys launch --trace=cuda,nvtx --sample=none <application> [application-arguments]
nsys stop
Effect: Create interactive CLI process and set it up to begin collecting as soon as an application is launched. Launch the application, set up to allow tracing of CUDA and NVTX as well as collection of thread schedule information. Stop only when explicitly requested. Generate the report#.nsys-rep in the default location.
Note
If you start a collection and fail to stop the collection (or if you are allowing it to stop on exit, and the application runs for too long), your system’s storage space may be filled with collected data causing significant issues for the system. Nsight Systems will collect a different amount of data/sec depending on options, but in general Nsight Systems does not support runs of more than 5 minutes duration.
Run application, begin collection manually, run until process ends
nsys launch -w true <application> [application-arguments]
nsys start
Effect: Create interactive CLI and launch an application set up for default analysis. Send application output to the terminal. No data is collected until you manually start collection at area of interest. Profile until the application ends. Generate the report#.nsys-rep in the default location.
Note
If you launch an application and that application and any descendants exit before start is called, Nsight Systems will create a fully formed .nsys-rep file containing no data.
Run application, name the session, keep only the last seconds
nsys start --session-new=mysession
nsys launch --session=mysession myapp [application-arguments]
nsys stop --session=mysession --keep=3
Effect: Create named interactive CLI process and launch your app with default collection options. Manually stop that session and keep only the last three seconds of data.
Note
Currently Nsight Systems will collect all the data and then trim the data at stop time. In the future we will add an option that does the collection in a ring buffer, so that if the user knows ahead of time how many seconds of data they wish to save we can avoid using unneeded memory.
Run application, start/stop collection using cudaProfilerStart/Stop
nsys start -c cudaProfilerApi
nsys launch -w true <application> [application-arguments]
Effect: Create interactive CLI process and set it up to begin collecting as soon
as a cudaProfileStart() is detected. Launch application for default analysis,
sending application output to the terminal. Stop collection at next call to
cudaProfilerStop, when the user calls nsys stop, or when the root process
terminates. Generate the report#.nsys-rep in the default location.
Note
If you call nsys launch before nsys start -c cudaProfilerApi and the
code contains a large number of short duration cudaProfilerStart/Stop pairs,
Nsight Systems may be unable to process them correctly, causing a fault. This
will be corrected in a future version.
Note
Use the Nsight Systems CLI option --capture-range-end-repeat to capture
a separate report file for each capture range defined by calls to
cudaProfilerStart/Stop. To avoid overwriting report files unexpectedly,
Nsight Systems will ignore the --force-overwrite option in this case.
Run application, start/stop collection using NVTX
nsys start -c nvtx
nsys launch -w true -p MESSAGE@DOMAIN <application> [application-arguments]
Effect: Create interactive CLI process and set it up to begin collecting as soon
as an NVTX range with a given message in a given domain (capture range) is opened.
Launch application for default analysis, sending application output to the
terminal. Stop collection when all capture ranges are closed, when the user
calls nsys stop, or when the root process terminates. Generate the
report#.nsys-rep in the default location.
Note
The Nsight Systems CLI only triggers the profiling session for the first capture range.
NVTX capture range can be specified:
Message@Domain: All ranges with given message in given domain are capture ranges. For example:
nsys launch -w true -p profiler@service ./app
This would make the profiling start when the first range with message “profiler” is opened in domain “service.”
Message@*: All ranges with given message in all domains are capture ranges. For example:
nsys launch -w true -p profiler@* ./app
This would make the profiling start when the first range with message “profiler” is opened in any domain.
Message: All ranges with given message in default domain are capture ranges. For example:
nsys launch -w true -p profiler ./app
This would make the profiling start when the first range with message “profiler” is opened in the default domain.
By default, only messages provided by NVTX registered strings are considered. This avoids the need to perform a string match on every NVTX string encountered in the application, which creates significant additional overhead. It is strongly recommended to always use NVTX registered strings. If you do not use registered strings you will have to enable the full match by launching your application with
NSYS_NVTX_PROFILER_REGISTER_ONLY=0environment:nsys launch -w true -p profiler@service -e NSYS_NVTX_PROFILER_REGISTER_ONLY=0 ./app
Note
The separator ‘@’ can be escaped with backslash ‘\’. If multiple separators without escape character are specified, only the last one is applied, all others are discarded.
Run application, start/stop collection multiple times
The interactive CLI supports multiple sequential collections per launch.
nsys launch <application> [application-arguments]
nsys start
nsys stop
nsys start
nsys stop
nsys shutdown --kill sigkill
Effect: Create interactive CLI and launch an application set up for default
analysis. Send application output to the terminal. No data is collected until
the start command is executed. Collect data from start until stop requested,
generate report#.qstrm in the current working directory. Collect data from
second start until the second stop request, generate report#.nsys-rep
(incremented by one) in the current working directory. Shutdown the interactive
CLI and send sigkill to the target application’s process group.
Collect multiple regions of interest, defer report generation
nsys launch --trace=cuda,nvtx <application> [application-arguments]
nsys start -o region_1
nsys stop --defer-report
nsys start -o region_2
nsys stop --defer-report
nsys start -o region_3
nsys stop --defer-report
nsys shutdown
nsys finalize list
nsys finalize
Effect: Launch a long-running application and collect multiple regions of
interest. Each stop --defer-report returns quickly because report
generation is deferred, allowing the next start to begin without delay.
After all collections are complete, use nsys finalize list to see the
pending deferred collections and nsys finalize to generate the
.nsys-rep report files. Output name substitution patterns (%h,
%q{}, %p, %n, %%) are supported.
To finalize a specific collection, pass its UUID from the list output:
nsys finalize --id <uuid-from-list>
To discard deferred collections without generating reports:
nsys finalize --discard=all
nsys finalize --discard=<uuid>
Example Stats Command Sequences#
Display default statistics
nsys stats report1.nsys-rep
Effect: Export an SQLite file named report1.sqlite from report1.nsys-rep (assuming it does not already exist). Print the default reports in column format to the console.
Note: The following two command sequences should present very similar information:
nsys profile --stats=true <application>
or
nsys profile <application>
nsys stats report1.nsys-rep
Display specific data from a report
nsys stats --report cuda_gpu_trace report1.nsys-rep
Effect: Export an SQLite file named report1.sqlite from report1.nsys-rep (assuming it does not already exist). Print the report generated by the cuda_gpu_trace script to the console in column format.
Generate multiple reports, in multiple formats, output multiple places
nsys stats --report cuda_gpu_trace --report cuda_gpu_kern_sum --report cuda_api_sum --format csv,column --output .,- report1.nsys-rep
Effect: Export an SQLite file named report1.sqlite from report1.nsys-rep (assuming it does not already exist). Generate three reports. The first, the cuda_gpu_trace report, will be output to the file report1_cuda_gpu_trace.csv in CSV format. The other two reports, cuda_gpu_kern_sum and cuda_api_sum, will be output to the console as columns of data. Although three reports were given, only two formats and outputs are given. To reconcile this, both the list of formats and outputs is expanded to match the list of reports by repeating the last element.
Submit report data to a command
nsys stats --report cuda_api_sum --format table \ --output @“grep -E (-|Name|cudaFree” test.sqlite
Effect: Open test.sqlite and run the cuda_api_sum script on that file. Generate table data and feed that into the command grep -E (-|Name|cudaFree). The grep command will filter out everything but the header, formatting, and the cudaFree data, and display the results to the console.
Note
When the output name starts with ‘@,’ it is defined as a command. The command is run, and the output of the report is piped to the command’s stdin (standard-input). The command’s stdout and stderr remain attached to the console, so any output will be displayed directly to the console.
Be aware there are some limitations in how the command string is parsed. No shell expansions (including *, ?, [], and ~) are supported. The command cannot be piped to another command, nor redirected to a file using shell syntax. The command and command arguments are split on whitespace, and no quotes (within the command syntax) are supported. For commands that require complex command line syntax, it is suggested that the command be put into a shell script file, and the script designated as the output command
Example Output from --stats Option#
The nsys stats command can be used post analysis to generate specific or personalized reports. For a default fixed set of summary statistics to be automatically generated, you can use the --stats option with the nsys profile or nsys start command to generate a fixed set of useful summary statistics.
If your run traces CUDA, these include CUDA API, Kernel, and Memory Operation statistics:
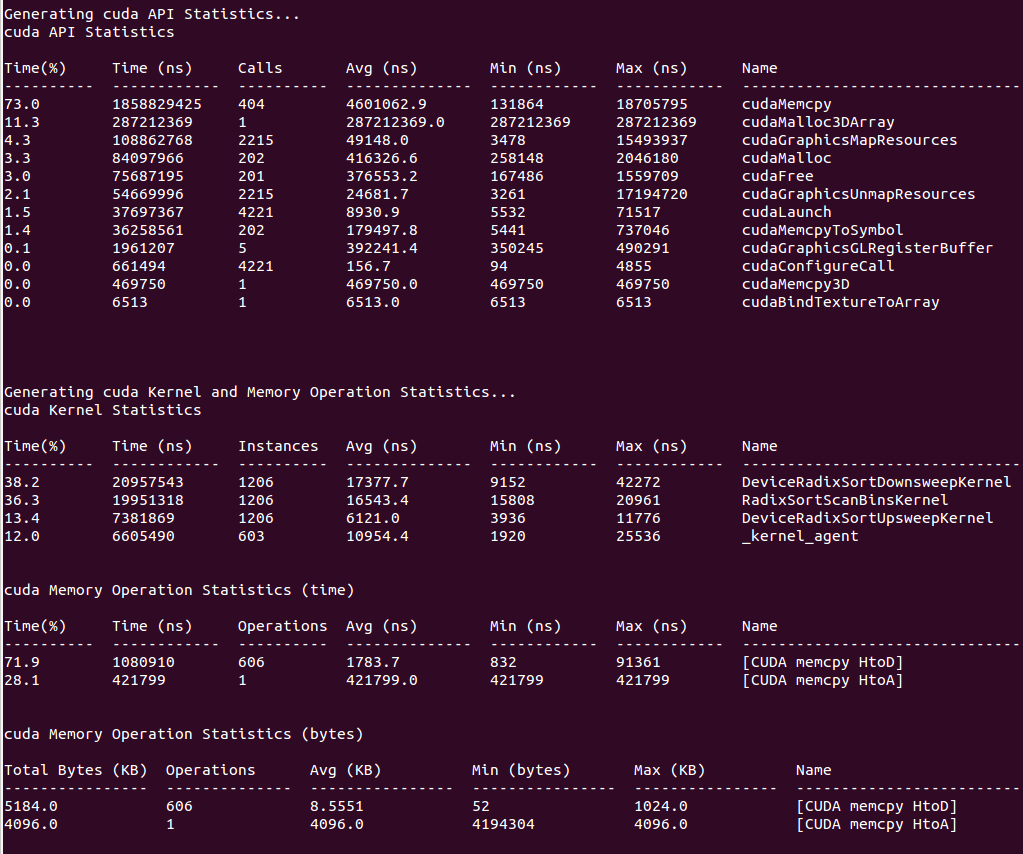
If your run traces OS runtime events or NVTX push-pop ranges:
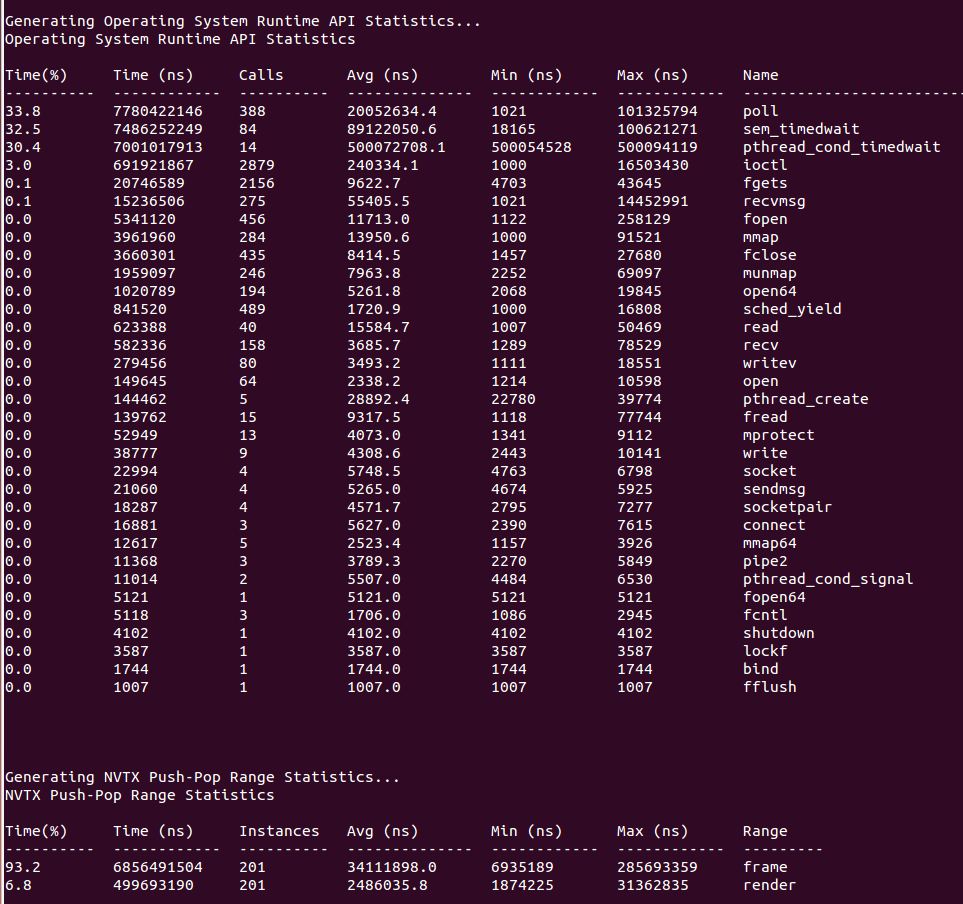
If your run traces graphics debug markers these include DX11 debug markers, DX12 debug markers, Vulkan debug markers or KHR debug markers:
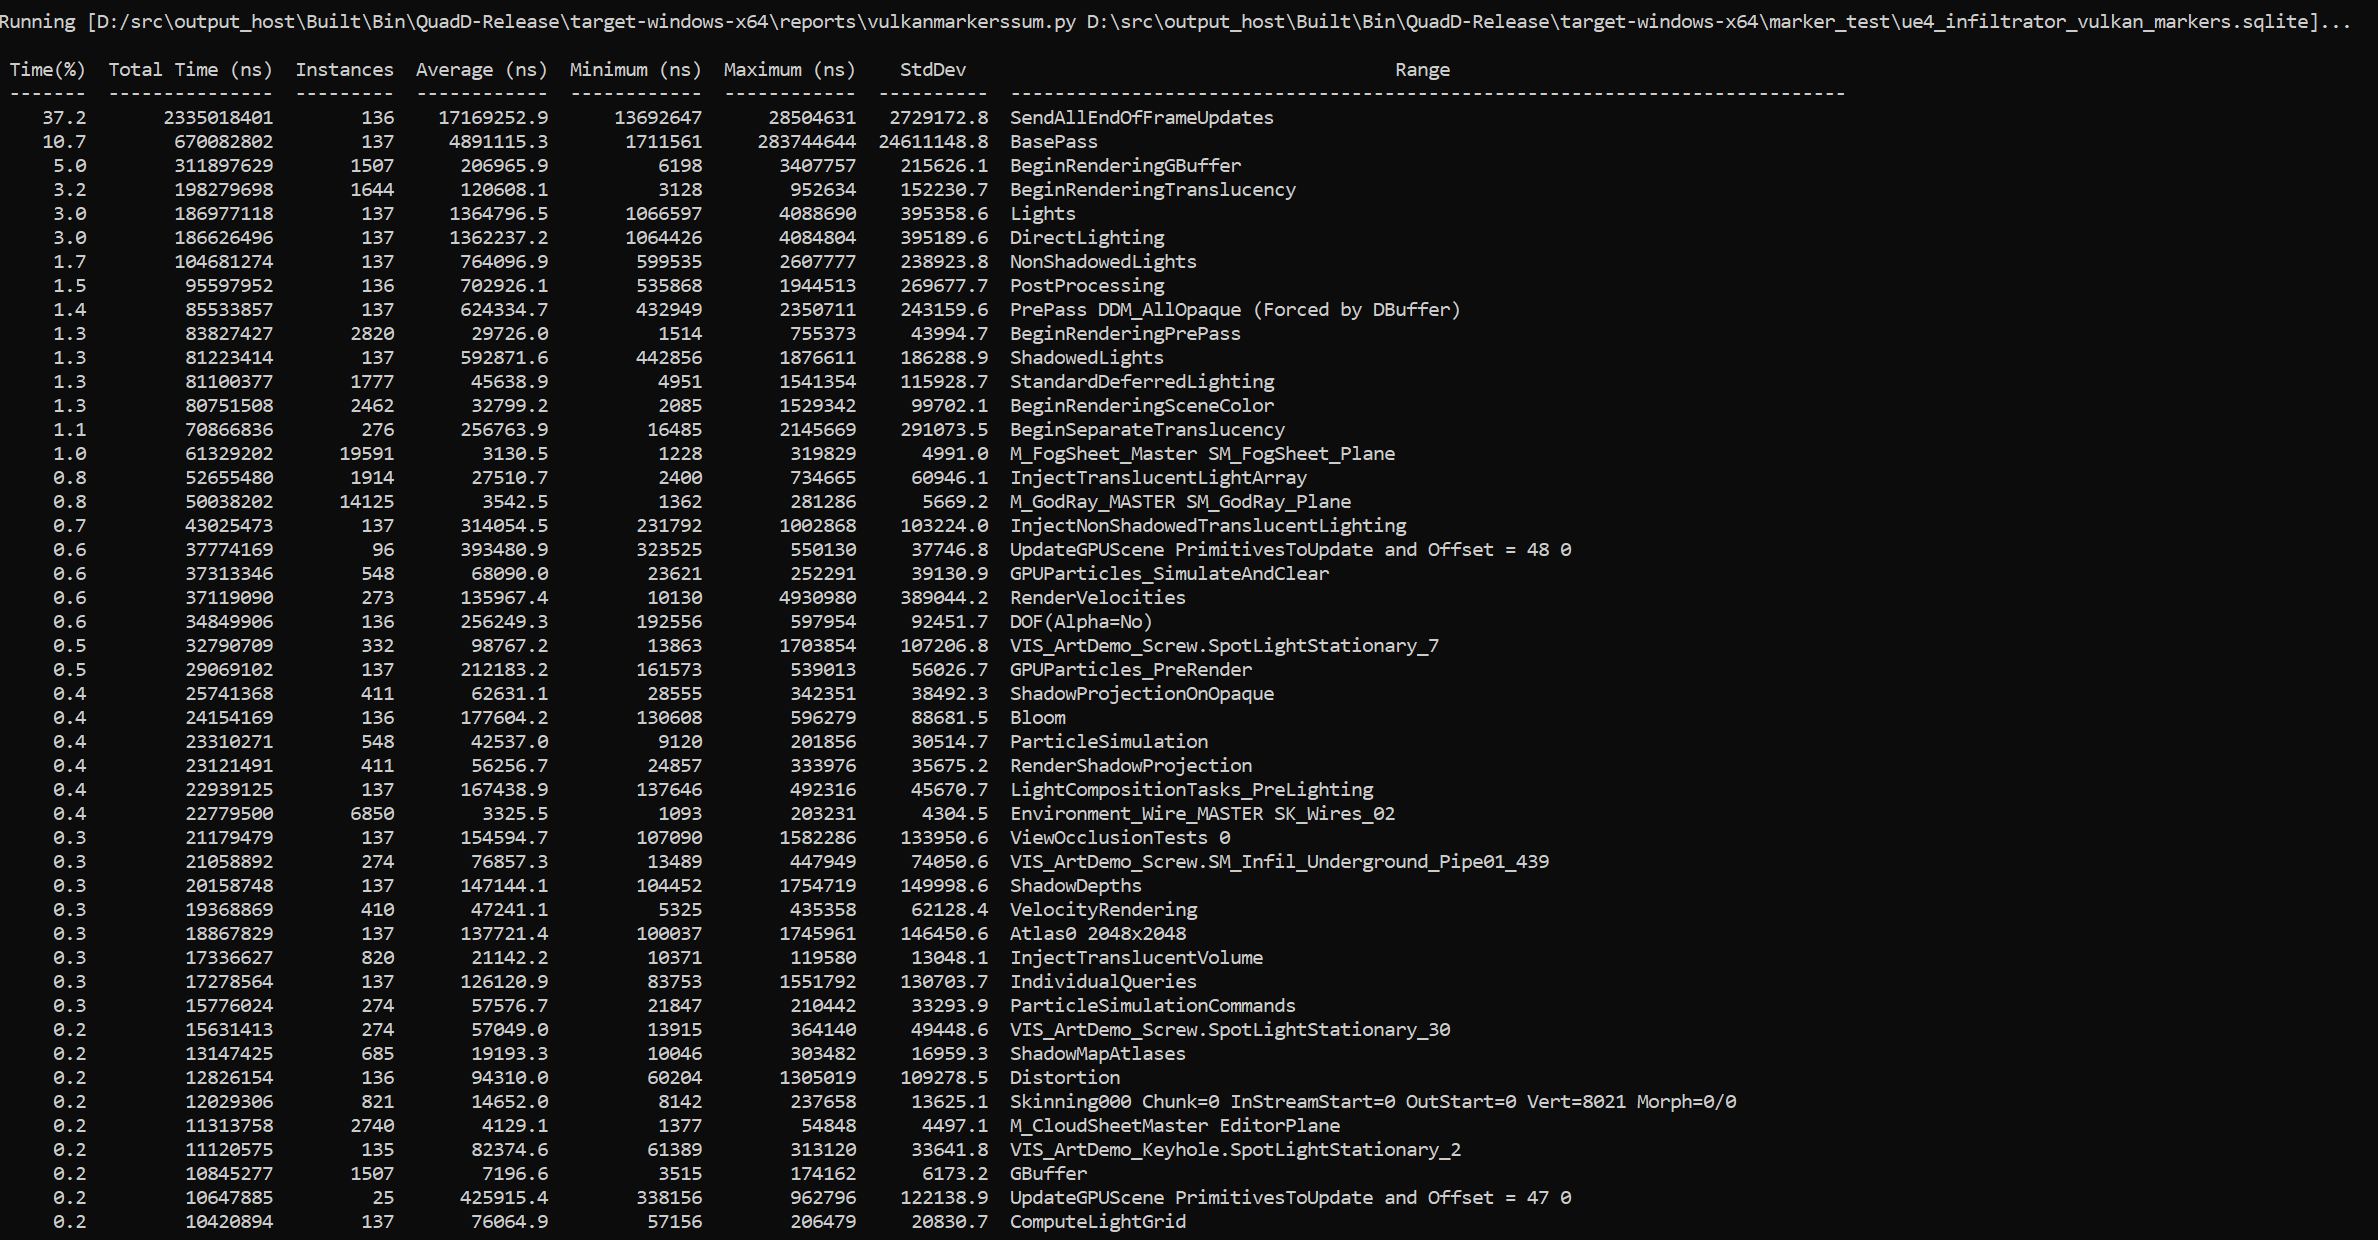
Recipes for these statistics as well as documentation on how to create your own metrics will be available in a future version of the tool.
System Wide API Trace on Windows#
On Windows, Nsight Systems can trace certain APIs (currently supported: DX11, DX12 and Vulkan) in already-running applications, by way of system-wide API trace from the CLI.
To initiate system-wide API tracing, run the Nsight Systems CLI with the
--trace option including one or more of the supported APIs, the
--system-wide option set to true, and without specifying a target
application. System-wide API tracing may be combined with trace types that are
always system-wide such as --trace=wddm.
To trace a DX11 or DX12 target application, it must gain the system focus, the user must either click on the application window or use Alt+Tab to select it.
For example, to trace multiple DX12 applications with PIX markers and GPU workload trace, as well as WDDM events for the next 20 seconds, run the command:
nsys profile --trace=dx12-annotations,wddm --dx12-gpu-workload=individual
--duration=20
Then click each of the target applications’ windows to give them focus.
To trace a Vulkan target application, it must be launched after the nsys profile
command has been executed.
Symbol Locations on Linux and QNX#
On Linux and QNX, user can specify local directories with symbol/debug files and Debuginfod symbol servers.
The list of directories with symbol files
--debug-symbolsCLI option, for example:--debug-symbols=/lib:/root/symbols
Alternatively,
DbgFileSearchPathconfig option can be used, for example:NSYS_CONFIG_DIRECTIVES='DbgFileSearchPath="/lib:/root/symbols"' nsys profile <app>
On Linux, the default path is /usr/lib/debug. On QNX, there is no default path.
The search is recursive.
Debuginfod symbol servers
Nsight Systems automatically queries and downloads missing symbols from Debuginfod servers.
Official public servers exist for Ubuntu, Debian, Fedora and other distributions.
At least one server URL should be provided by
DEBUGINFOD_URLSenvironment variable to enable Debuginfod functionality.DEBUGINFOD_URLScontains a list of Debuginfod servers (space separated URLs), example (local and public servers):export DEBUGINFOD_URLS="http://localhost:8002 https://debuginfod.ubuntu.com" nsys profile <app>
Debuginfod cache directory
Nsight Systems stores downloaded files in:
$DEBUGINFOD_CACHE_PATH/debuginfod_client- ifDEBUGINFOD_CACHE_PATHis set.Otherwise, if
XDG_CACHE_HOMEis set, then$XDG_CACHE_HOME/debuginfod_clientdirectory will be used.Otherwise, if neither DEBUGINFOD_CACHE_PATH nor XDG_CACHE_HOME are set,
$HOME/.cache/debuginfod_client/directory is the default location for downloaded files.
Nsight Systems uses cached files only if Debuginfod functionality is enabled (
DEBUGINFOD_URLSenvironment variable is set).Nsight Systems also support reading LLVM cache files (
$HOME/.cache/llvm-debuginfod/).
Nsight Systems shows the download progress (fetching the files from remote HTTP servers can take a long time, especially for system wide CPU sampling mode):
The total amount of files and how many files are already downloaded.
User is able to cancel the download process (Ctrl+C):
Press Ctrl-C to stop symbol files downloading
[1/16] Downloaded symbol information for /usr/lib/x86_64-linux-gnu/libnss_files-2.31.so
...
Opening Command Line Results Files for Visualization#
Open CLI results in GUI
The CLI will generate an .nsys-rep file after analysis is complete. This file can be opened in any GUI that is the same version or a more recent version.
The opening of really large, multi-gigabyte, .nsys-rep files may take up all of the memory on the host computer and lock up the system. This will be fixed in a later version.
Importing Windows ETL files
For Windows targets, ETL files captured with Xperf or the log.cmd command
supplied with GPUView in the Windows Performance Toolkit can be imported to
create reports as if they were captured with Nsight Systems’s “WDDM trace” and
“Custom ETW trace” features. Simply choose the .etl file from the Import dialog
to convert it to a .nsys-rep file.
Handling Application Launchers (mpirun, deepspeed, etc)#
Nsight Systems has built-in API trace support for various communication APIs,
such as MPI, OpenSHMEM, UCX, NCCL and NVSHMEM.
To execute respective programs on multiple different machines (compute nodes),
usually launchers are used, e.g., mpirun/mpiexec (MPI),
shmemrun/oshrun (OpenSHMEM), srun (SLURM) or deepspeed.
In single-node profiling sessions, the Nsight Systems CLI can be prefixed before the program (binary) or the launcher. In the latter case, the execution of the launcher will also be profiled and all processes will be recorded into the same report file, e.g for mpirun
nsys profile [nsys args] mpirun [mpirun args] ...
In multi-node profiling sessions, the Nsight Systems CLI has to be prefixed before the application, but not before the launcher command, e.g. for mpirun
mpirun [mpirun args] nsys profile [nsys args] ...
You can use %q{OMPI_COMM_WORLD_RANK} (Open MPI), %q{PMI_RANK} (MPICH),
%q{SLURM_PROCID} (Slurm) or %p in the -o|--output option to include
the rank or process ID into the report file name.
Warning
An error will occur if several processes want to write to the same report file at the same time.
Profile a Single Process or a Subset of Processes#
It might be reasonable to profile only a single or a few representative processes of a program run, e.g., to reduce the amount of measurement data.
To achieve this, a wrapper script can be used. The following script called nsys_profile.sh uses nsys to profile MPI rank 0 only.
#!/bin/bash

# Use $PMI_RANK for MPICH and $SLURM_PROCID with srun.
if [ $OMPI_COMM_WORLD_RANK -eq 0 ]; then
  nsys profile -e NSYS_MPI_STORE_TEAMS_PER_RANK=1 -t mpi "$@"
else
  "$@"
fi
You can change the profiling options accordingly and execute with
mpirun [mpirun options] ./nsys_profile.sh ./myapp [app options].
The above code can be easily adapted for OpenSHMEM and SLURM launchers.
Note
If only a subset of MPI ranks is profiled, set the environment variable
NSYS_MPI_STORE_TEAMS_PER_RANK=1 to store all members of custom MPI
communicators per MPI rank. Otherwise, the execution might hang or fail with
an MPI error.
DeepSpeed#
DeepSpeed provides a parallel launcher, which launches a Python script on multiple nodes and/or GPUs. For multi-node runs, a simple wrapper script (nsys_profile.sh) is required to profile with Nsight Systems.
#! /bin/bash
nsys profile -t cuda,mpi,nvtx,cudnn -o rname.%p python ...
This above script has to be used with the –no-python option:
deepspeed --no_python [deepspeed args] ./nsys_profile.sh
Torchrun/Pytorch#
Here is an example of using Nsight Systems to selectively profile GPUs in a multi-gpu system using torchrun.
$ cat run.py

import subprocess
import sys
import os local_rank = int(os.environ["LOCAL_RANK"])

args = sys.argv[1:]
args_string = ' '.join(args)

#Define the command to execute
print(f"Profile local rank {local_rank} only")
if local_rank == 0:
  command = "nsys profile -t cuda,nvtx -o test_run python " + args_string
else:
  command = "python " + args_string

#Run the command
subprocess.run(command, shell=True)

$ torchrun --nnodes=1 --nproc-per-node=8 run.py target_python_script.py
GPU and NIC metrics collection#
If multiple instances of nsys profile are executed concurrently on the same
node, and GPU and/or NIC metrics collection is enabled, each process will collect
metrics for all available NICs and tries to collect GPU metrics for the
specified devices. This can be avoided with a simple bash script similar to the
following:
#!/bin/bash

# Use $SLURM_LOCALID with srun.
if [ $OMPI_COMM_WORLD_LOCAL_RANK -eq 0 ]; then
  nsys profile --nic-metrics=lf --gpu-metrics-devices=all "$@"
else
  nsys profile "$@"
fi
This above script will collect NIC and GPU metrics only for one rank, the node-local rank 0. Alternatively, if one rank per GPU is used, the GPU metrics devices can be specified based on the node-local rank in a wrapper script as follows:
#!/bin/bash

# Use $SLURM_LOCALID with srun.
nsys profile -e CUDA_VISIBLE_DEVICES=${OMPI_COMM_WORLD_LOCAL_RANK} \
  --gpu-metrics-devices=${OMPI_COMM_WORLD_LOCAL_RANK} "$@"
Profiling from the GUI#
The GUI launch script, nsys-ui, is located in the host directory in your
Nsight Systems installation.
Profiling Linux Targets from the GUI#
Connecting to the Target Device#
Nsight Systems provides a simple interface to profile on localhost or manage multiple connections to Linux or Windows based devices via SSH. The network connections manager can be launched through the device selection dropdown:
On x86_64:
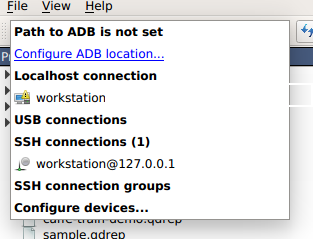
On Tegra:
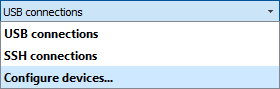
The dialog has simple controls that allow adding, removing, and modifying connections:
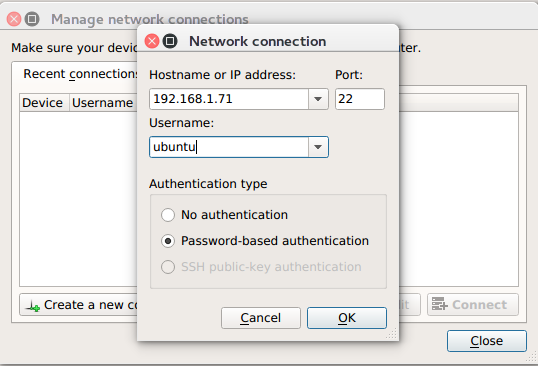
Warning
Security notice: SSH is only used to establish the initial connection to a target device, perform checks, and upload necessary files. The actual profiling commands and data are transferred through a raw, unencrypted socket. Nsight Systems should not be used in a network setup where attacker-in-the-middle attack is possible, or where untrusted parties may have network access to the target device.
While connecting to the target device, you will be prompted to input the user’s password. Note that if you choose to remember the password, it will be stored in plain text in the configuration file on the host. Stored passwords are bound to the public key fingerprint of the remote device.
The No authentication option is useful for devices configured for
passwordless login using root username. To enable such a configuration, edit
the file /etc/ssh/sshd_config on the target and specify the following option:
PermitRootLogin yes
Then set empty password using passwd and restart the SSH service with service ssh restart.
Open ports: The Nsight Systems agent requires port 22 and port 45555 to be open for listening. You can confirm that these ports are open with the following command:
sudo firewall-cmd --list-ports --permanent
sudo firewall-cmd --reload
To open a port use the following command, skip --permanent option to open only for this session:
sudo firewall-cmd --permanent --add-port 45555/tcp
sudo firewall-cmd --reload
Likewise, if you are running on a cloud system, you must open port 22 and port 45555 for ingress.
Kernel Version Number - To check for the version number of the kernel support of Nsight Systems on a target device, run the following command on the remote device:
cat /proc/quadd/version
Minimal supported version is 1.82.
Additionally, presence of Netcat command (nc) is required on the target
device. For example, on Ubuntu this package can be installed using the following
command:
sudo apt-get install netcat-openbsd
System-Wide Profiling Options#
Target Sampling Options#
Target sampling behavior is somewhat different for Nsight Systems Workstation Edition and Nsight Systems Embedded Platforms Edition.
Hotkey Trace Start/Stop#
Nsight Systems Workstation Edition can use hotkeys to control profiling. Press the hotkey to start and/or stop a trace session from within the target application’s graphic window. This is useful when tracing games and graphic applications that use fullscreen display. In these scenarios, switching to Nsight Systems’ UI would unnecessarily introduce the window manager’s footprint into the trace. To enable the use of Hotkey, check the Hotkey checkbox in the project settings page:
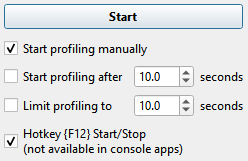
The default hotkey is F12.
Launching Processes#
Nsight Systems can launch new processes for profiling on target devices. The profiler ensures that all environment variables are set correctly to successfully collect trace information
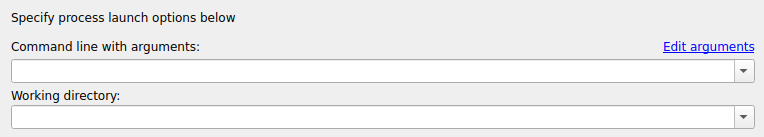
The Edit arguments… link will open an editor window, where every command line argument is edited on a separate line. This is convenient when arguments contain spaces or quotes.
Profiling Windows Targets from the GUI#
Profiling on Windows devices is similar to the profiling on Linux devices. Please refer to the Profiling Linux Targets from the GUI section for the detailed documentation and connection information. The major differences on the platforms are listed below:
Remoting to a Windows Based Machine#
To perform remote profiling to a target Windows based machines, install and configure an OpenSSH Server on the target machine..
Hotkey Trace Start/Stop#
Nsight Systems Workstation Edition can use hotkeys to control profiling. Press the hotkey to start and/or stop a trace session from within the target application’s graphic window. This is useful when tracing games and graphic applications that use fullscreen display. In these scenarios, switching to Nsight Systems’ UI would unnecessarily introduce the window manager’s footprint into the trace. To enable the use of Hotkey, check the Hotkey checkbox in the project settings page:
The default hotkey is F12.
Changing the Default Hotkey Binding - A different hotkey binding can be configured by setting the HotKeyIntValue configuration field in the config.ini file.
Set the decimal numeric identifier of the hotkey you would like to use for triggering start/stop from the target app graphics window. The default value is 123 which corresponds to 0x7B, or the F12 key.
Virtual key identifiers are detailed in MSDN’s Virtual-Key Codes.
Note that you must convert the hexadecimal values detailed in this page to their decimal counterpart before using them in the file. For example, to use the F1 key as a start/stop trace hotkey, use the following settings in the config.ini file:
HotKeyIntValue=112
Target Sampling Options on Windows#
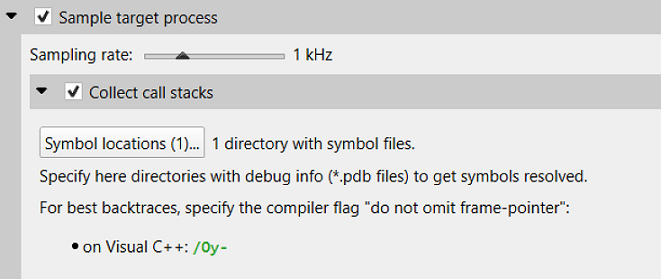
Nsight Systems can sample one process tree. Sampling here means interrupting each processor periodically. The sampling rate is defined in the project settings and is either 100Hz, 1KHz (default value), 2Khz, 4KHz, or 8KHz.
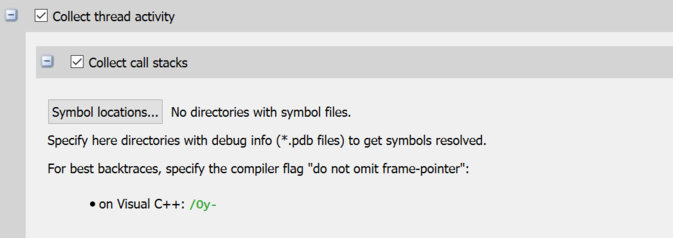
On Windows, Nsight Systems can collect thread activity of one process tree. Collecting thread activity means that each thread context switch event is logged and (optionally) a backtrace is collected at the point that the thread is scheduled back for execution. Thread states are displayed on the timeline.
If it was collected, the thread backtrace is displayed when hovering over a region where the thread execution is blocked.
Symbol Locations#
Symbol resolution happens on host, and therefore does not affect performance of profiling on the target.
Press the Symbol locations… button to open the Configure debug symbols location dialog.
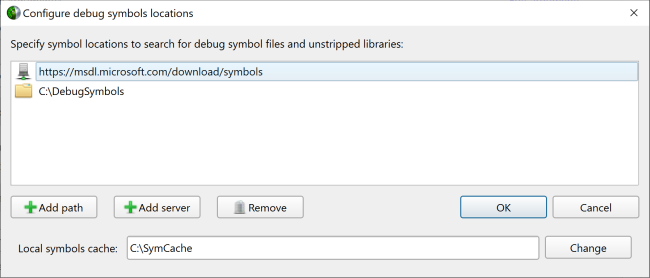
Use this dialog to specify:
Paths of PDB files
Symbols servers
The location of the local symbol cache
To use a symbol server:
Install Debugging Tools for Windows, a part of the Windows 10 SDK.
Add the symbol server URL using the Add Server button.
Information about Microsoft’s public symbol server, which enables getting Windows operating system related debug symbols can be found here.
Profiling QNX Targets from the GUI#
Profiling on QNX devices is similar to the profiling on Linux devices. Please refer to the Profiling Linux Targets from the GUI section for the detailed documentation. The major differences on the platforms are listed below:
Backtrace sampling is not supported. Instead backtraces are collected for long OS runtime libraries calls. Please refer to the OS Runtime Libraries Trace section for the detailed documentation.
CUDA support is limited to CUDA 9.0+.
Filesystem on QNX device might be mounted read-only. In that case Nsight Systems is not able to install target-side binaries, required to run the profiling session. Please make sure that target filesystem is writable before connecting to QNX target. For example, make sure the following command works:
echo XX > /xx && ls -l /xx
Nsight Streamer for Nsight Systems#
A self-hosted NVIDIA Nsight Systems GUI running inside a Docker container enables remote access through a web browser. This configuration is particularly useful for analyzing data on remote servers or clusters.
For more information and instructions on running the container, visit: Nsight Streamer for Nsight Systems on NGC
GUI VNC container#
Nsight Systems provides a build script to build a self-isolated Docker container with the Nsight Systems GUI and VNC server.
You can find the build.py script in the host-linux-x64/Scripts/VncContainer
directory (or similar on other architectures) under your Nsight Systems
installation directory. You will need to have
Docker, and Python 3.5 or later.
Available Parameters
Short Name |
Full Name |
Description |
|---|---|---|
|
(optional) Default password for VNC access (at least 6 characters). If it is specified and empty user will be asked during the build. Can be changed when running a container. |
|
-aba |
|
(optional) Additional arguments, which will be passed to the
|
-hd |
|
(optional) The directory with Nsight Systems host binaries (with GUI). |
-td |
|
(optional, repeatable) The directory with Nsight Systems target binaries (can be specified multiple times). |
|
(optional) Use TigerVNC instead of x11vnc. |
|
|
(optional) Install noVNC in the Docker container for HTTP access. |
|
|
(optional) Install xRDP in the Docker for RDP access. |
|
|
(optional) Default VNC server resolution in the format WidthxHeight (default 1920x1080). |
|
|
(optional) The directory to save temporary files (with the write access for the current user). By default, script or tmp directory will be used. |
Ports
These ports can be published from the container to provide access to the Docker container:
Port |
Purpose |
Condition |
|---|---|---|
TCP 5900 |
Port for VNC access |
|
TCP 80 (optional) |
Port for HTTP access to noVNC server |
Container is build with |
TCP 3389 (optional) |
Port for RDP access |
Container is build with |
Volumes
Docker folder |
Purpose |
Description |
|---|---|---|
/mnt/host |
Root path for shared folders |
Folder owned by the Docker user (inner content can be accessed from Nsight Systems GUI) |
/mnt/host/Projects |
Folder with projects and reports, created by Nsight Systems UI in container |
|
/mnt/host/logs |
Folder with inner services logs |
May be useful to send reports to developers |
Environment variables
Variable Name |
Purpose |
|---|---|
VNC_PASSWORD |
Password for VNC access (at least 6 characters) |
NSYS_WINDOW_WIDTH |
Width of VNC server display (in pixels) |
NSYS_WINDOW_HEIGHT |
Height of VNC server display (in pixels) |
Examples
With VNC access on port 5916:
sudo docker run -p 5916:5900/tcp -ti nsys-ui-vnc:1.0
With VNC access on port 5916 and HTTP access on port 8080:
sudo docker run -p 5916:5900/tcp -p 8080:80/tcp -ti nsys-ui-vnc:1.0
With VNC access on port 5916, HTTP access on port 8080, and RDP access on port 33890:
sudo docker run -p 5916:5900/tcp -p 8080:80/tcp -p 33890:3389/tcp -ti nsys-ui-vnc:1.0
With VNC access on port 5916, shared “HOME” folder from the host, VNC server resolution 3840x2160, and custom VNC password:
sudo docker run -p 5916:5900/tcp -v $HOME:/mnt/host/home -e NSYS_WINDOW_WIDTH=3840 -e NSYS_WINDOW_HEIGHT=2160 -e VNC_PASSWORD=7654321 -ti nsys-ui-vnc:1.0
With VNC access on port 5916, shared “HOME” folder from the host, and the projects folder to access reports created by the Nsight Systems GUI in container:
sudo docker run -p 5916:5900/tcp -v $HOME:/mnt/host/home -v /opt/NsysProjects:/mnt/host/Projects -ti nsys-ui-vnc:1.0
Profiling within JupyterLab#
The JupyterLab Nsight extension integrates Nsight Systems profiling into JupyterLab for profiling of Jupyter notebook cells. CUDA kernels launched by the cells as well as CUDA and Python code execution can be profiled and analyzed.
For more information and to install the extension, go to JupyterLab Nsight extension on PyPI
Basic usage of JupyterLab Nsight extension
- Install the extension by running
pip install jupyterlab-nvidia-nsight. Nsight Systems is not bundled with this extension. It should be installed separately.
- Install the extension by running
Launch (or restart) JupyterLab.
- Set Nsight Systems installation location in the extension settings (NVIDIA Nsight –> Settings…).
Leave this setting empty if Nsight Systems CLI executable is already in the system path.
- Open a notebook and enable Nsight Systems (NVIDIA Nsight –> Profiling with Nsight Systems…).
Set the desired options for nsys launch command (e.g.,
--trace=cuda,nvtx,cublas,cudnn).This restarts the JupyterLab kernel.
A new green arrow icon appears in the notebook toolbar, and can be used to profile cells execution.
(Optional) Open the generated report file in Nsight Systems GUI inside JupyterLab by double clicking on the report file.
Fallback Example - How to use Nsight Systems to profile code in individual cells of a Jupyter notebook when the extension is not available.
Launch jupyter-lab with Nsight Systems using the desired trace options. For example:
nsys launch –trace=cuda,nvtx,cublas,cudnn jupyter lab
(optional) Add NVTX ranges to the important operations in the notebook using range_push and range_pop. These NVTX ranges add information but are not used to define the profiling capture.
To profile a cell, add a shell command to
nsys startat the top of the cell and a shell command tonsys stopat the bottom of the cell. We recommend using the the absolute path tonsyson your system to make sure it is found.Save the notebook.
Run all the cells required for the code you want to profile, then run the cell you want to profile.
Each time the cell with
nsys startandnsys stopis run, a new .nsys-rep file will be generated.Open the nsys-rep file in nsys-ui.
Container, Scheduler, and Cloud Support#
Collecting Data Within a Container#
While examples in this section use Docker container semantics, other containers work much the same.
The following information assumes the reader is knowledgeable regarding Docker containers. For further information about Docker use in general, see the Docker documentation.
We strongly recommend using the CLI to profile in a container. Best container practice is to split services across containers when they do not require colocation. The Nsight Systems GUI is not needed to profile and brings in many dependencies, so the CLI is recommended. If you wish, the GUI can be in a separate side-car container you use to view your report. All you need is a shared folder between the containers. See section on GUI VNC container for more information.
Enable Docker Collection#
When starting the Docker to perform a Nsight Systems collection, additional
steps are required to enable the perf_event_open system call. This is
required in order to utilize the Linux kernel’s perf subsystem which provides
sampling information to Nsight Systems.
There are three ways to enable the perf_event_open syscall. You can enable
it by using the --privileged=true switch, adding --cap-add=SYS_ADMIN
switch to your docker run command file, or you can enable it by setting the
seccomp security profile if your system meets the requirements.
Secure computing mode (seccomp) is a feature of the Linux kernel that can be used to restrict an application’s access. This feature is available only if the kernel is enabled with seccomp support. To check for seccomp support:
$ grep CONFIG_SECCOMP= /boot/config-$(uname -r)
The official Docker documentation says:
"Seccomp profiles require seccomp 2.2.1 which is not available on Ubuntu
14.04, Debian Wheezy, or Debian Jessie. To use seccomp on these distributions,
you must download the latest static Linux binaries (rather than packages)."
Download the default seccomp profile file, default.json, relevant to your Docker
version. If perf_event_open is already listed in the file as guarded by
CAP_SYS_ADMIN, then remove the perf_event_open line. Add the following
lines under “syscalls” and save the resulting file as default_with_perf.json.
{
    "name": "perf_event_open",
    "action": "SCMP_ACT_ALLOW",
    "args": []
},
Then you will be able to use the following switch when starting the Docker to apply the new seccomp profile.
--security-opt seccomp=default_with_perf.json
Launch Docker Collection#
Here is an example command that has been used to launch a Docker for testing with Nsight Systems:
sudo nvidia-docker run --network=host --security-opt seccomp=default_with_perf.json --rm -ti caffe-demo2 bash
There is a known issue where Docker collections terminate prematurely with older versions of the driver and the CUDA Toolkit. If collection is ending unexpectedly, please update to the latest versions.
After the Docker has been started, use the Nsight Systems CLI to launch a collection within the Docker. The resulting file can be imported into the Nsight Systems host like any other CLI result.
Profiling Services in the Cloud#
Nsight Cloud is a set of utilities designed to simplify the process of launching and controlling NVIDIA tools in cloud environments. For more information and download see: NVIDIA Nsight Cloud.
Profiling Services Launched via Kubernetes (Nsight Operator)#
Nsight Systems now can provide profiling via sidecar injection without need to modify your containers or k8/helm specs.
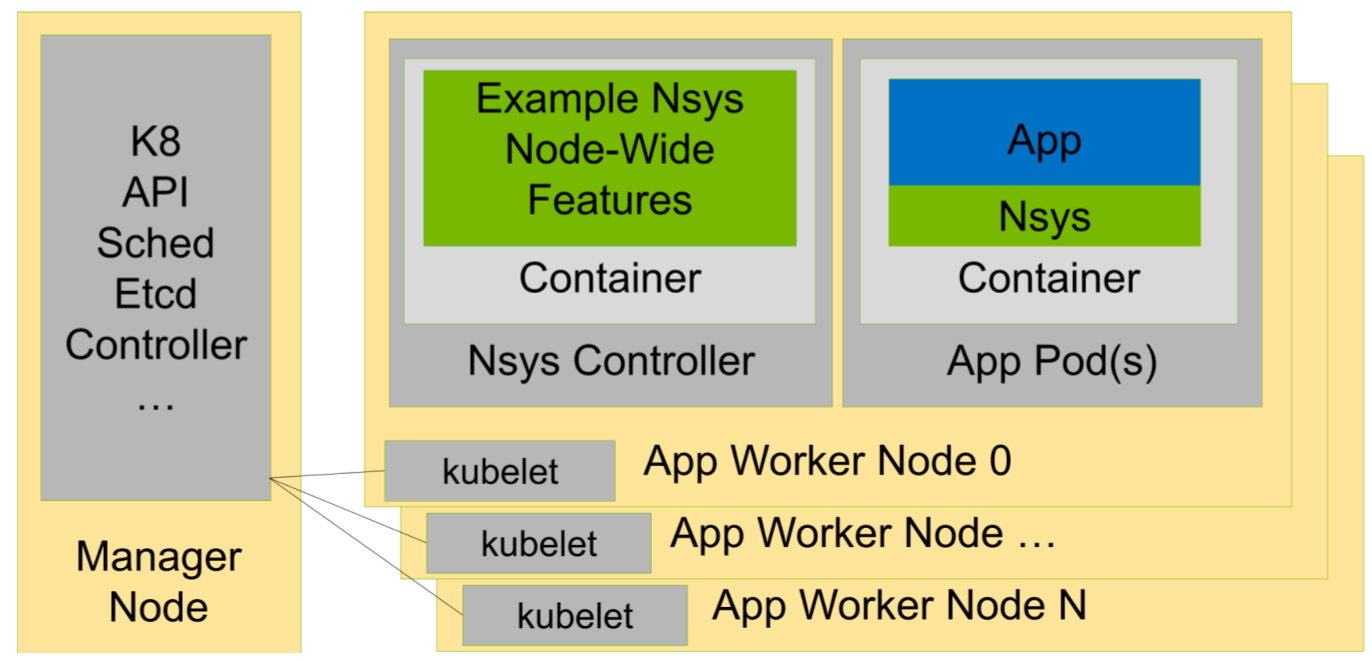
Once the sidecar is enabled, the data collected data can be filtered by namespace or pod using Kubernetes labels, or within a container process by using command-line regex.
This functionality is compatible with various cloud service provider’s in-house managed Kubernetes variants including AKS, EKS, GKE, and OKE.
Documentation and download for this sidecar is available at NGC Nsight Operator.
Streaming GUI (Nsight Streamer)#
A self-hosted NVIDIA Nsight Systems GUI running inside a Docker container enables remote access through a web browser. This configuration is particularly useful for analyzing data on remote servers or clusters.
For more information and instructions on running the container, visit: Nsight Streamer for Nsight Systems on NGC.
Profiling Slurm Jobs Running in Containers (Enroot/Pyxis or OCI)#
When jobs are launched through Slurm and executed inside a container runtime —
either Pyxis/Enroot (common on NVIDIA and HPC clusters) or a generic OCI
runtime (Docker, containerd, Podman, CRI-O) - Nsight Systems can still be used
to profile the workload, but the CLI (nsys) itself must be made available
inside the container that Slurm launches, not just on the host.
The recommended pattern is “inject, don’t rebuild”: keep nsys installed
once on the bare-metal compute node and bind-mount it into the container at
launch time, then wrap the in-container command with nsys profile exactly
as you would in a non-containerized MPI/Slurm job. This avoids baking Nsight
Systems into every container image and makes it easy to upgrade the profiler
independently of the workload.
There are three steps, regardless of the container runtime:
Install Nsight Systems (examples below use
2026.2.1) on the bare-metal Slurm compute nodes.Bind-mount that install into the container at the same absolute path via the container runtime’s configuration.
Invoke
nsys profileby absolute path (or, if you prefer, extend the container’sPATHwithout replacing it). A wrapper script is only needed when you want per-rank logic.
See also the “Handling Application Launchers (mpirun, deepspeed, etc)” and
“Enable Docker Collection” sections — the same rules about rank-based wrapper
scripts, %q{...} output templates, and perf_event_open apply here.
Install Nsight Systems on the Target Compute Nodes#
Install the same Nsight Systems build on every compute node that the Slurm job may be scheduled on, and use an identical path on all nodes, e.g.:
/opt/nvidia/nsight-systems/2026.2.1
A shared filesystem (NFS, Lustre, GPFS) works as well, as long as the path is readable on every node and on the container’s mount namespace after the bind mount is applied.
Verify on one node:
$ /opt/nvidia/nsight-systems/2026.2.1/bin/nsys --version
and confirm the printed version matches what you expect to bind-mount into the container.
Note
Keep CLI and UI versions aligned. The Nsight Systems GUI /
nsys-ui used to open a report should be the same or newer than the
CLI that produced it. Reports from a newer CLI opened in an older GUI are
the common failure mode. The .qdrep → .nsys-rep format change was
in 2021.4, so any 2021.4-or-newer GUI can at least load the file; whether
all timeline features render correctly still depends on the GUI being
≥ CLI version. Pin one version across all compute nodes so the bind mount
resolves consistently.
Host kernel requirements#
Profiling from inside a container still depends on the host kernel, so make sure the host satisfies the normal Nsight Systems requirements:
perf_event_paranoidis permissive enough on the host (typically<= 2). You can verify readiness from inside the container withnsys status --environment.The container has access to
perf_event_open— see “Enable Docker Collection” above. For OCI runtimes this means--cap-add=SYS_ADMIN,--privileged, or a custom seccomp profile that allowsperf_event_open. Enroot launches containers unprivileged and, by default, does not install Docker’s restrictive seccomp profile on top of the host policy, soperf_event_openis typically usable without extra flags — but verify withnsys status --environmentinside the container before assuming it.CUDA/NVIDIA driver libraries are already made available in the container by the runtime (NVIDIA Container Toolkit for OCI,
--container-mounts+ the NVIDIA hook for Pyxis/Enroot). The Nsight Systems bind mount does not change that.
Make nsys Visible Inside the Container#
Option A — Pyxis/Enroot via srun --container-mounts#
Pyxis (the Slurm SPANK plugin for Enroot) exposes Enroot container launches as
srun flags. The --container-mounts flag accepts
SRC:DST[:FLAGS][,SRC:DST...] (multiple flags are joined with +, e.g.
ro+rprivate). Bind-mount the host install into the container and invoke
nsys by absolute path so nothing in the image environment is modified:
srun \
  --container-image=nvcr.io#nvidia/pytorch:<tag> \
  --container-mounts=/opt/nvidia/nsight-systems/2026.2.1:/opt/nvidia/nsight-systems/2026.2.1:ro \
  /opt/nvidia/nsight-systems/2026.2.1/bin/nsys profile \
    -t cuda,nvtx,mpi \
    -o /reports/run_%q{SLURM_PROCID}_%p \
    python train.py
Key points:
--container-mounts=<host>:<container>:robind-mounts the host install read-only.rois enough — the profiler does not write inside its own install tree.Calling
nsysvia its absolute in-container path avoids touching the image’sPATHat all. If you prefernsysonPATH(for example for interactive use), append it inside the container rather than replacing the imagePATH:srun \ --container-image=nvcr.io#nvidia/pytorch:<tag> \ --container-mounts=/opt/nvidia/nsight-systems/2026.2.1:/opt/nvidia/nsight-systems/2026.2.1:ro \ --export=ALL,NSYS_PATH=/opt/nvidia/nsight-systems/2026.2.1/bin \ --container-env=NSYS_PATH \ bash -lc 'PATH="$PATH:$NSYS_PATH"; nsys profile -o /reports/run_%q{SLURM_PROCID}_%p python train.py'
If you need
nsysreports to land on a shared filesystem, also bind-mount the output directory (e.g.--container-mounts=...,/scratch/$USER/reports:/reports:rw) and pass-o /reports/...tonsys profile.
Before adding nsys to the command line, do a quick container-runtime
preflight:
srun --container-image=nvcr.io#nvidia/pytorch:<tag> /bin/true
If this fails, fix the base Pyxis/Enroot launch path first, then add
--container-mounts and profiling.
Option B — Enroot mounts.d + environ.d (recommended, image-independent)#
When you do not control the srun invocation (for example a fleet-wide
Slurm setup), Enroot can inject the mount and extend PATH via its
standard configuration directories under ENROOT_SYSCONF_PATH (default
/etc/enroot). This is the idiomatic Enroot approach and does not require
a custom hook script.
/etc/enroot/mounts.d/nsys.fstab:
# Bind-mount the host |product-name| install into every Enroot container.
/opt/nvidia/nsight-systems/2026.2.1 /opt/nvidia/nsight-systems/2026.2.1 none bind,ro,nosuid,nodev 0 0
/etc/enroot/environ.d/nsys.env:
# Make `nsys` visible on PATH inside every Enroot container.
PATH=/opt/nvidia/nsight-systems/2026.2.1/bin:${PATH}
Both files are applied automatically to every container launched via Enroot (and therefore via Pyxis). No image changes are needed.
Option C — Enroot pre-start hook (only if you need logic)#
Use a hook script only when you need conditional behavior (for example, pick
a different Nsight Systems install based on the image or the host’s GPU
family). Hooks live in /etc/enroot/hooks.d/ with a .sh extension and
run with full capabilities before the container switches to its final root.
They receive ENROOT_ROOTFS, ENROOT_MOUNTS, and ENROOT_ENVIRON.
/etc/enroot/hooks.d/50-nsys.sh:
#!/usr/bin/env bash
# Append a bind mount for |product-name| to the container's mount file,
# and add it to PATH via the environ file. Prefer mounts.d / environ.d
# unless you actually need logic here.

set -euo pipefail

: "${ENROOT_MOUNTS:?not set}"
: "${ENROOT_ENVIRON:?not set}"

NSYS_HOST_PREFIX="/opt/nvidia/nsight-systems/2026.2.1"
NSYS_IN_CONTAINER="/opt/nvidia/nsight-systems/2026.2.1"

echo "${NSYS_HOST_PREFIX} ${NSYS_IN_CONTAINER} none bind,ro,nosuid,nodev 0 0" \
    >> "${ENROOT_MOUNTS}"
echo "PATH=${NSYS_IN_CONTAINER}/bin:\${PATH}" >> "${ENROOT_ENVIRON}"
Option D — OCI runtime (Docker / Podman / containerd / CRI-O)#
For containers launched through an OCI runtime under Slurm (for example via
srun --container-... wired to a Docker or container orchestrator, or via
a site-specific launcher), declare the bind mount in the container
configuration and invoke nsys by its absolute in-container path so the
image’s own PATH and other environment variables are preserved.
Docker / Podman flags on the launch command:
docker run --rm --gpus all \
  --cap-add=SYS_ADMIN \
  -v /opt/nvidia/nsight-systems/2026.2.1:/opt/nvidia/nsight-systems/2026.2.1:ro \
  my-workload:latest \
  /opt/nvidia/nsight-systems/2026.2.1/bin/nsys profile \
    -t cuda,nvtx,mpi \
    -o /reports/run_%p \
    python train.py
Or in the OCI runtime config.json (for a container spec consumed by
runc/crun):
{
  "process": {
    "args": [
      "/opt/nvidia/nsight-systems/2026.2.1/bin/nsys",
      "profile",
      "-t", "cuda,nvtx,mpi",
      "-o", "/reports/run_%p",
      "python", "train.py"
    ]
  },
  "mounts": [
    {
      "destination": "/opt/nvidia/nsight-systems/2026.2.1",
      "type": "bind",
      "source": "/opt/nvidia/nsight-systems/2026.2.1",
      "options": ["rbind", "ro"]
    }
  ]
}
Notes for OCI runtimes:
Add
--cap-add=SYS_ADMIN(or the custom seccomp profile described in “Enable Docker Collection”) soperf_event_openis not blocked.Calling
nsysby absolute path means the image’s ownPATH(and any otherENVset by the image) is preserved. If you’d rather havensysonPATH, append inside the container (PATH="$PATH:/opt/nvidia/nsight-systems/2026.2.1/bin") instead of replacingPATHvia-e/process.env.GPU exposure is still the runtime’s responsibility (
--gpus all/ NVIDIA Container Toolkit hook /nvidia.com/gpudevice plugin). The Nsight Systems mount does not change that.If
-owrites to a host directory, add a second bind mount for it (-v /scratch/$USER/reports:/reports:rwor a correspondingmountsentry) — the profiler cannot write through a read-only mount.
Wrap the In-Container Command with nsys profile#
Once the Nsight Systems install is bind-mounted, the invocation is identical
to the non-container Slurm + MPI pattern. In multi-node jobs, the launcher
runs outside the profiler and nsys profile wraps the per-rank program:
srun [srun args] \
  --container-image=... --container-mounts=... \
  /opt/nvidia/nsight-systems/2026.2.1/bin/nsys profile -t cuda,nvtx,mpi \
    -o /reports/run_%q{SLURM_PROCID}_%p \
    ./myapp [app args]
Use %q{SLURM_PROCID} (Slurm) / %q{OMPI_COMM_WORLD_RANK} (Open MPI) /
%q{PMI_RANK} (MPICH) or %p in -o so concurrent ranks do not
clobber each other’s report file. %h (hostname) and %% (literal
%) are also supported.
Warning
An error will occur if several processes want to write to the same report file at the same time.
Profiling only a subset of ranks#
To reduce trace volume, profile just a representative rank. Put a wrapper
script inside the container (or bind-mounted in) and call it instead of the
binary. Example nsys_profile.sh for Slurm:
#!/bin/bash
# Profile only the node-local rank 0. Use $SLURM_PROCID for global rank 0.
NSYS_PATH="${NSYS_PATH:-/opt/nvidia/nsight-systems/2026.2.1/bin}"
PATH="${PATH}:${NSYS_PATH}"
if [ "${SLURM_LOCALID}" -eq 0 ]; then
  nsys profile -t cuda,nvtx,mpi \
    -e NSYS_MPI_STORE_TEAMS_PER_RANK=1 \
    -o /reports/run_%q{SLURM_PROCID}_%p \
    "$@"
else
  "$@"
fi
Launch:
srun --container-image=... \
     --container-mounts=/opt/nvidia/nsight-systems/2026.2.1:/opt/nvidia/nsight-systems/2026.2.1:ro,/scratch/$USER/reports:/reports:rw \
     --export=ALL,NSYS_PATH=/opt/nvidia/nsight-systems/2026.2.1/bin \
     --container-env=NSYS_PATH \
     ./nsys_profile.sh python train.py
Note
If only a subset of MPI ranks is profiled, set
NSYS_MPI_STORE_TEAMS_PER_RANK=1 so all members of custom MPI
communicators are stored per rank. Otherwise the run may hang or fail
with an MPI error. If communicator tracking itself is the problem, it can
be disabled with NSYS_MPI_DISABLE_COMMUNICATOR_TRACKING=1.
GPU and NIC metrics with multiple ranks per node#
As in the non-container case, if more than one rank per node would enable GPU/NIC metric collection, restrict it to one rank to avoid contention:
#!/bin/bash
if [ "${SLURM_LOCALID}" -eq 0 ]; then
  nsys profile --nic-metrics=lf --gpu-metrics-devices=all "$@"
else
  nsys profile "$@"
fi
Or one rank per GPU, with metrics scoped to that GPU:
#!/bin/bash
nsys profile -e CUDA_VISIBLE_DEVICES=${SLURM_LOCALID} \
             --gpu-metrics-devices=${SLURM_LOCALID} "$@"
Troubleshooting checklist#
Symptom |
Likely cause |
Fix |
|---|---|---|
|
Bind mount missing, or |
Verify |
|
Wrong host install picked up, or a floating symlink |
Mount an explicit versioned prefix
( |
|
|
OCI: add |
Reports not visible after the job ends |
Output path is container-only |
Point |
Several ranks overwrite the same |
|
Use |
Profiler version mismatch across nodes |
Different host installs per node |
Pin the same version at the same path on every node, or use a shared filesystem. |
|
Enroot runtime dir not provisioned or not writable for the job user |
Ensure |
|
Registry endpoint resolved to a web page (e.g. |
Use an explicit registry: |
GUI refuses to open a report produced by the container |
GUI older than the CLI that recorded the report |
Upgrade the Nsight Systems GUI to match or exceed the CLI version. |
Custom ETW Trace#
Use the custom ETW trace feature to enable and collect any manifest-based ETW log. The collected events are displayed on the timeline on dedicated rows for each event type.
Custom ETW is available on Windows target machines.
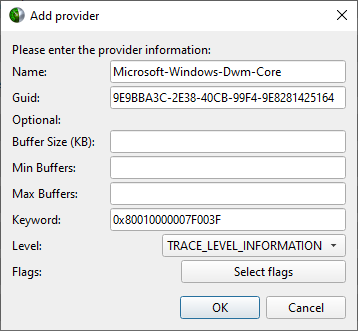
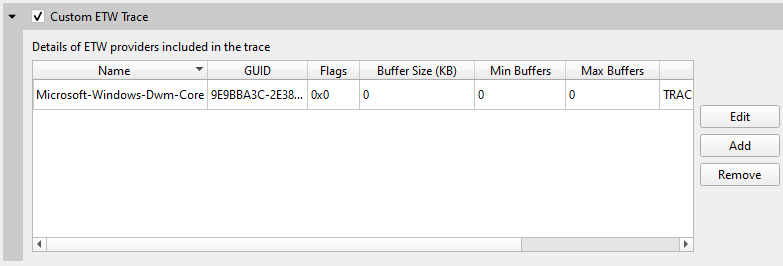
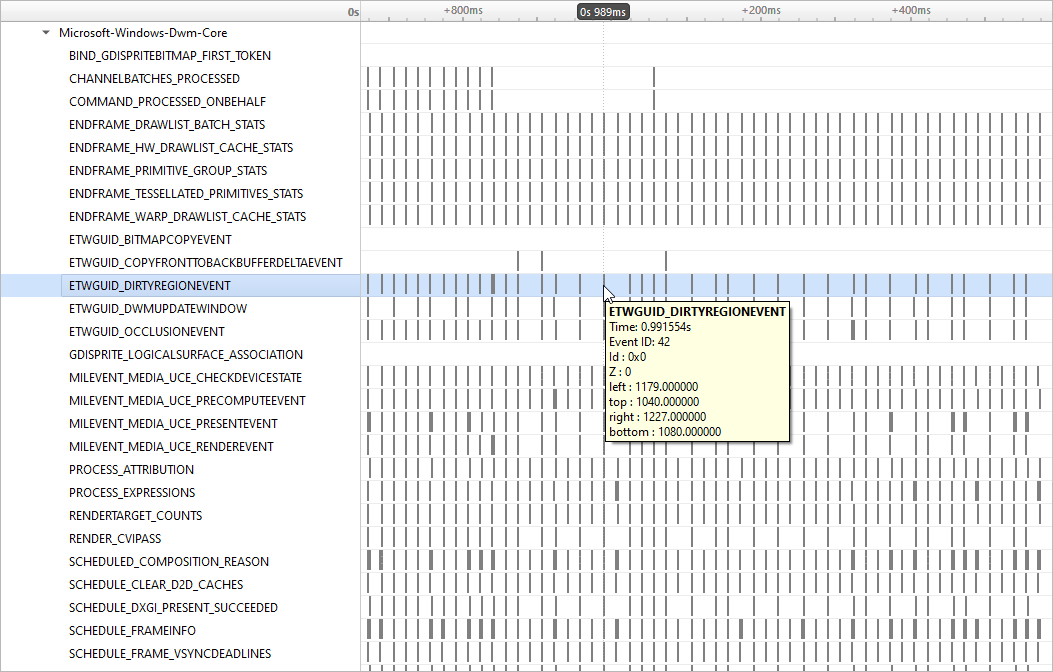
To retain the .etl trace files captured, so that they can be viewed in other tools (e.g., GPUView), change the Save ETW log files in project folder option under Profile Behavior in Nsight Systems’s global Options dialog. The .etl files will appear in the same folder as the .nsys-rep file, accessible by right-clicking the report in the Project Explorer and choosing Show in Folder…. Data collected from each ETW provider will appear in its own .etl file, and an additional .etl file named Report XX-Merged-\*.etl, containing the events from all captured sources, will be created as well.
Direct3D Trace#
Nsight Systems has the ability to trace both the Direct3D 11 API and the Direct3D 12 API on Windows targets.
D3D11 API trace#
Nsight Systems can capture information about Direct3D 11 API calls made by the profiled process. This includes capturing the execution time of D3D11 API functions, performance markers, and frame durations.
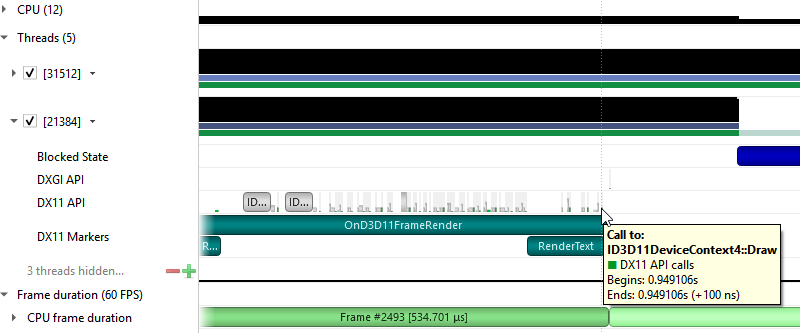
D3D12 API Trace#
Direct3D 12 is a low-overhead 3D graphics and compute API for Microsoft Windows. Information about Direct3D 12 can be found at the Direct3D 12 Programming Guide.
Nsight Systems can capture information about Direct3D 12 usage by the profiled process. This includes capturing the execution time of D3D12 API functions, corresponding workloads executed on the GPU, performance markers, and frame durations.
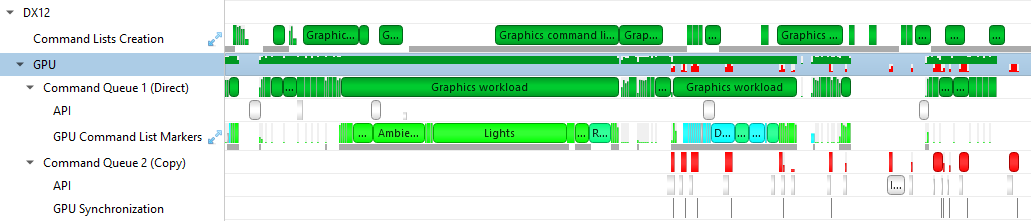
The Command List Creation row displays time periods when command lists were being created. This enables developers to improve their application’s multi-threaded command list creation. Command list creation time period is measured between the call to ID3D12GraphicsCommandList::Reset and the call to ID3D12GraphicsCommandList::Close.
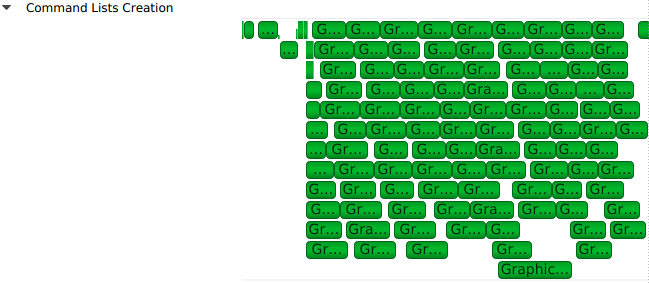
The GPU row shows a compressed view of the D3D12 queue activity, color-coded by the queue type. Expanding it will show the individual queues and their corresponding API calls.

A Command Queue row is displayed for each D3D12 command queue created by the profiled application. The row’s header displays the queue’s running index and its type (Direct, Compute, Copy).
The DX12 API Memory Ops row displays all API memory operations and non-persistent resource mappings. Event ranges in the row are color-coded by the heap type they belong to (Default, Readback, Upload, Custom, or CPU-Visible VRAM), with usage warnings highlighted in yellow. A breakdown of the operations can be found by expanding the row to show rows for each individual heap type.
The following operations and warnings are shown:
Calls to
ID3D12Device::CreateCommittedResource,ID3D12Device4::CreateCommittedResource1, andID3D12Device8::CreateCommittedResource2A warning will be reported if
D3D12_HEAP_FLAG_CREATE_NOT_ZEROEDis not set in the method’sHeapFlagsparameter.
Calls to
ID3D12Device::CreateHeapandID3D12Device4::CreateHeap1A warning will be reported if
D3D12_HEAP_FLAG_CREATE_NOT_ZEROEDis not set in theFlagsfield of the method’spDescparameter
Calls to
ID3D12Resource::ReadFromSubResourceA warning will be reported if the read is to a
D3D12_CPU_PAGE_PROPERTY_WRITE_COMBINECPU page or from aD3D12_HEAP_TYPE_UPLOADresource.
Calls to
ID3D12Resource::WriteToSubResourceA warning will be reported if the write is from a
D3D12_CPU_PAGE_PROPERTY_WRITE_BACKCPU page or to aD3D12_HEAP_TYPE_READBACKresource.
Calls to
ID3D12Resource::MapandID3D12Resource::Unmapwill be matched into [Map, Unmap] ranges for non-persistent mappings. If a mapping range is nested, only the most external range (reference count = 1) will be shown.
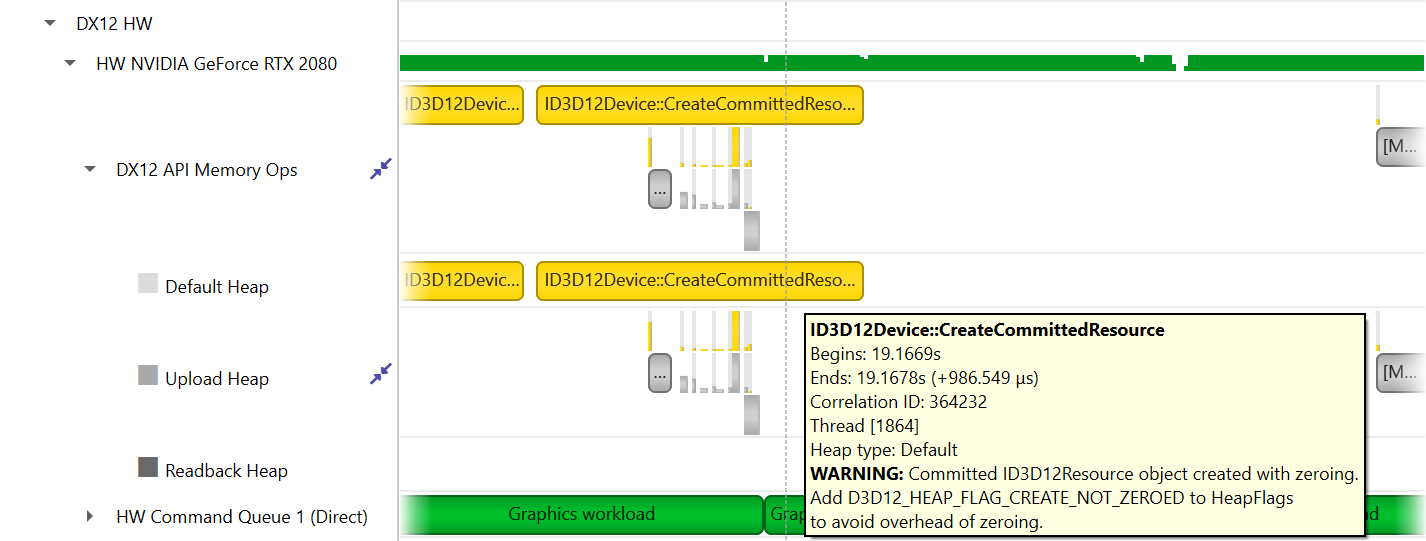
The API row displays time periods where ID3D12CommandQueue::ExecuteCommandLists was called. The GPU Workload row displays time periods where workloads were executed by the GPU. The workload’s type (Graphics, Compute, Copy, etc.) is displayed on the bar representing the workload’s GPU execution.
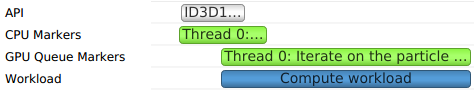
In addition, you can see the PIX command queue CPU-side performance markers, GPU-side performance markers, and the GPU Command List performance markers, each in their row.


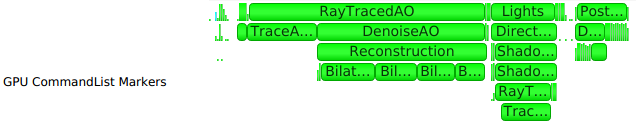
Clicking on a GPU workload highlights the corresponding ID3D12CommandQueue::ExecuteCommandLists, ID3D12GraphicsCommandList::Reset and ID3D12GraphicsCommandList::Close API calls, and vice versa.
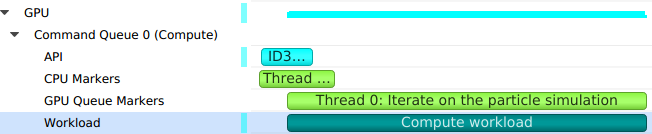
Detecting which CPU thread was blocked by a fence can be difficult in complex apps that run tens of CPU threads. The timeline view displays the 3 operations involved:
The CPU thread pushing a signal command and fence value into the command queue. This is displayed on the DX12 Synchronization sub-row of the calling thread.
The GPU executing that command, setting the fence value and signaling the fence. This is displayed on the GPU Queue Synchronization sub-row.
The CPU thread calling a Win32 wait API to block-wait until the fence is signaled. This is displayed on the Thread’s OS runtime libraries row.
Clicking one of these will highlight it and the corresponding other two calls.
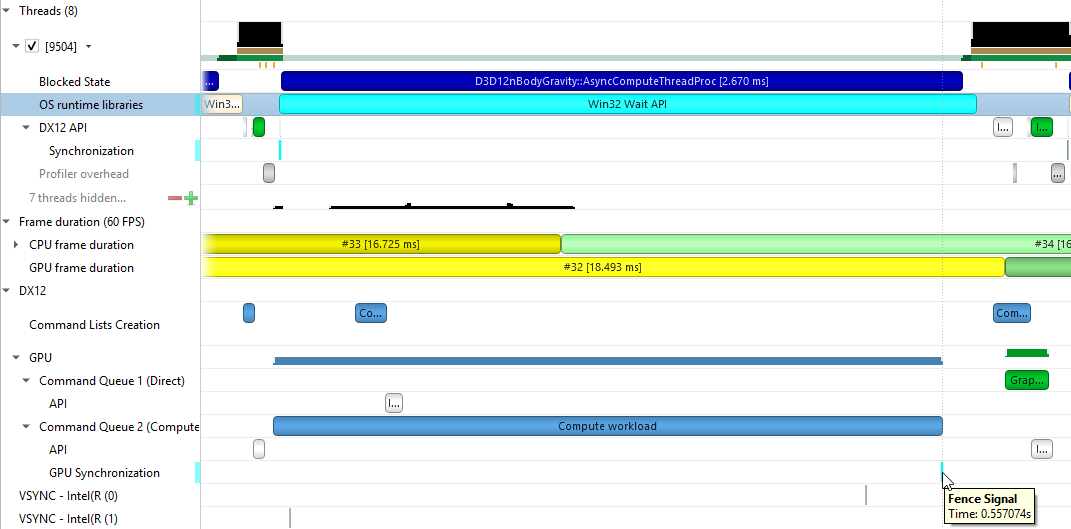
Nsight Systems D3D12 trace captures D3D12 Work Graphs dispatch calls to DispatchGraph and time boundaries of the GPU execution of the work graph.
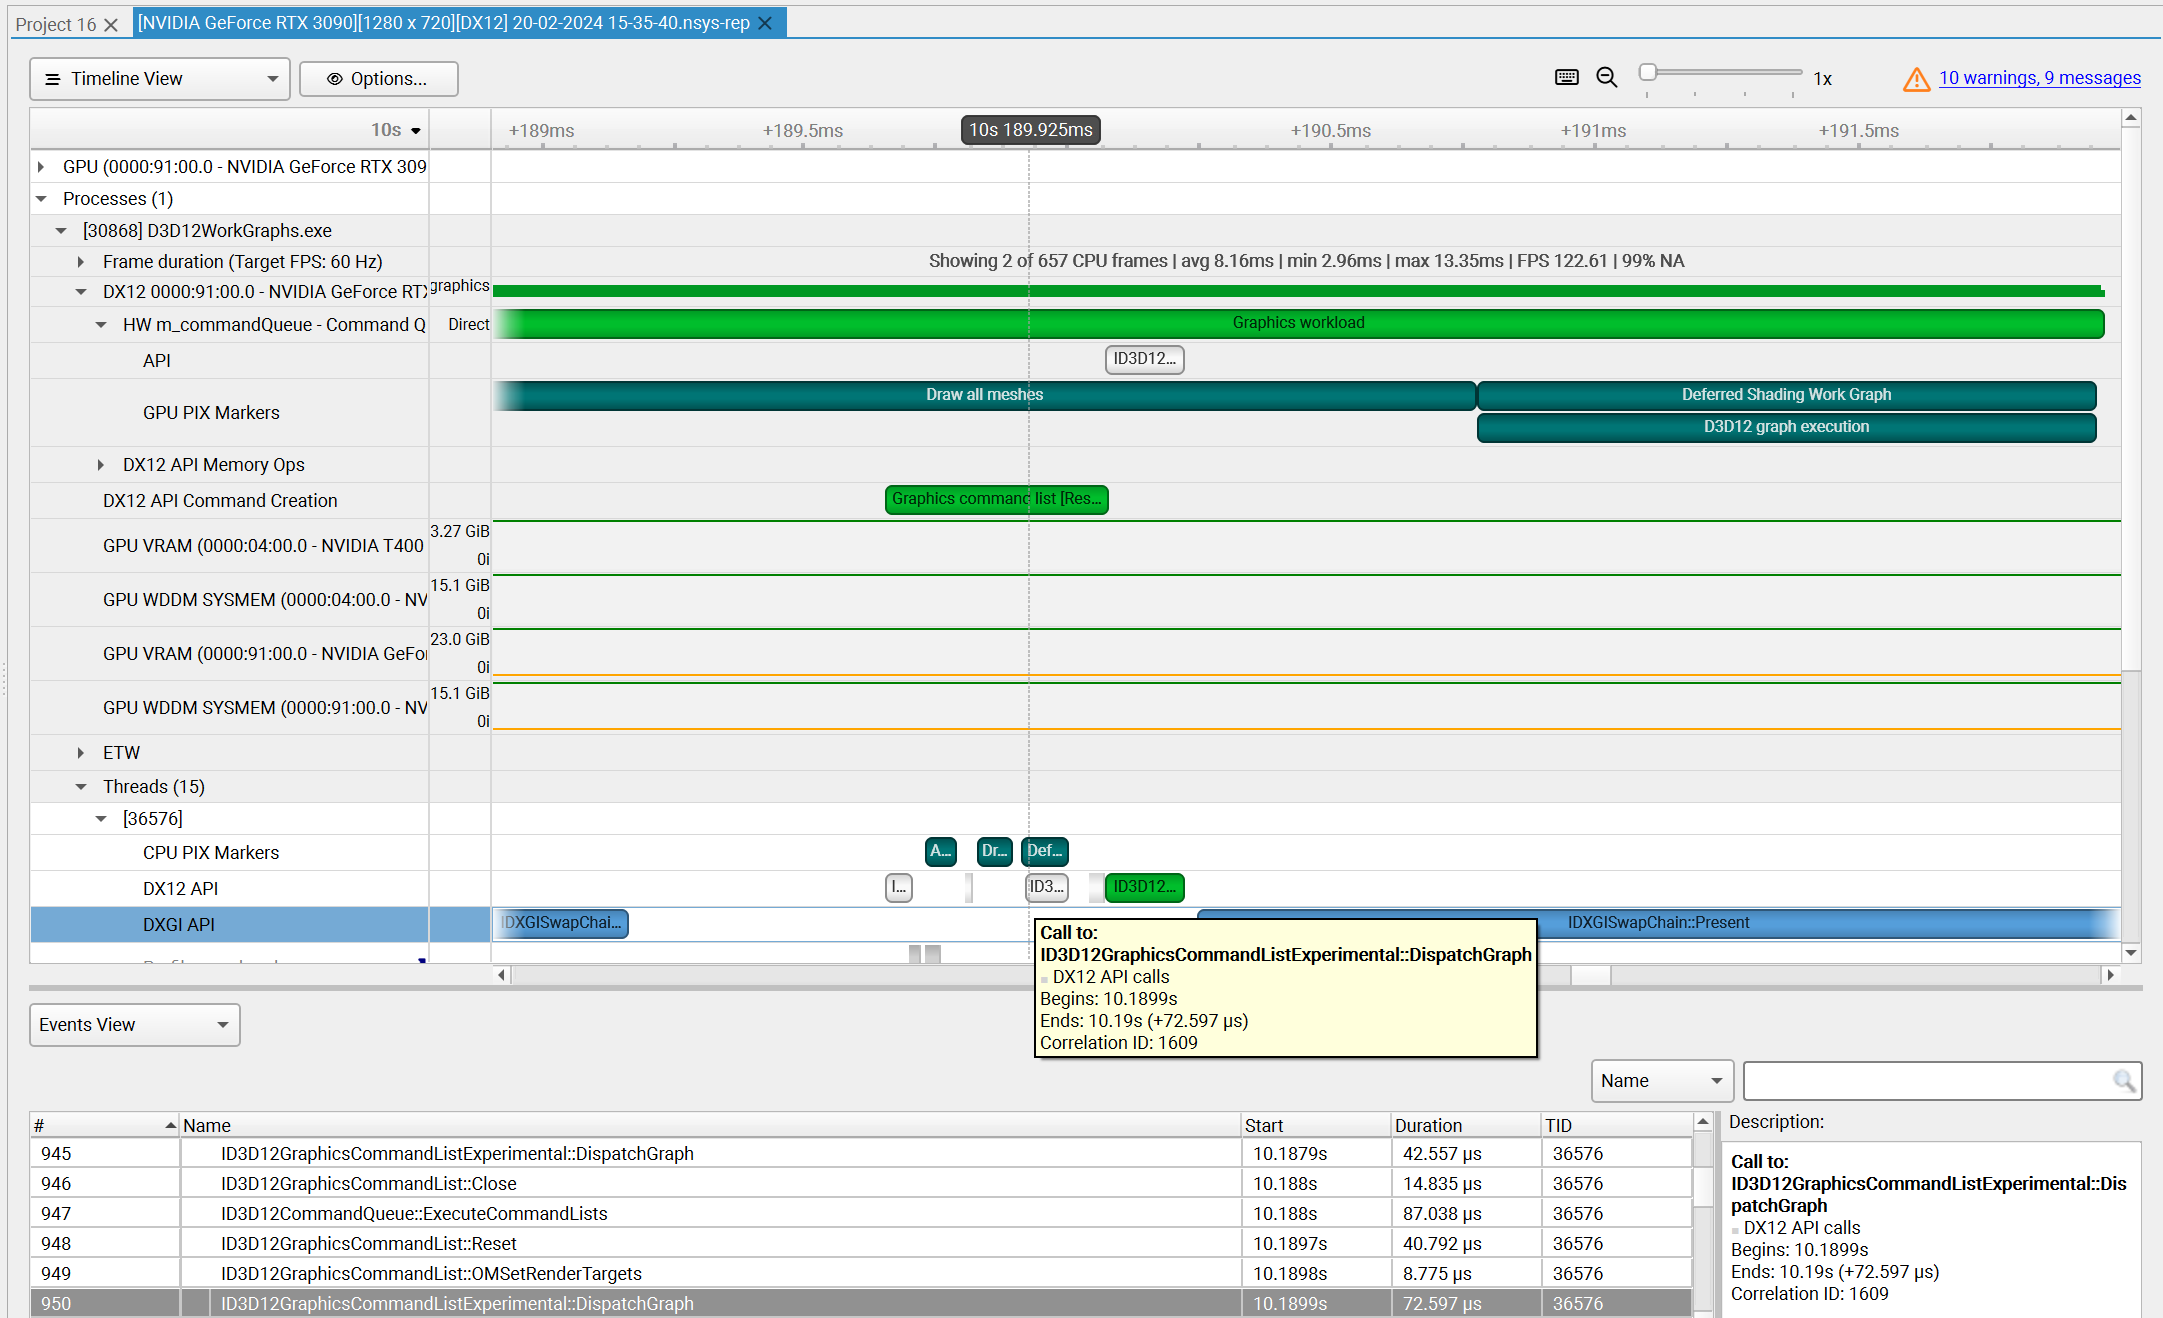
The DX12 API row displays ID3D12GraphicsCommandList10::DispatchGraph calls. The GPU PIX Markers row marks graph execution by the GPU with a custom marker captioned “D3D12 graph execution.”
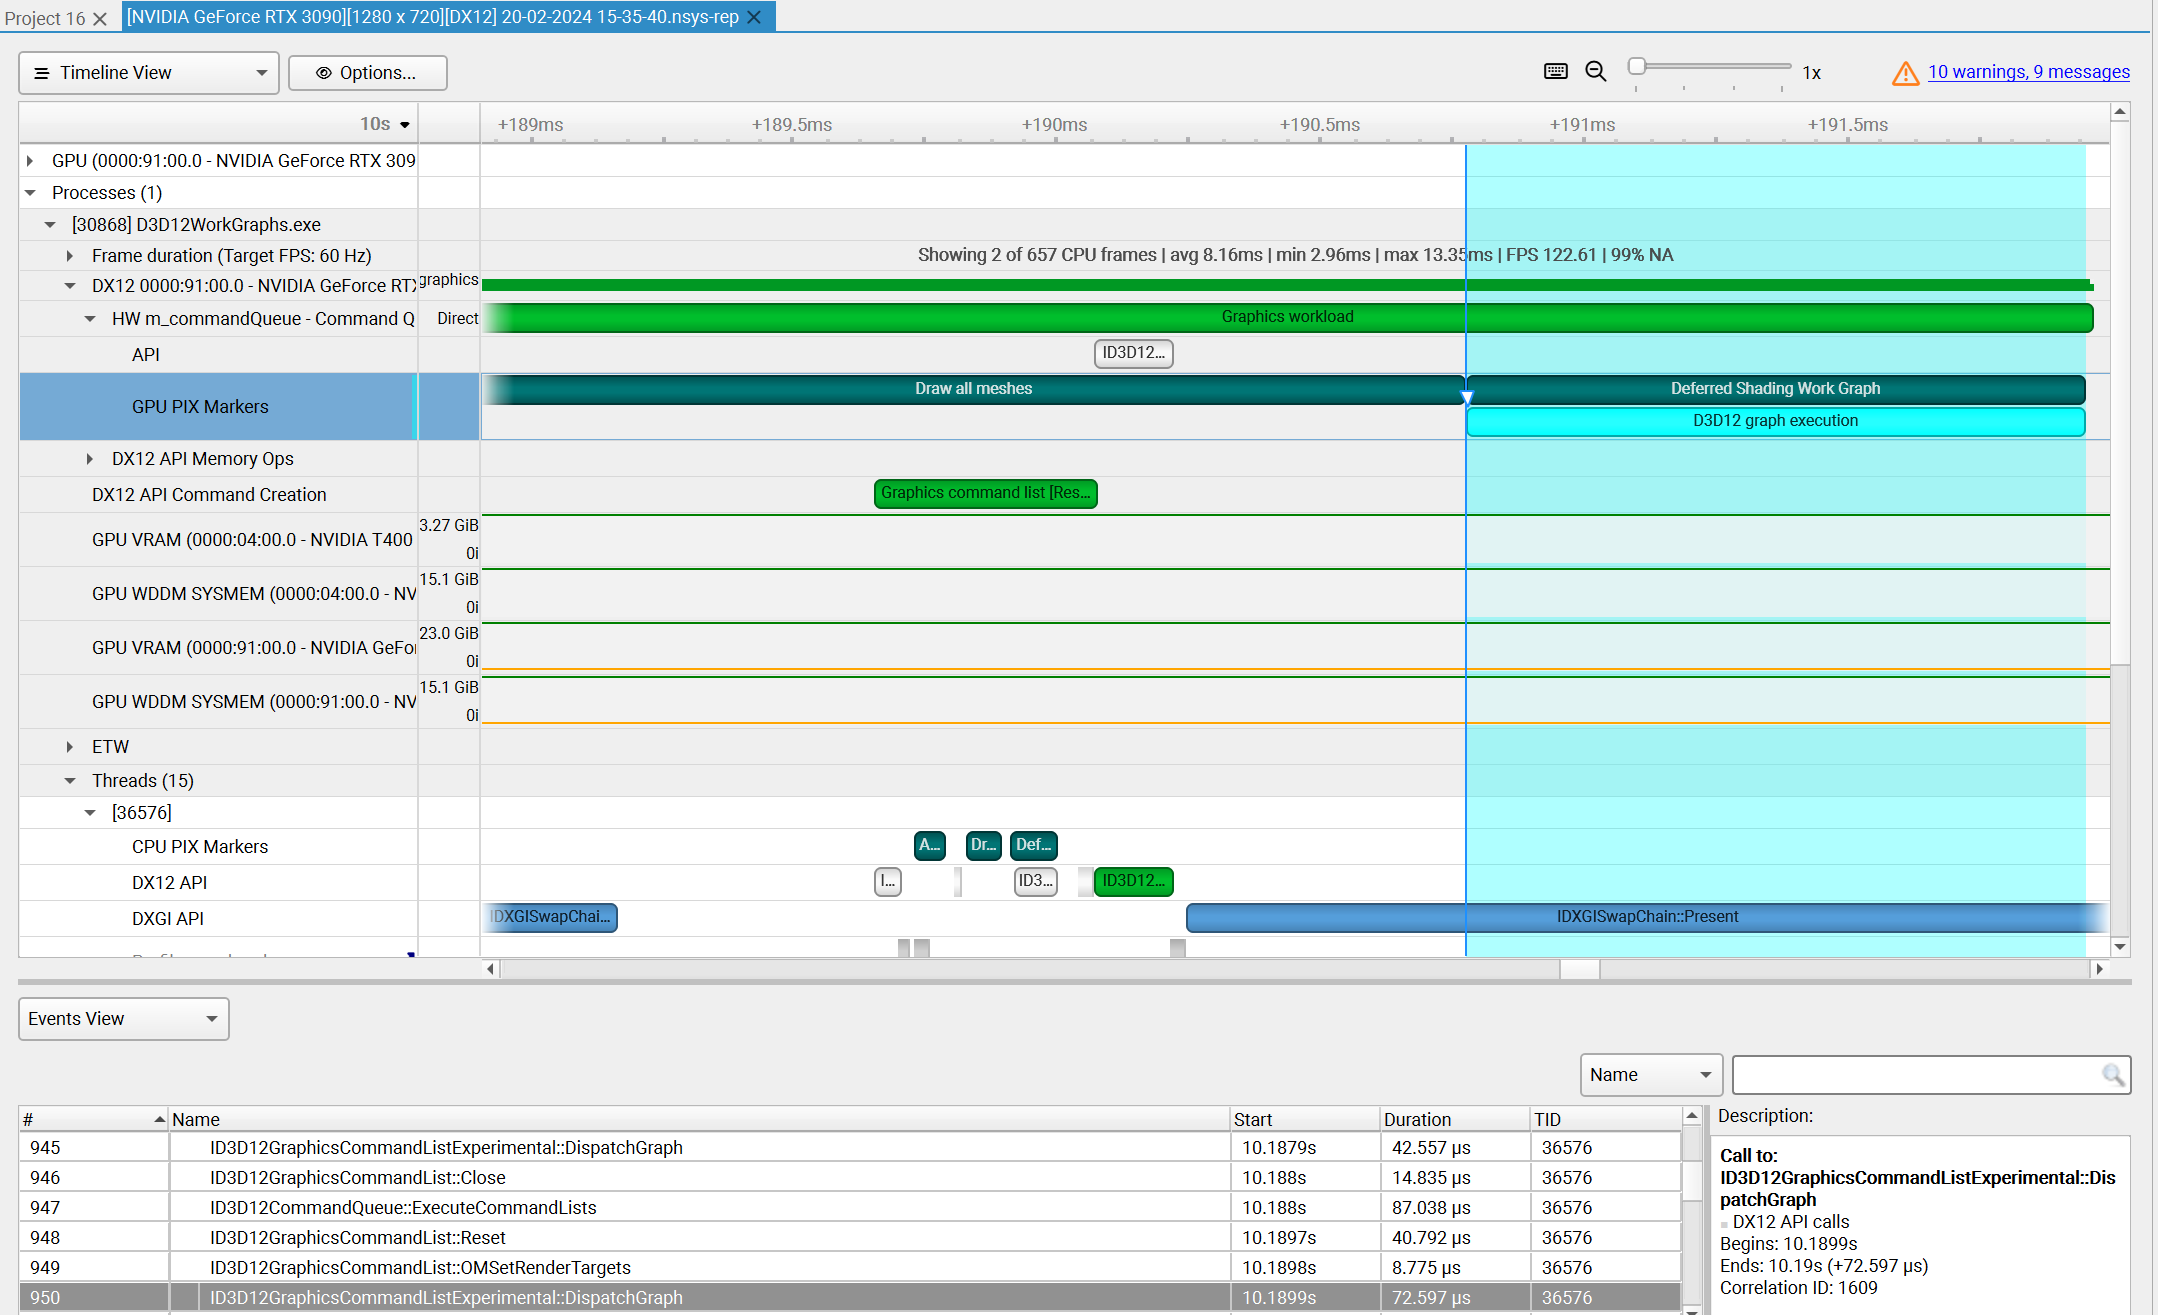
WDDM Queues#
The Windows Display Driver Model (WDDM) architecture uses queues to send work packets from the CPU to the GPU. Each D3D device in each process is associated with one or more contexts. Graphics, compute, and copy commands that the profiled application uses are associated with a context, batched in a command buffer, and pushed into the relevant queue associated with that context.
Nsight Systems can capture the state of these queues during the trace session.
Enabling the “Extensive trace” option will also capture extended DxgKrnl events from the Microsoft-Windows-DxgKrnl provider, such as Hardware Scheduling queues, context status, allocations, sync wait, signal events, etc.
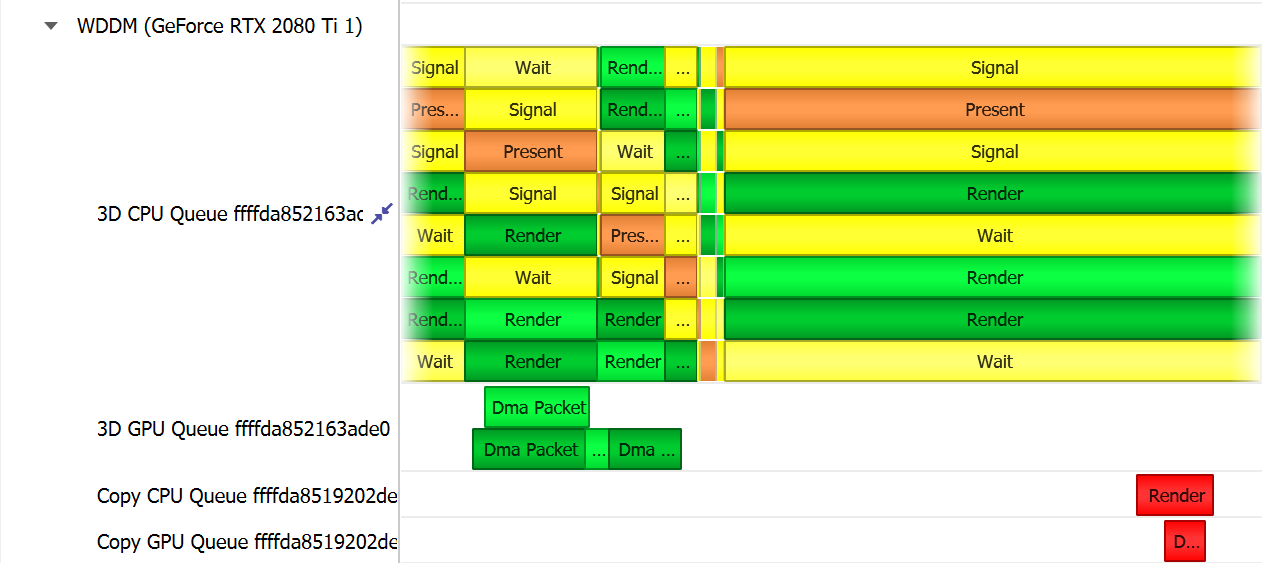
A command buffer in a WDDM queues may have one the following types:
Render
Deferred
System
MMIOFlip
Wait
Signal
Device
Software
It may also be marked as a Present buffer, indicating that the application has finished rendering and requests to display the source surface.
See the Microsoft documentation for the WDDM architecture and the DXGKETW_QUEUE_PACKET_TYPE enumeration.
To retain the .etl trace files captured, so that they can be viewed in other tools (e.g. GPUView), change the “Save ETW log files in project folder” option under “Profile Behavior” in Nsight Systems’s global Options dialog. The .etl files will appear in the same folder as the .nsys-rep file, accessible by right-clicking the report in the Project Explorer and choosing “Show in Folder…”. Data collected from each ETW provider will appear in its own .etl file, and an additional .etl file named “Report XX-Merged-*.etl”, containing the events from all captured sources, will be created as well.
WDDM HW Scheduler#
When GPU Hardware Scheduling is enabled in Windows 10 or newer, the Windows Display Driver Model (WDDM) uses the DxgKrnl ETW provider to expose report of NVIDIA GPUs’ hardware scheduling context switches.
Nsight Systems can capture these context switch events, and display under the GPUs in the timeline rows titled WDDM HW Scheduler - [HW Queue type]. The ranges under each queue will show the process name and PID assoicated with the GPU work during the time period.
The events will be captured if GPU Hardware Scheduling is enabled in the Windows System Display settings, and “Collect WDDM Trace” is enabled in the Nsight Systems Project Settings.

Vulkan API Trace#
Vulkan Overview#
Vulkan is a low-overhead, cross-platform 3D graphics and compute API, targeting a wide variety of devices from PCs to mobile phones and embedded platforms. The Vulkan API is defined by the Khronos Group. Information about Vulkan and the Khronos Group can be found at the Khronos Vulkan Site.
Nsight Systems can capture information about Vulkan usage by the profiled process. This includes capturing the execution time of Vulkan API functions, corresponding GPU workloads, debug util labels, and frame durations. Vulkan profiling is supported on both Windows and x86 Linux operating systems.
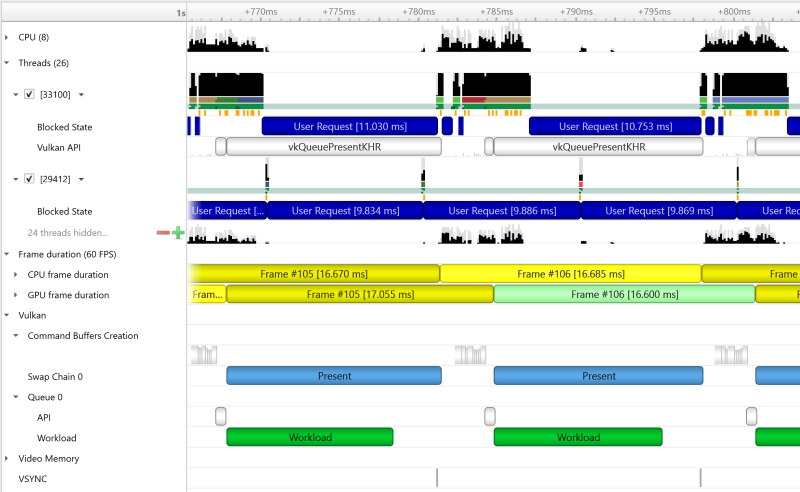
The Command Buffer Creation row displays time periods when command buffers were being created. This enables developers to improve their application’s multi-threaded command buffer creation. Command buffer creation time period is measured between the call to vkBeginCommandBuffer and the call to vkEndCommandBuffer.

A Queue row is displayed for each Vulkan queue created by the profiled application. The API sub-row displays time periods where vkQueueSubmit was called. The GPU Workload sub-row displays time periods where workloads were executed by the GPU.

In addition, you can see Vulkan debug util labels on both the CPU and the GPU.

Clicking on a GPU workload highlights the corresponding vkQueueSubmit call, and vice versa.
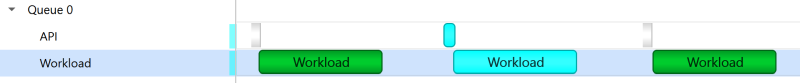
The Vulkan Memory Operations row contains an aggregation of all the Vulkan host-side memory operations, such as host-blocking writes and reads or non-persistent map-unmap ranges.
The row is separated into sub-rows by heap index and memory type - the tooltip for each row and the ranges inside show the heap flags and the memory property flags.
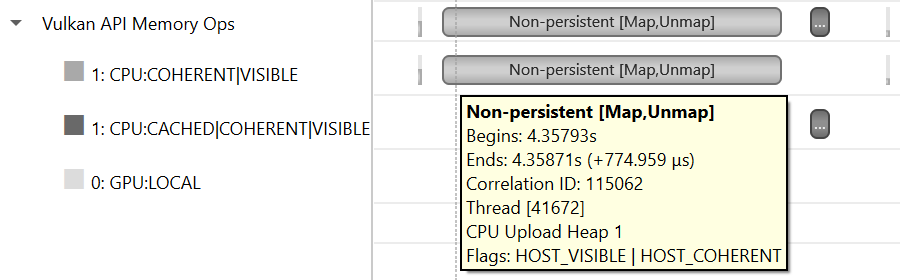
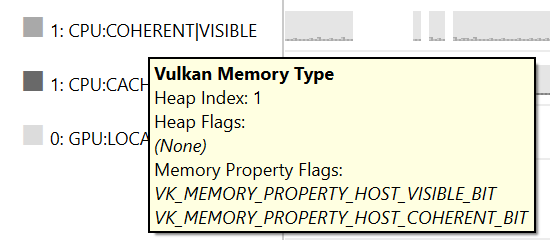
Pipeline Creation Feedback#
When tracing target application calls to Vulkan pipeline creation APIs, Nsight Systems leverages the Pipeline Creation Feedback extension to collect more details about the duration of individual pipeline creation stages.
See Pipeline Creation Feedback extension for details about this extension.
Vulkan pipeline creation feedback is available on NVIDIA driver release 435 or later.
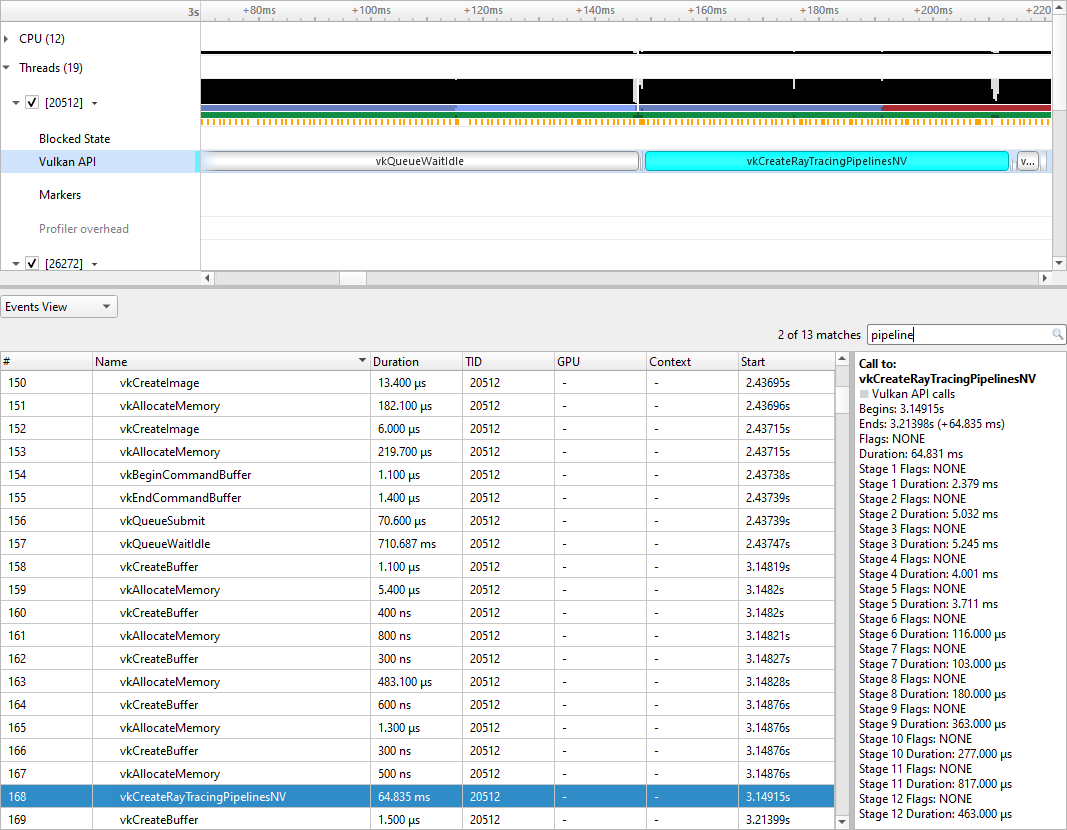
Vulkan GPU Trace Notes#
Vulkan GPU trace is available only when tracing apps that use NVIDIA GPUs.
The endings of Vulkan Command Buffers execution ranges on Compute and Transfer queues may appear earlier on the timeline than their actual occurrence.
Stutter Analysis#
Stutter Analysis Overview
Nsight Systems on Windows targets displays stutter analysis visualization aids for profiled graphics applications that use either OpenGL, D3D11, D3D12 or Vulkan, as detailed below in the following sections.
FPS Overview#
The Frame Duration section displays frame durations on both the CPU and the GPU.
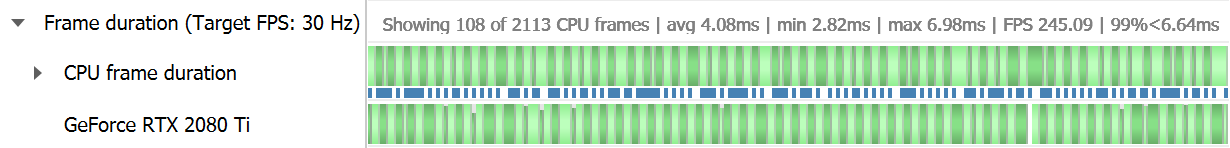
The frame duration row displays live FPS statistics for the current timeline viewport. Values shown are:
Number of CPU frames shown of the total number captured.
Average, minimal, and maximal CPU frame time of the currently displayed time range.
Average FPS value for the currently displayed frames.
The 99th percentile value of the frame lengths (such that only 1% of the frames in the range are longer than this value).
The values will update automatically when scrolling, zooming or filtering the timeline view.
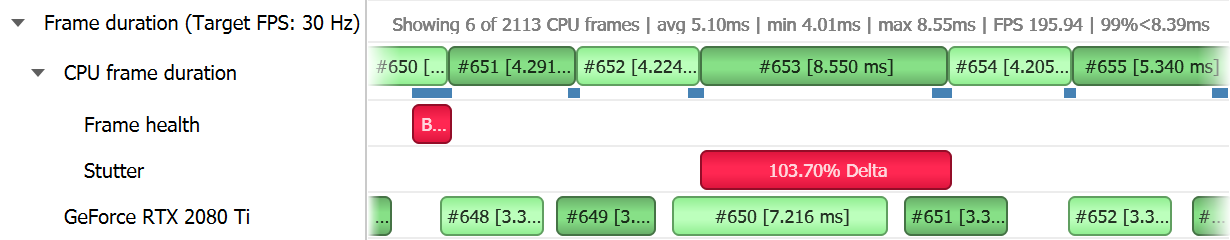
The stutter row highlights frames that are significantly longer than the other frames in their immediate vicinity.
The stutter row uses an algorithm that compares the duration of each frame to the median duration of the surrounding 19 frames. Duration difference under 4 milliseconds is never considered a stutter, to avoid cluttering the display with frames whose absolute stutter is small and not noticeable to the user.
For example, if the stutter threshold is set at 20%:
Median duration is 10 ms. Frame with 13 ms time will not be reported (relative difference > 20%, absolute difference < 4 ms).
Median duration is 60 ms. Frame with 71 ms time will not be reported (relative difference < 20%, absolute difference > 4 ms).
Median duration is 60 ms. Frame with 80 ms is a stutter (relative difference > 20%, absolute difference > 4 ms, both conditions met).
OSC detection
The “19 frame window median” algorithm by itself may not work well with some cases of “oscillation” (consecutive fast and slow frames), resulting in some false positives. The median duration is not meaningful in cases of oscillation and can be misleading.
To address the issue and identify if oscillating frames, the following method is applied:
For every frame, calculate the median duration, 1st and 3rd quartiles of 19-frames window.
Calculate the delta and ratio between 1st and 3rd quartiles.
If the 90th percentile of 3rd - 1st quartile delta array > 4 ms AND the 90th percentile of 3rd/1st quartile array > 1.2 (120%) then mark the results with “OSC” text.
Right-clicking the Frame Duration row caption lets you choose the target frame rate (30, 60, 90 or custom frames per second).
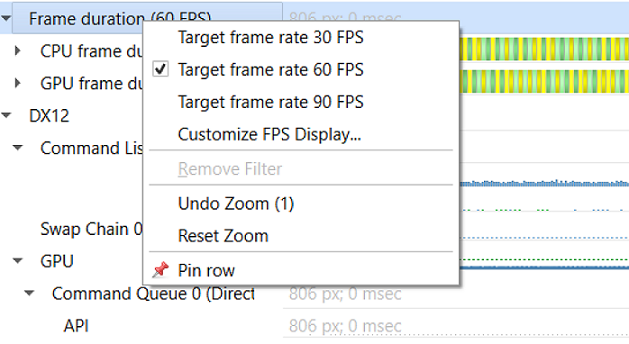
By clicking the Customize FPS Display option, a customization dialog pops up. In the dialog, you can now define the frame duration threshold to customize the view of the potentially problematic frames. In addition, you can define the threshold for the stutter analysis frames.
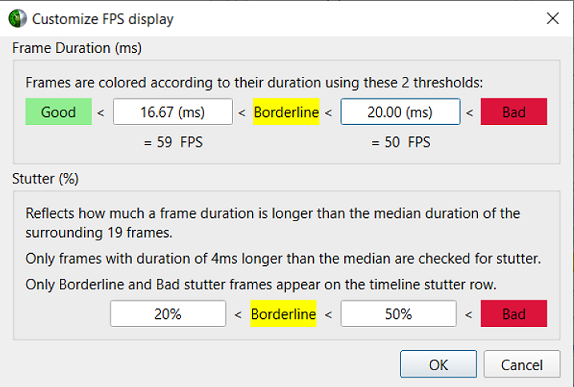
Frame duration bars are color-coded:
Green, the frame duration is shorter than required by the target FPS ratio.
Yellow, duration is slightly longer than required by the target FPS rate.
Red, duration far exceeds that required to maintain the target FPS rate.

The CPU Frame Duration row displays the CPU frame duration measured between the ends of consecutive frame boundary calls:
The OpenGL frame boundaries are
eglSwapBuffers/glXSwapBuffers/SwapBufferscalls.The D3D11 and D3D12 frame boundaries are
IDXGISwapChainX::Presentcalls.The Vulkan frame boundaries are
vkQueuePresentKHRcalls.
The timing of the actual calls to the frame boundary calls can be seen in the blue bar at the bottom of the CPU frame duration row
The GPU Frame Duration row displays the time measured between:
The start time of the first GPU workload execution of this frame.
The start time of the first GPU workload execution of the next frame.
Reflex SDK
NVIDIA Reflex SDK is a series of NVAPI calls that allow applications to integrate the Ultra Low Latency driver feature more directly into their game to further optimize synchronization between simulation and rendering stages and lower the latency between user input and final image rendering. For more details about Reflex SDK, see the Reflex SDK Site.
Nsight Systems will automatically capture NVAPI functions when either Direct3D 11, Direct3D 12, or Vulkan API trace are enabled.
The Reflex SDK row displays timeline ranges for the following types of latency markers:
RenderSubmit
Simulation
Present
Driver
OS Render Queue
GPU Render
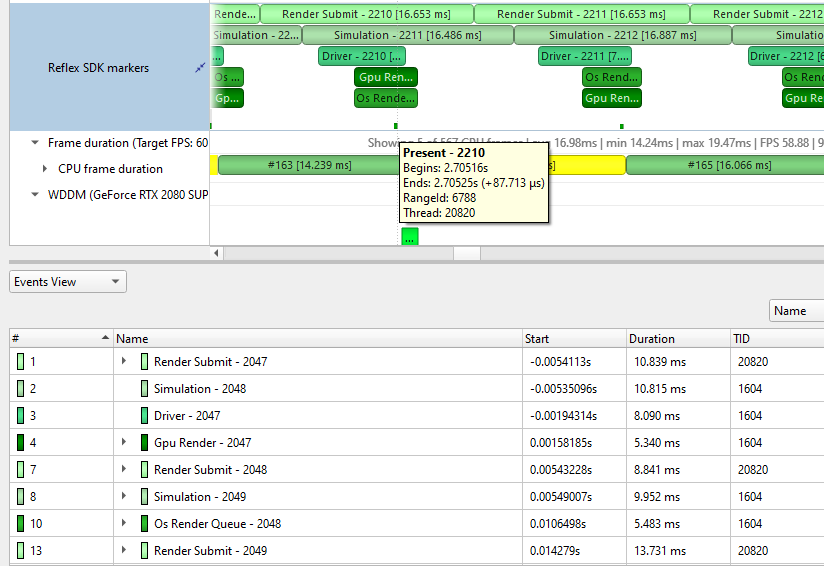
Performance Warnings row
This row shows performance warnings and common pitfalls that are automatically detected based on the enabled capture types. Warnings are reported for:
ETW performance warnings.
Vulkan calls to
vkQueueSubmitand D3D12 calls toID3D12CommandQueue::ExecuteCommandListthat take a longer time to execute than the total time of the GPU workloads they generated.Usage of Vulkan API functions that may adversely affect performance.
Creation of a Vulkan device with memory zeroing, whether by physical device default or manually.
Vulkan command buffer barrier which can be combined or removed, such as subsequent barriers or read-to-read barriers.

Frame Health#
The Frame Health row displays actions that took significantly a longer time during the current frame, compared to the median time of the same actions executed during the surrounding 19-frames. This is a great tool for detecting the reason for frame time stuttering. Such actions may be: shader compilation, present, memory mapping, and more. Nsight Systems measures the accumulated time of such actions in each frame. For example: calculating the accumulated time of shader compilations in each frame and comparing it to the accumulated time of shader compilations in the surrounding 19 frames.
Example of a Vulkan frame health row:
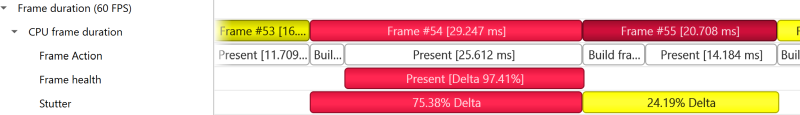
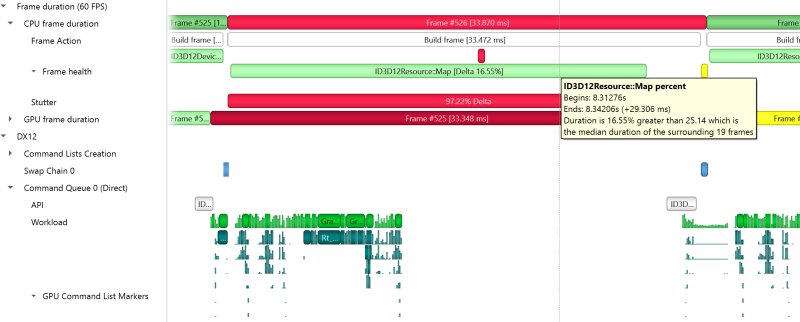
Windows GPU Memory Utilization#
Each GPU has two rows detailing its memory utilization: GPU VRAM, showing the memory consumed on the device, and GPU WDDM SYSMEM, showing the memory consumed on the host computer RAM.

These rows show a green-colored line graph for the memory budget for this memory segment, and an orange-colored line graph for the actual amount of memory used. Note that these graphs are scaled to fit the highest value enconutered, as indicated by the “Y axis” value in the row header. You can use the vertical zoom slider in the top-right of the timeline view to make the row taller and view the graph in more detail.
Note that the value in the GPU VRAM row is not the same as the CUDA kernel memory allocation graph, see CUDA GPU Memory Allocation Graph for that functionality.
The GPU VRAM row also has several child rows, accessed by expanding the row in the tree view
The events will be captured if “Collect WDDM Trace” is enabled along with either “Collect WDDM memory trace” or “Extensive trace including Hardware Scheduling queues…” in the Nsight Systems Project Settings.
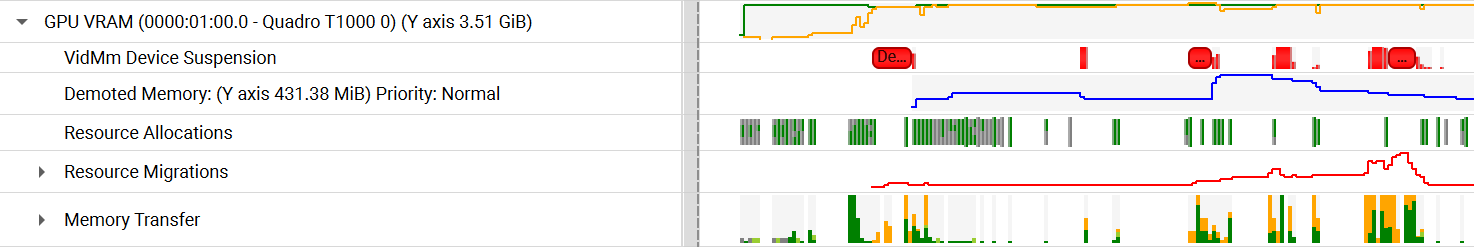
VidMm Device Suspension
This row displays time ranges when the GPU memory manager suspended all memory transfer operations, pending the completion of a single memory transfer.
The events will be captured if “Collect WDDM Trace” and “Extensive trace including Hardware Scheduling queues, context status, allocations, sync wait and signal events, etc.” are enabled in the Nsight Systems Project Settings.
Demoted Memory
This row displays the amount of VRAM that was demoted from GPU local memory to non-local memory (possibly due to exceeding the VRAM budget) as a blue-colored line graph. High amounts of demoted memory could be indicative of video memory leaks or poor memory management. Note that the Demoted memory row is scaled to its highest value, similar to the GPU VRAM and GPU WDDM SYSMEM rows.
The events will be captured if “Collect WDDM Trace” is enabled along with either “Collect WDDM memory trace” or “Extensive trace including Hardware Scheduling queues…” in the Nsight Systems Project Settings.
Resource Allocations

This row shows markers indicating resource allocation events. VRAM resources are shown as green markers while SYSMEM resources are shown in gray. Hovering over a marker or selecting it in the Events view will display all the allocation parameters as well as the call stack that led to the allocation event.
The events will be captured if “Collect WDDM Trace” is enabled along with either “Collect WDDM memory trace” or “Extensive trace including Hardware Scheduling queues…” in the Nsight Systems Project Settings.
Resource Migrations
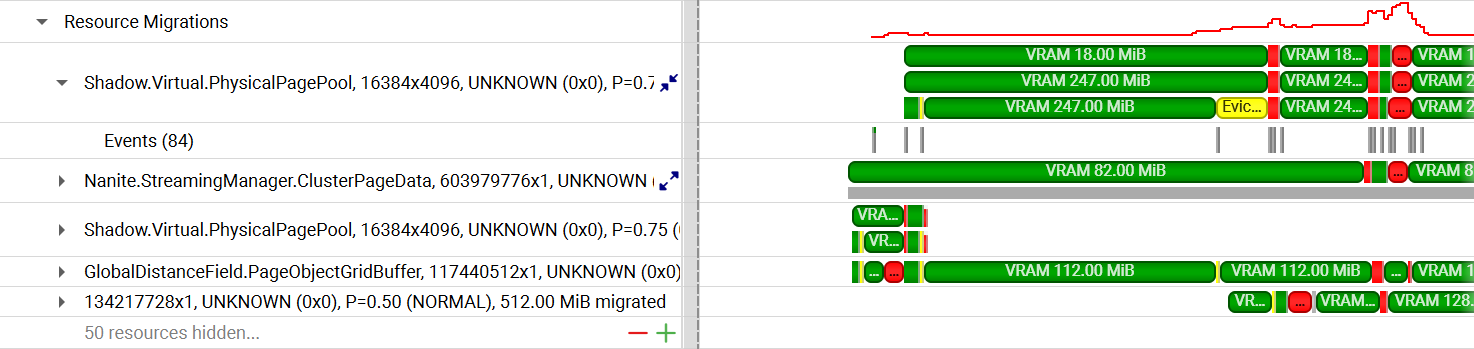
This row displays a breakdown of resources’ movement between VRAM and SYSMEM, focusing on resource evictions. The main row shows a timeline of total evicted resource memory and count as a red-colored line graph.
Each child row displays a timeline of the status of each resource, as reflected
by WDDM events related to it. If the object has been named using PIX or
ID3D11Object::SetName / ID3D12Object::SetName, the name will be shown
in the row title. Whether named or not, the row title will also show the
resource dimensions, format, priority, and the memory size migrated. If the
resource was migrated in parts using subresources, the row can be expanded to
show the status for each subresource at any given time.
Expanding the row for a resource will show the individual WDDM events relevant to it and the call stacks that led to each event.
By default, the resources are sorted by Relevance (most / largest migrations). Right-clicking the main Resource Migrations row header allows choosing between the following sorting options:
Relevance
Name
Format
Priority
Earliest allocation timestamp (order of appearance on the host)
Earliest migration timestamp (order of appearance on the device)
The top 5 resources are shown initially. If more than 5 resources exist, a row showing the number of hidden resources and buttons allowing to show more or fewer of them will appear below them. Right-click this row and select “show all” or “show all collapsed” to display all the resources at once.
The events will be captured if “Collect WDDM Trace” is enabled along with either “Collect WDDM memory trace” or “Extensive trace including Hardware Scheduling queues…” in the Nsight Systems Project Settings. Additionally, to correlate Graphics API debug name events with resource migration events, the “Collect DX12” or “Collect Vulkan” option should be enabled.
Memory Transfer
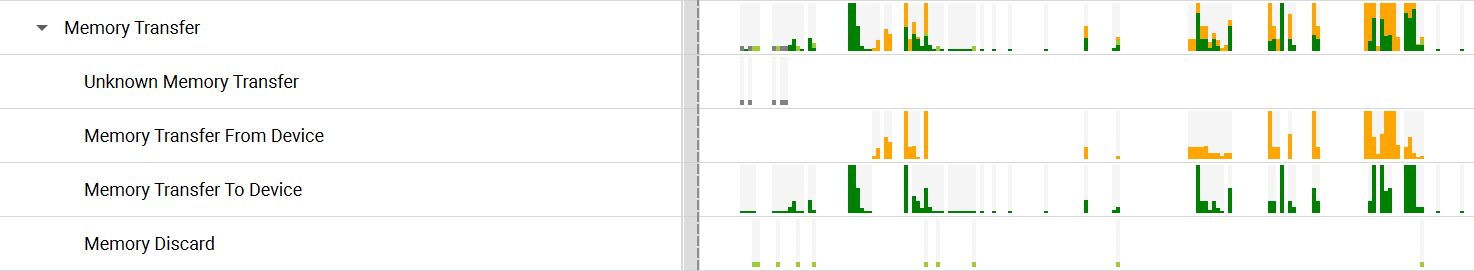
This row shows an overview of all memory transfer operations. Device-to-host transfers are shown in orange, host-to-device transfers are shown in green, discarded device memory is shown in light green, and unknown events are shown in dark gray. The height of each event marker corresponds to the amount of memory that the event affected. Hovering over the marker will show the exact amount.
Expanding the row will show a breakdown of the events by each specific type.
The events will be captured if “Collect WDDM Trace” is enabled along with either “Collect WDDM memory trace” or “Extensive trace including Hardware Scheduling queues…” in the Nsight Systems Project Settings.
System Committed VRAM

This row represents the total size of committed VRAM by all processes currently using the GPU. The stacked chart displays colored layers. Each layer corresponds to the VRAM commitment of a specific process.
To track VRAM commitment, enable “Collect WDDM Trace” along with either “Collect WDDM memory trace” or “Extensive trace including Hardware Scheduling queues…” in Nsight Systems Project Settings.
VRAM Resource Types Distribution
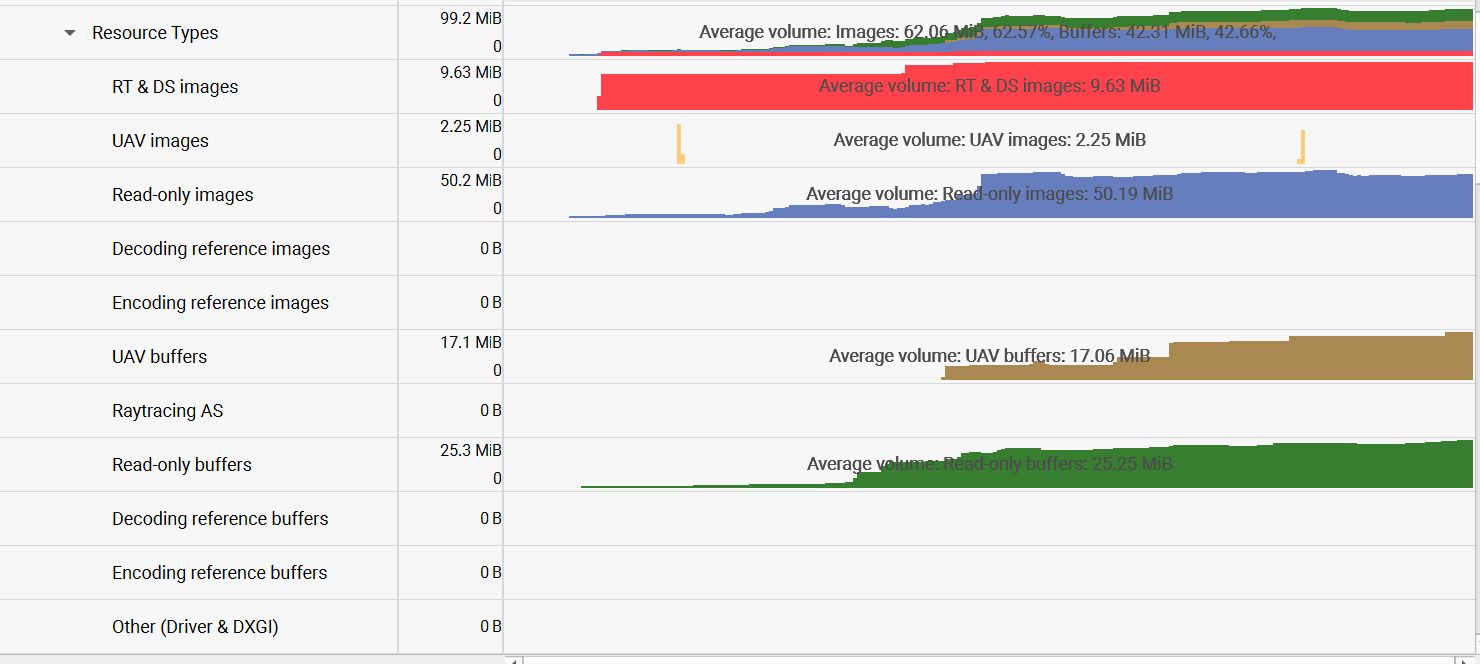
This row shows the distribution of VRAM usage across different resource types per process. it is color-coded to show the different resource types, and the height of each segment corresponds to the amount of VRAM used by that resource type. Expand the chart’s parent row to expose detailed separate rows for individual resource categories.
The events will be captured if “Collect WDDM Trace” is enabled along with either “Collect WDDM memory trace” or “Extensive trace including Hardware Scheduling queues…” in the Nsight Systems Project Settings. Additionally, to correlate Graphics API debug name events with resource migration events, the “Collect DX12” or “Collect Vulkan” option should be enabled.
Vertical Synchronization#
The VSYNC rows display when the monitor’s vertical synchronizations occur.

CUDA Trace#
Basic CUDA trace#
Nsight Systems is capable of capturing information about CUDA execution in the profiled process.
The following information can be collected and presented on the timeline in the report:
CUDA API trace — trace of CUDA Runtime and CUDA Driver calls made by the application.
CUDA Runtime calls typically start with
cudaprefix (e.g.cudaLaunch).CUDA Driver calls typically start with
cuprefix (e.g.cuDeviceGetCount).
CUDA workload trace — trace of activity happening on the GPU, which includes memory operations (e.g., Host-to-Device memory copies) and kernel executions. Within the threads that use the CUDA API, additional child rows will appear in the timeline tree.
On Nsight Systems Workstation Edition, cuDNN and cuBLAS API tracing and OpenACC tracing.
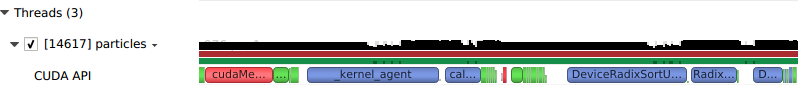
Near the bottom of the timeline row tree, the GPU node will appear and contain a CUDA node. Within the CUDA node, each CUDA context used within the process will be shown along with its corresponding CUDA streams. Steams will contain memory operations and kernel launches on the GPU. Kernel launches are represented by blue, while memory transfers are displayed in red.
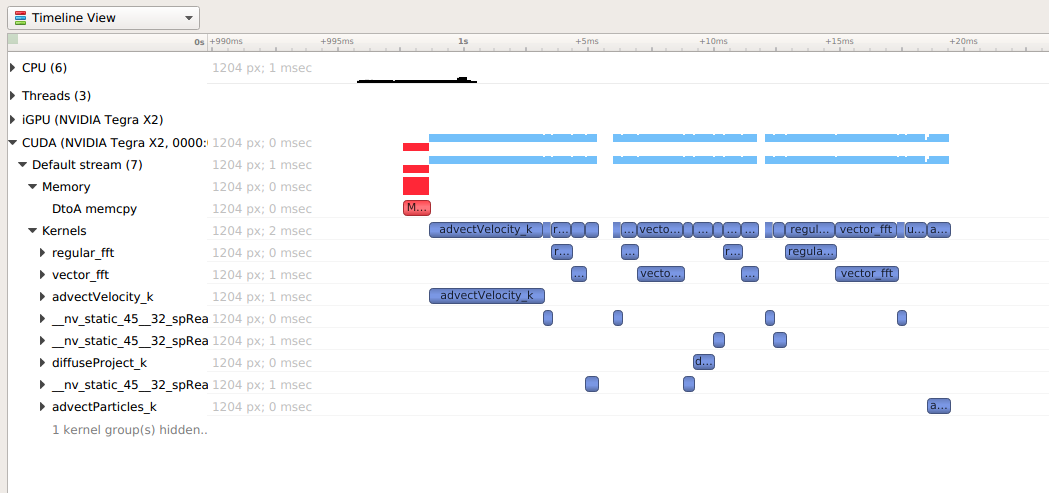
The easiest way to capture CUDA information is to launch the process from Nsight Systems, and it will setup the environment for you. To do so, simply set up a normal launch and select the Collect CUDA trace checkbox.
For Nsight Systems Workstation Edition this looks like:
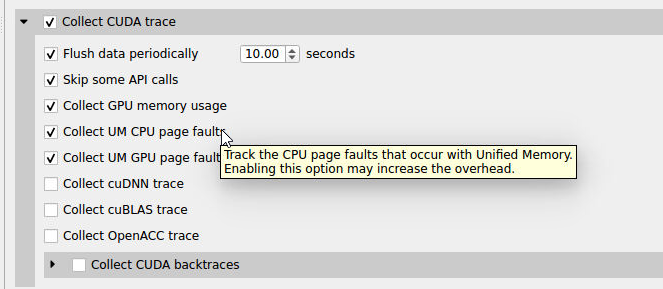
For Nsight Systems Embedded Platforms Edition this looks like:
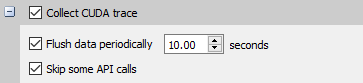
Additional configuration parameters are available:
System-wide CUDA trace - collect CUDA trace from all processes on the system. By default, CUDA trace is captured from the target process and its descendants only. Select this option to switch to system-wide trace mode. Note: Only CUDA processes launched after the collection start and by the same user will be included. Only one session can collect system-wide CUDA trace at a time on the entire system; other sessions will fall back to process-tree scope.
Collect hardware-based trace - switches Nsight Systems from an instrumented CUDA collection to a hardware based collection. For workloads that launch many short duration kernels, the overhead of kernel timestamp collection can be significantly reduced. Note: Works on Blackwell based or later GPUs. Does not support CUDA tracing of MPS workloads. Does not work in MIG partitions or virtual GPU environments (vGPU).
Collect backtraces for API calls longer than X seconds - turns on collection of CUDA API backtraces and sets the minimum time a CUDA API event must take before its backtraces are collected. Setting this value too low can cause high application overhead and seriously increase the size of your results file.
Flush data periodically — specifies the period after which an attempt to flush CUDA trace data will be made. Normally, in order to collect full CUDA trace, the application needs to finalize the device used for CUDA work (call
cudaDeviceReset(), and then let the application gracefully exit (as opposed to crashing).This option allows flushing CUDA trace data even before the device is finalized. However, it might introduce additional overhead to a random CUDA Driver or CUDA Runtime API call.
Skip some API calls — avoids tracing insignificant CUDA Runtime API calls (namely,
cudaConfigureCall(),cudaSetupArgument(),cudaHostGetDevicePointers()). Not tracing these functions allows Nsight Systems to significantly reduce the profiling overhead, without losing any interesting data.Collect GPU Memory Usage - collects information used to generate a graph of CUDA allocated memory across time. Note that this will increase overhead. See CUDA GPU Memory Allocation Graph.
Collect Unified Memory CPU page faults - collects information on page faults that occur when CPU code tries to access a memory page that resides on the device. See Unified Memory CPU Page Faults.
Collect Unified Memory GPU page faults - collects information on page faults that occur when GPU code tries to access a memory page that resides on the CPU. See Unified Memory GPU Page Faults.
Collect CUDA Graph trace - by default, CUDA tracing will collect and expose information on a whole graph basis. The user can opt to collect on a node per node basis. See CUDA Graph Trace.
Collect CUDA Event trace - track device-side CUDA Event (the synchronization mechanism) completion, and get better correlation support among CUDA Event APIs. CUDA Event Trace.
For Nsight Systems Workstation Edition, Collect cuDNN trace, Collect cuBLAS trace, Collect OpenACC trace - selects which (if any) extra libraries that depend on CUDA to trace.
OpenACC versions 2.0, 2.5, and 2.6 are supported when using PGI runtime version 15.7 or greater and not compiling statically. In order to differentiate constructs, a PGI runtime of 16.1 or later is required. Note that Nsight Systems Workstation Edition does not support the GCC implementation of OpenACC at this time.
Note
If your application crashes before all collected CUDA trace data has been copied out, some or all data might be lost and not present in the report.
Note
Nsight Systems will not have information about CUDA events that were still in device buffers when analysis terminated. It is a good idea, if using cudaProfilerAPI to control analysis to call cudaDeviceReset before ending analysis.
Launching NVIDIA Nsight Compute from a CUDA Kernel#
After you have used CUDA trace in Nsight Systems to locate a potential problem kernel, you may want to run NVIDIA Nsight Compute on that specific kernel. Right click on the kernel to bring up a menu.
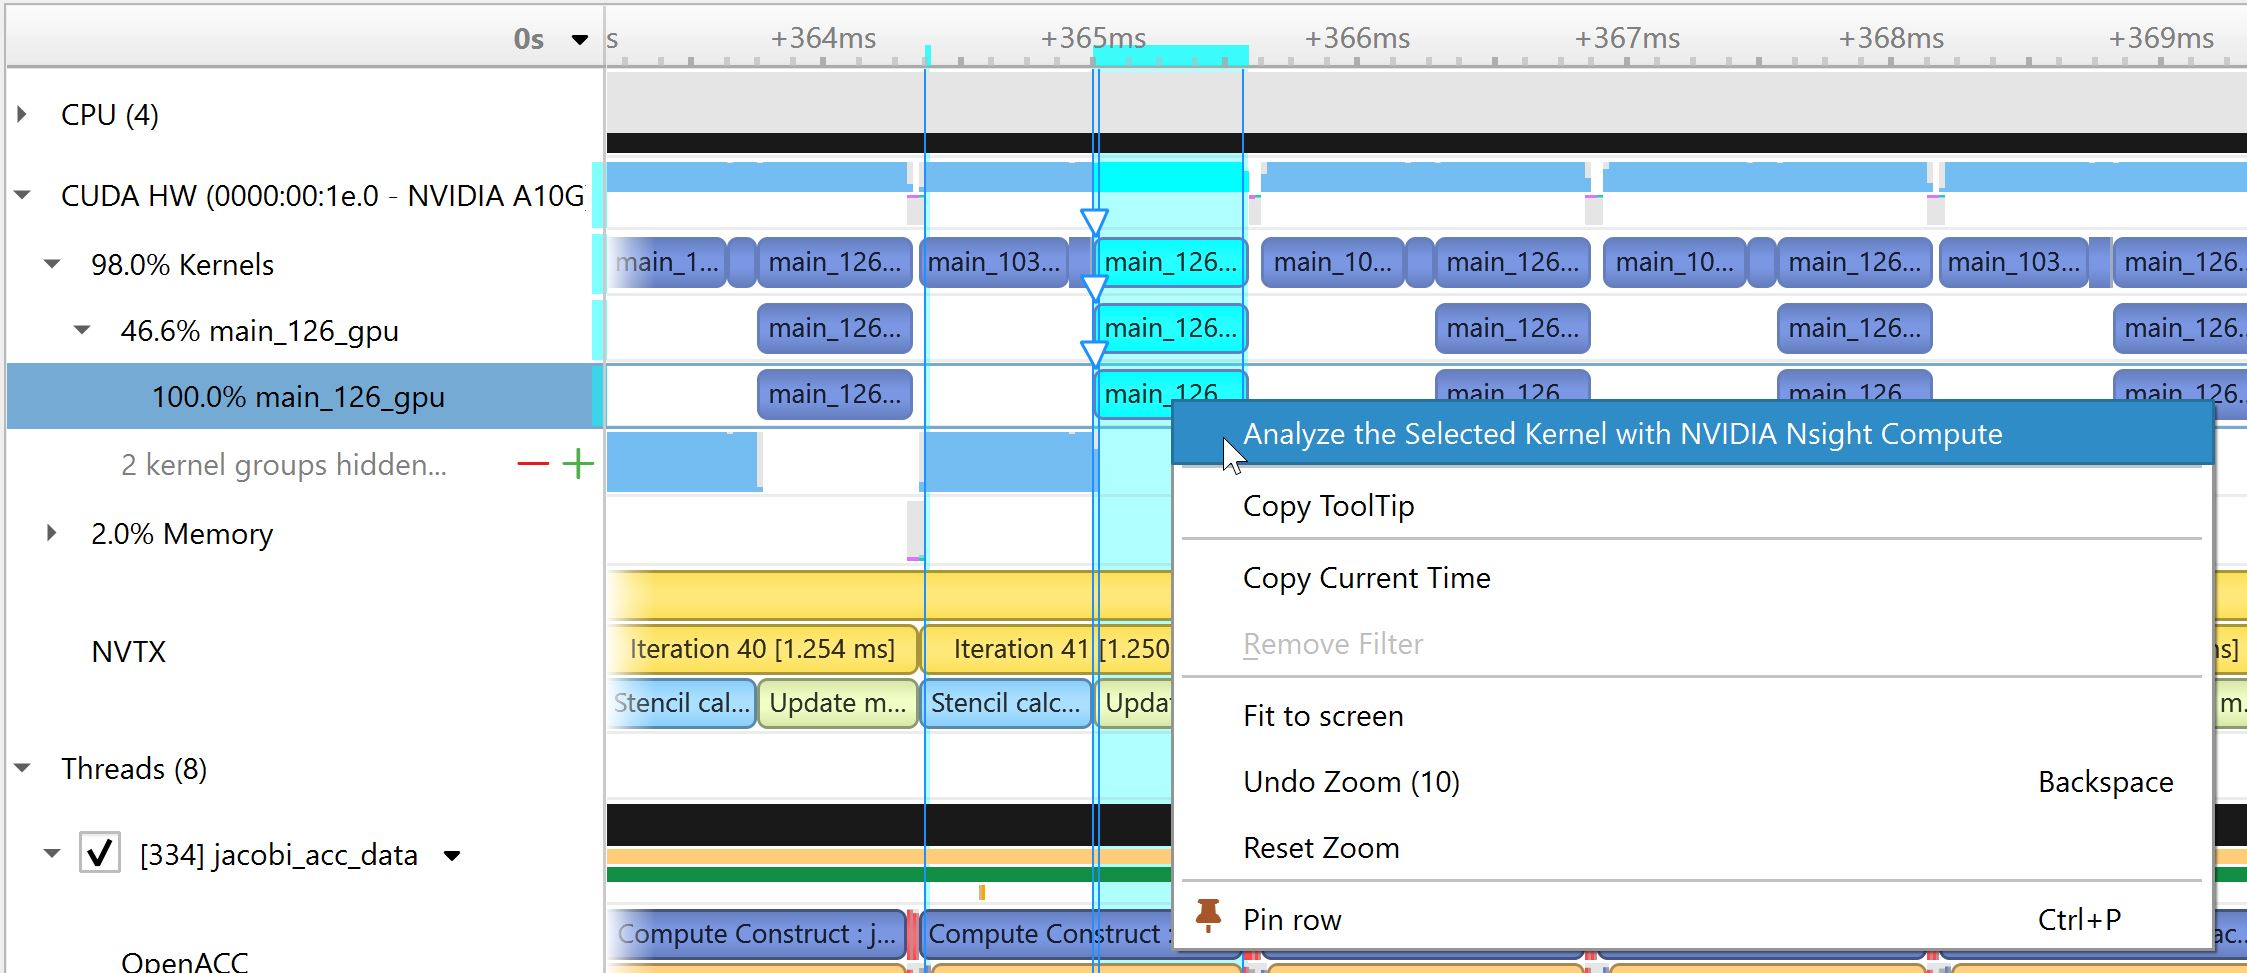
If this is the first time that the user has selected this feature, then we show the following dialog box to get their preferences:
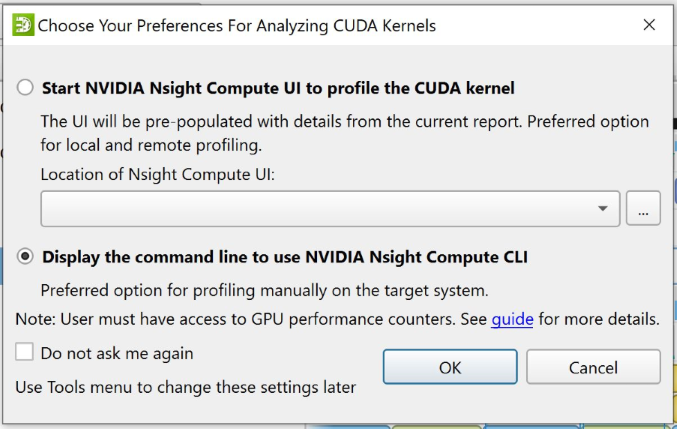
The first option invokes the NVIDIA Nsight Compute UI with known parameters. It is the preferred option for local or remote profiling. The user must provide the location of the ncu-ui executable. Nsight Systems will verify that the path and executable are valid.
The second option is provided for the convenience of users who do not have NVIDIA Nsight Compute installed on the host system, but simply want the command line they can use to run the Nsight Compute on the remote target by themselves without much automation.
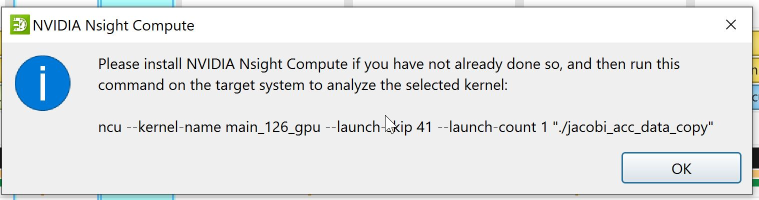
If the user selects the option to start the NCU UI, Nsight Systems invokes it with any relevant parameters from the Nsight Systems run.
The screenshot below shows NCU UI invoked by Nsight Systems. The red circles indicate the parameters pre-populated by Nsight Systems. Users may modify any of these parameters before launching the application and profiling the selected kernel.
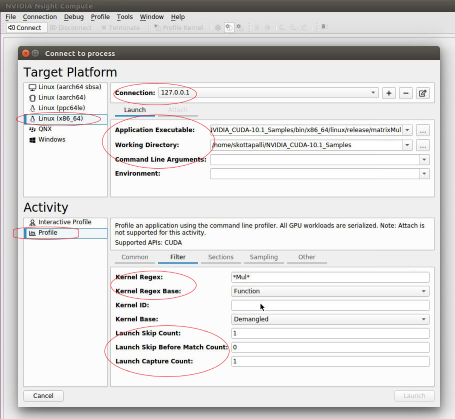
CUDA GPU Memory Allocation Graph#
When the Collect GPU Memory Usage option is selected from the Collect CUDA trace option set, Nsight Systems will track CUDA GPU memory allocations and deallocations and present a graph of this information in the timeline. This is not the same as the GPU memory graph generated during stutter analysis on the Windows target. See Windows GPU Memory Utilization.
Below, in the report on the left, memory is allocated and freed during the collection. In the report on the right, memory is allocated, but not freed during the collection.
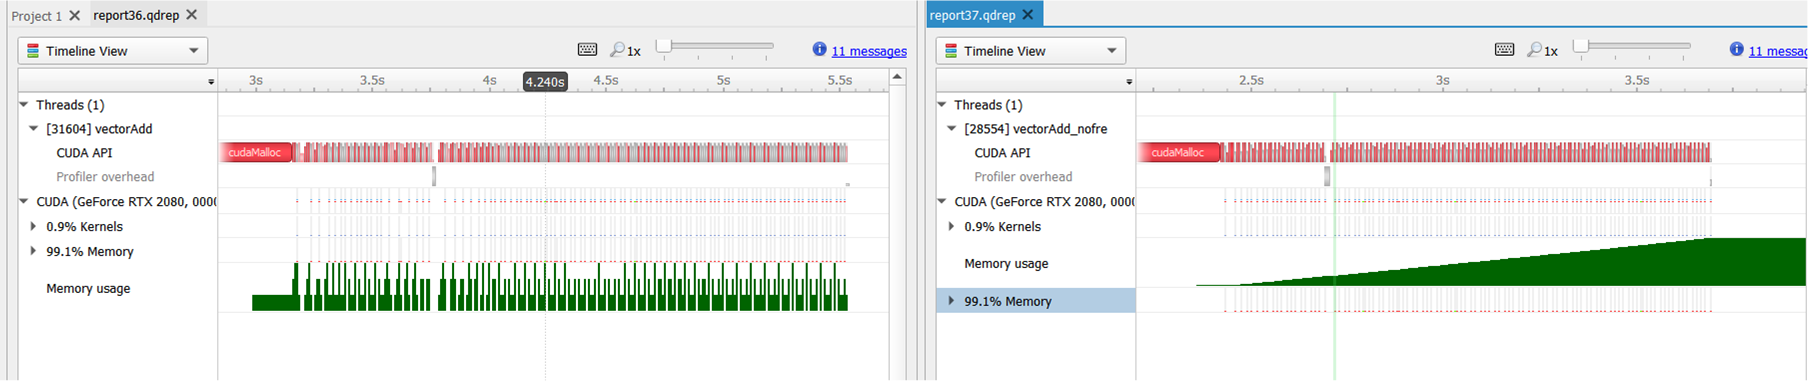
Here is another example, where allocations are happening on multiple GPUs.
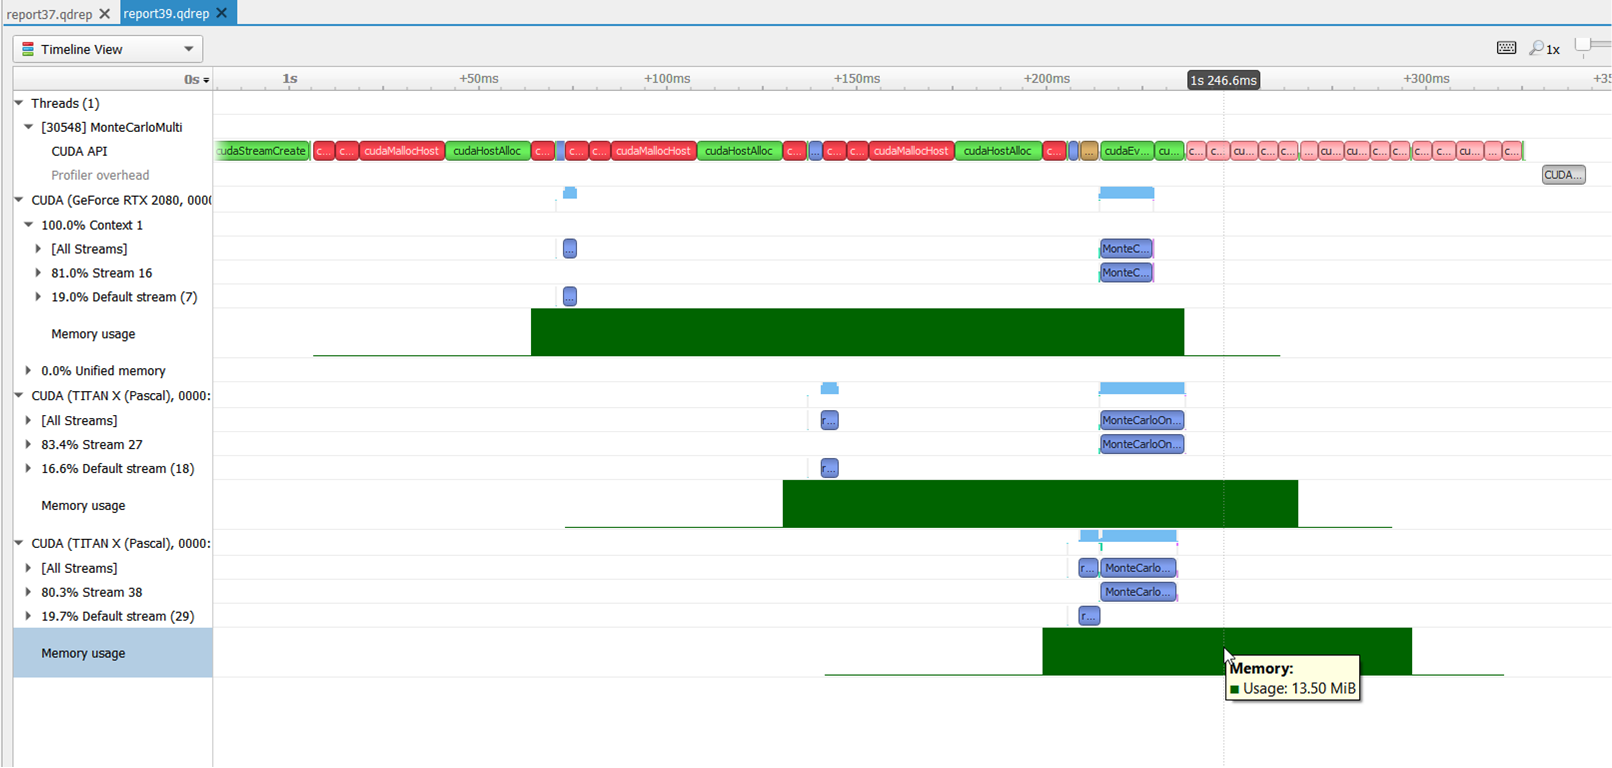
Nsight Systems uses CUPTI for CUDA profiling, including to collect the CUDA memory usage by the application processes. CUPTI tracks various kinds of memory allocations and deallocations done by the user application that is being profiled. See: CUPTI documentation.
CUPTI_ACTIVITY_MEMORY_KIND_PAGEABLE = 1 The memory is pageable. CUPTI_ACTIVITY_MEMORY_KIND_PINNED = 2 The memory is pinned. CUPTI_ACTIVITY_MEMORY_KIND_DEVICE = 3 The memory is on the device. CUPTI_ACTIVITY_MEMORY_KIND_ARRAY = 4 The memory is an array. CUPTI_ACTIVITY_MEMORY_KIND_MANAGED = 5 The memory is managed CUPTI_ACTIVITY_MEMORY_KIND_DEVICE_STATIC = 6 The memory is device static CUPTI_ACTIVITY_MEMORY_KIND_MANAGED_STATIC = 7 The memory is managed static
There are three graphs shown in nsys GUI timeline. One graph is called the “Memory usage” under each GPU. It is the sum of memory kinds device and array used by that process. The graph increases when memory allocation APIs (such as cudaMalloc, cudaMallocManaged) are called and the graph decreases when memory deallocation APIs (such as cudaFree) are called.
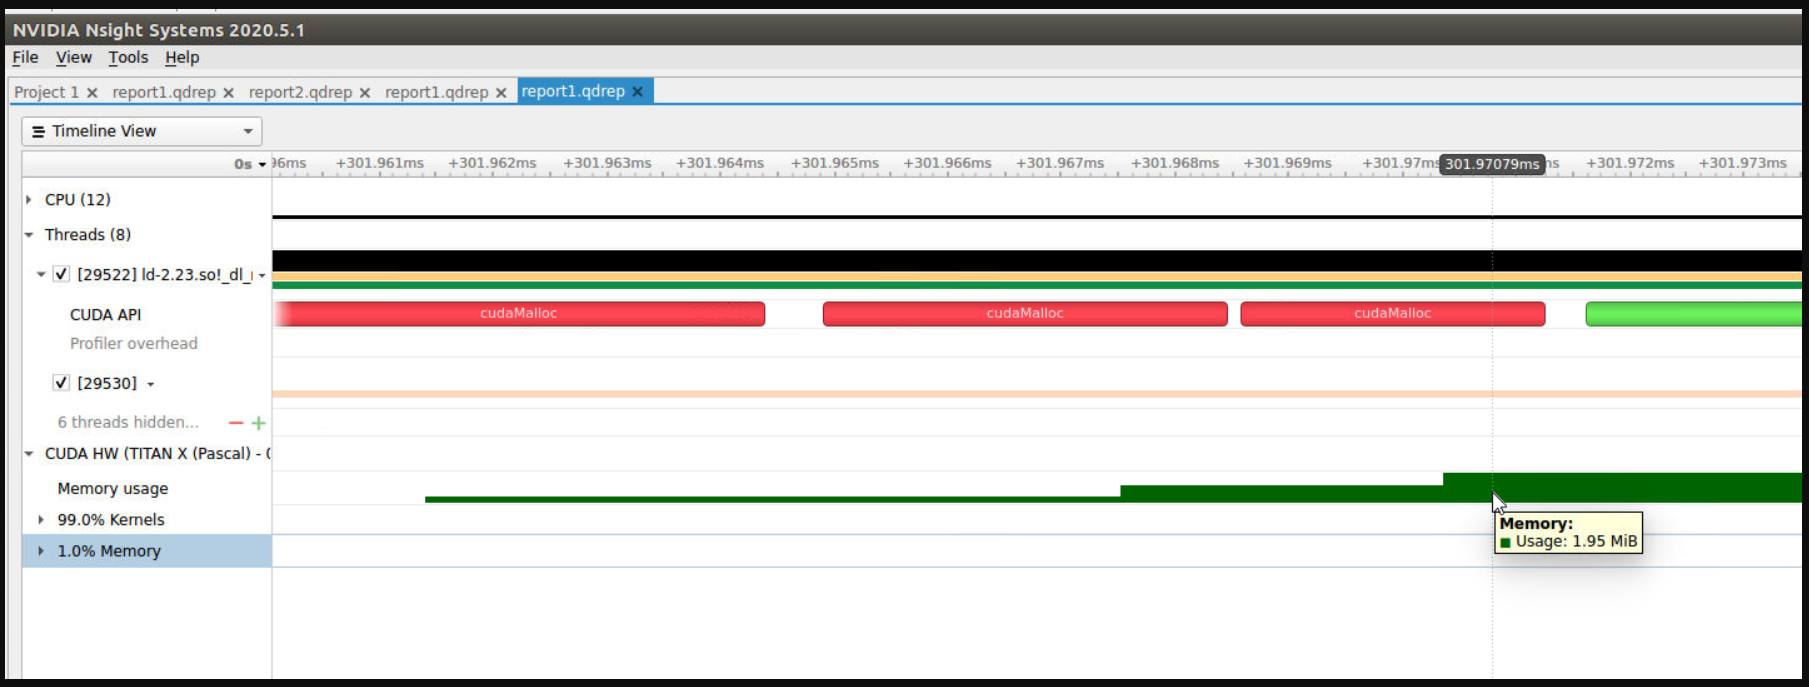
The second graph, titled ‘Managed Memory usage’, shows the managed memory kind, in this case CUPTI_ACTIVITY_MEMORY_KIND_MANAGED, used by that process.
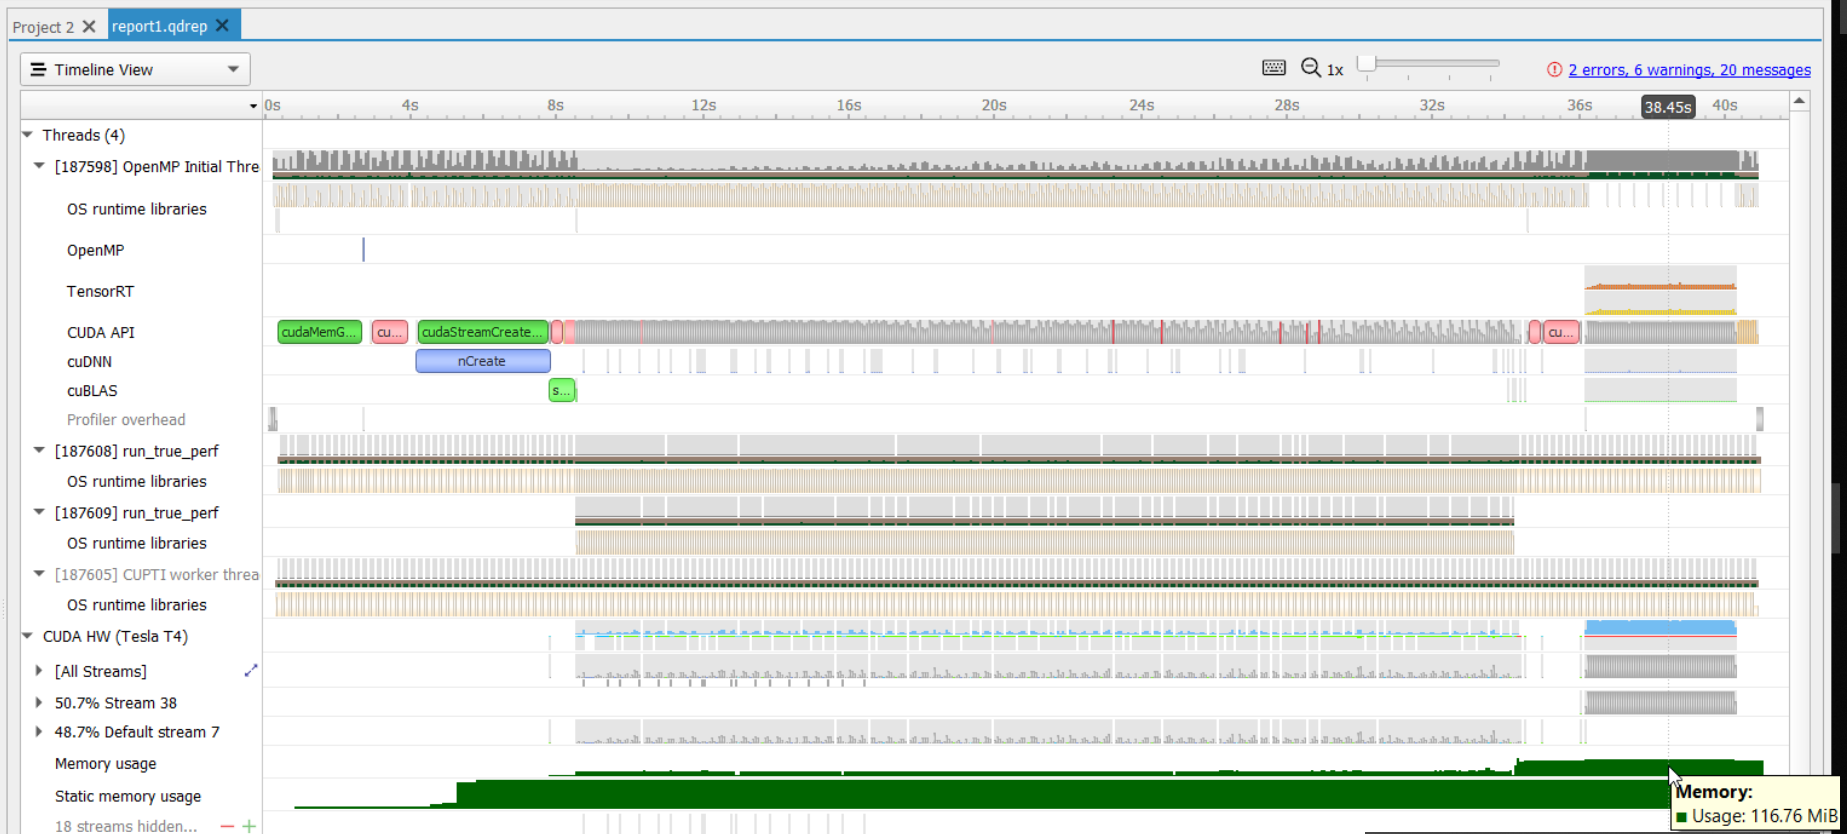
The third graph called “Static Memory usage” is the sum of memory kind device static and managed static used by the process:
CUPTI_ACTIVITY_MEMORY_KIND_DEVICE_STATIC is a static memory allocation. It does not have a context. Since it is static, it is allocated by variable declaration. For example, __device__ int var;
CUPTI_ACTIVITY_MEMORY_KIND_MANAGED_STATIC s static managed allocation. For example, __device__ __managed__ int var; In other words, this is static equivalent of cudaMallocManaged() API.
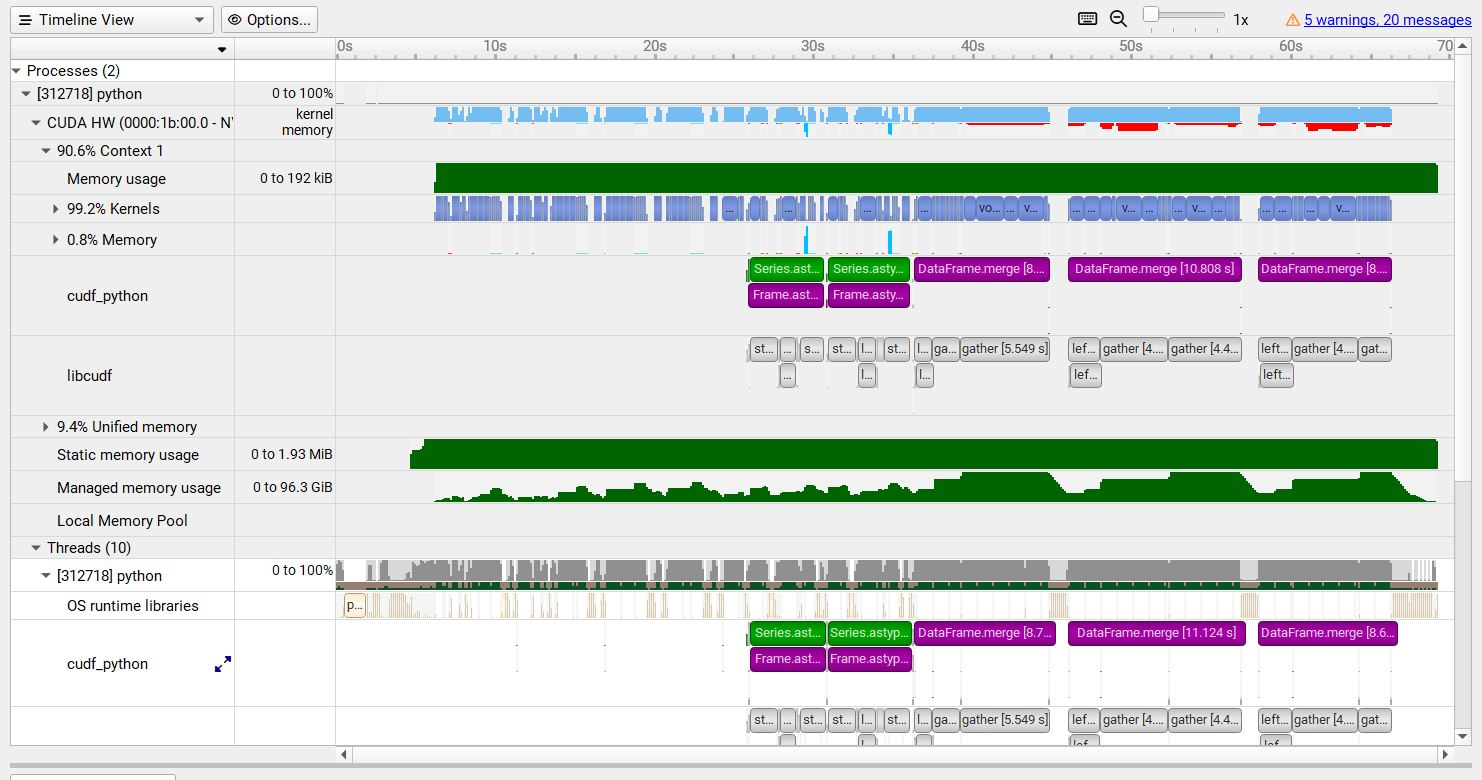
The pageable and pinned are both host-side memory calls, so we don’t show those on the GUI timeline.
Unified Memory Transfer Trace#
For Nsight Systems Workstation Edition, Unified Memory (also called Managed Memory) transfer trace is enabled automatically in Nsight Systems when CUDA trace is selected. It incurs no overhead in programs that do not perform any Unified Memory transfers. Data is displayed in the Managed Memory area of the timeline:
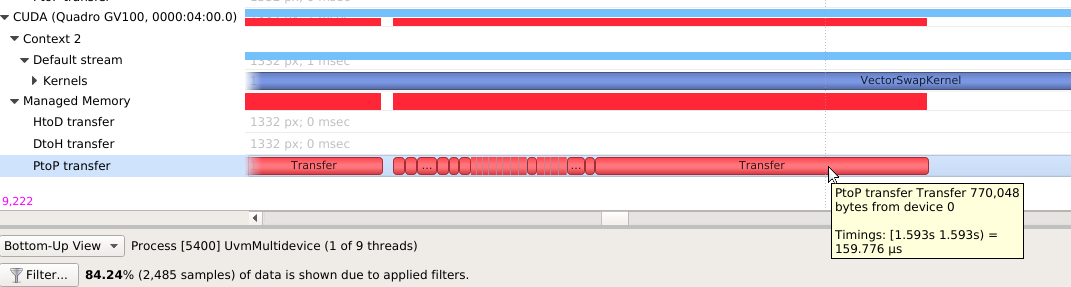
HtoD transfer indicates the CUDA kernel accessed managed memory that was residing on the host, so the kernel execution paused and transferred the data to the device. Heavy traffic here will incur performance penalties in CUDA kernels, so consider using manual cudaMemcpy operations from pinned host memory instead.
PtoP transfer indicates the CUDA kernel accessed managed memory that was residing on a different device, so the kernel execution paused and transferred the data to this device. Heavy traffic here will incur performance penalties, so consider using manual cudaMemcpyPeer operations to transfer from other devices’ memory instead. The row showing these events is for the destination device - the source device is shown in the tooltip for each transfer event.
DtoH transfer indicates the CPU accessed managed memory that was residing on a CUDA device, so the CPU execution paused and transferred the data to system memory. Heavy traffic here will incur performance penalties in CPU code, so consider using manual cudaMemcpy operations from pinned host memory instead.
Some Unified Memory transfers are highlighted with red to indicate potential performance issues:
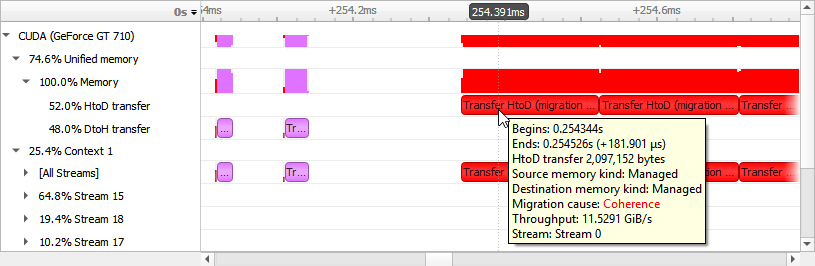
Transfers with the following migration causes are highlighted:
Coherence
Unified Memory migration occurred to guarantee data coherence. SMs (streaming multiprocessors) stop until the migration completes.
Eviction
Unified Memory migrated to the CPU because it was evicted to make room for another block of memory on the GPU. This happens due to memory overcommitment which is available on Linux with Compute Capability ≥ 6.
Unified Memory CPU Page Faults#
The Unified Memory CPU page faults feature in Nsight Systems tracks the page faults that occur when CPU code tries to access a memory page that resides on the device.
Note
Collecting Unified Memory CPU page faults can cause overhead of up to 70% in testing. Use this functionality only when needed.
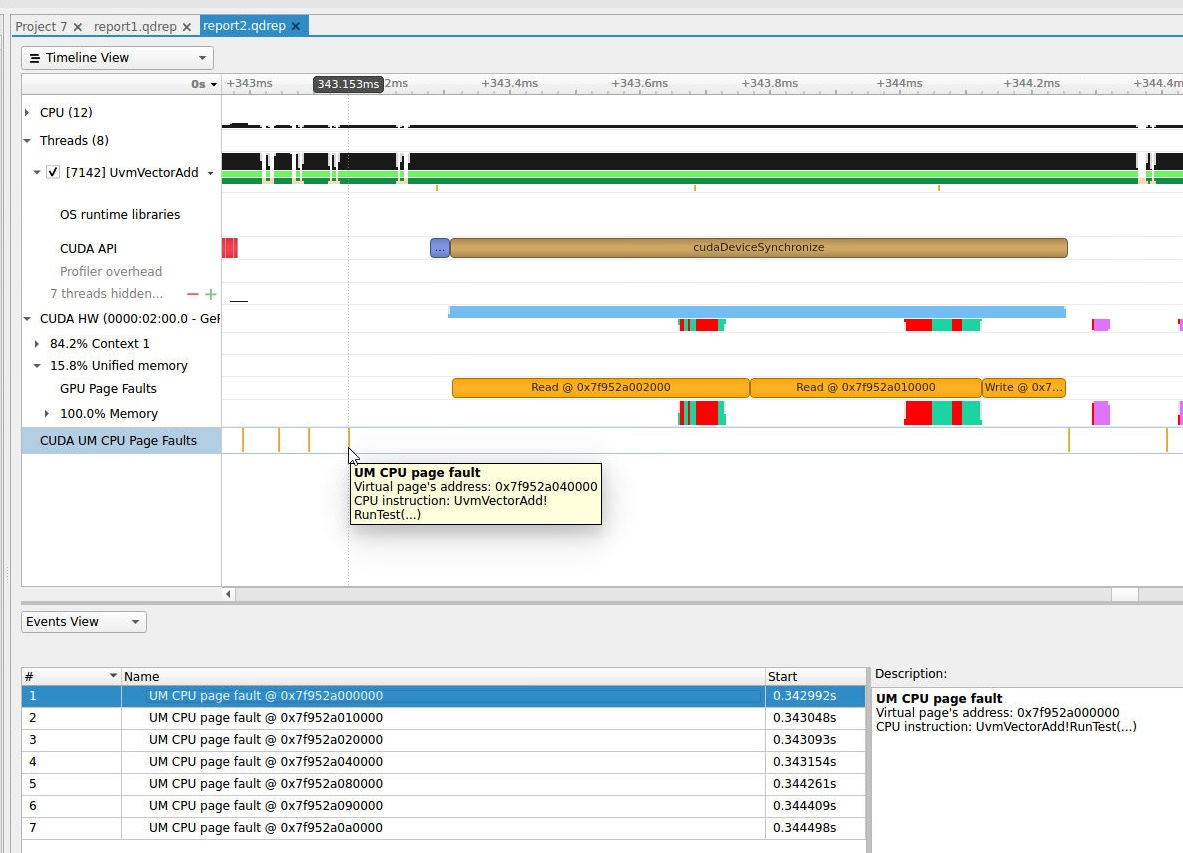
Unified Memory GPU Page Faults#
The Unified Memory GPU page faults feature in Nsight Systems tracks the page faults that occur when GPU code tries to access a memory page that resides on the host.
Note
Collecting Unified Memory GPU page faults can cause overhead of up to 70% in testing. Use this functionality only when needed.
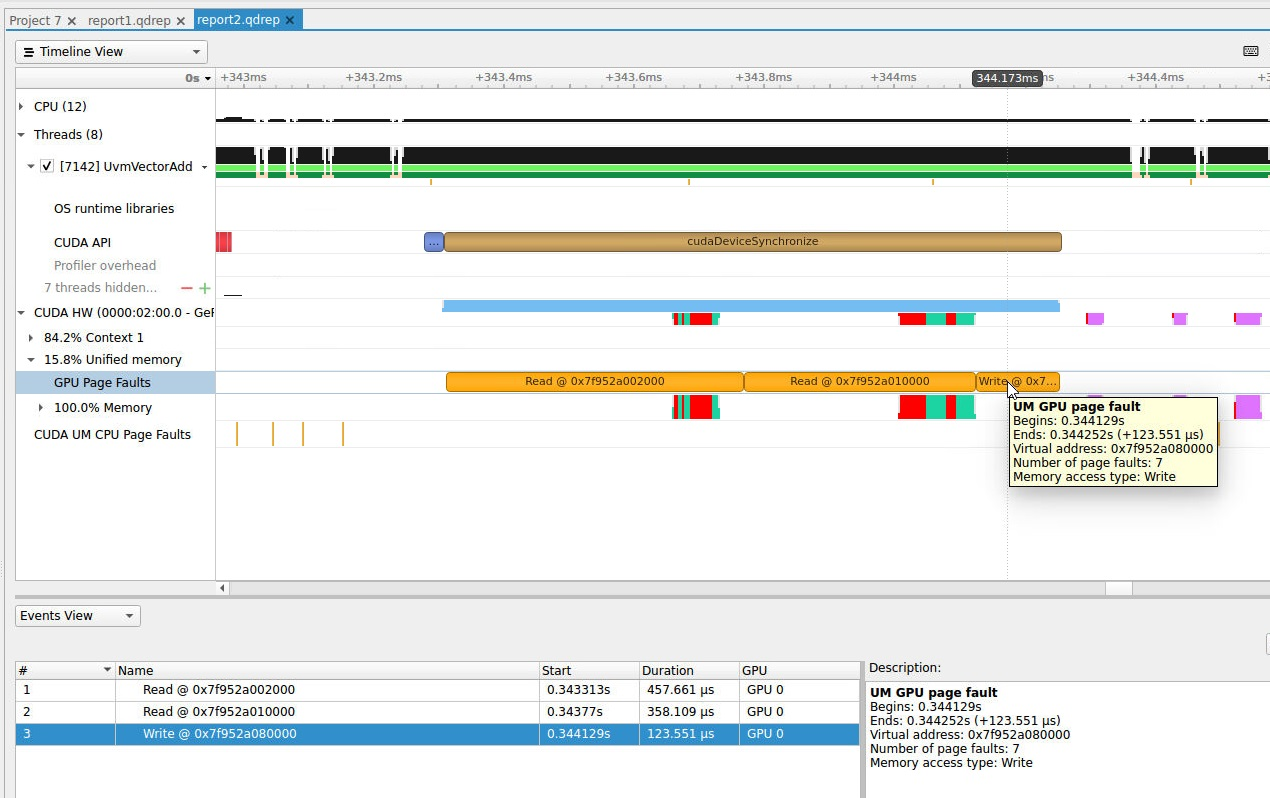
CUDA Graph Trace#
Nsight Systems is capable of capturing information about CUDA graphs in your
application at either the graph or node granularity. This can be set in the CLI
using the --cuda-graph-trace option, or in the GUI by setting the appropriate
drop down.
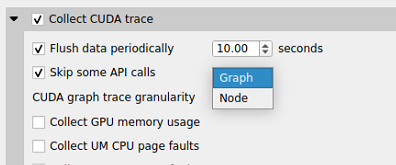
When CUDA graph trace is set to graph, the users sees each graph as one item
on the timeline:
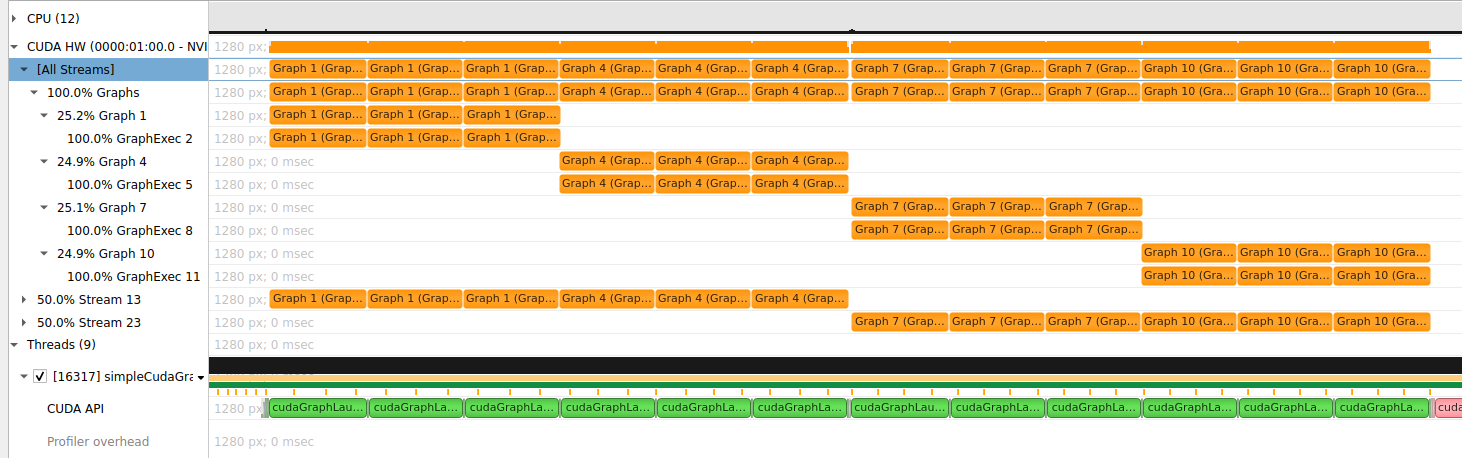
When CUDA graph trace is set to node, the users sees each graph as a set of
nodes on the timeline:
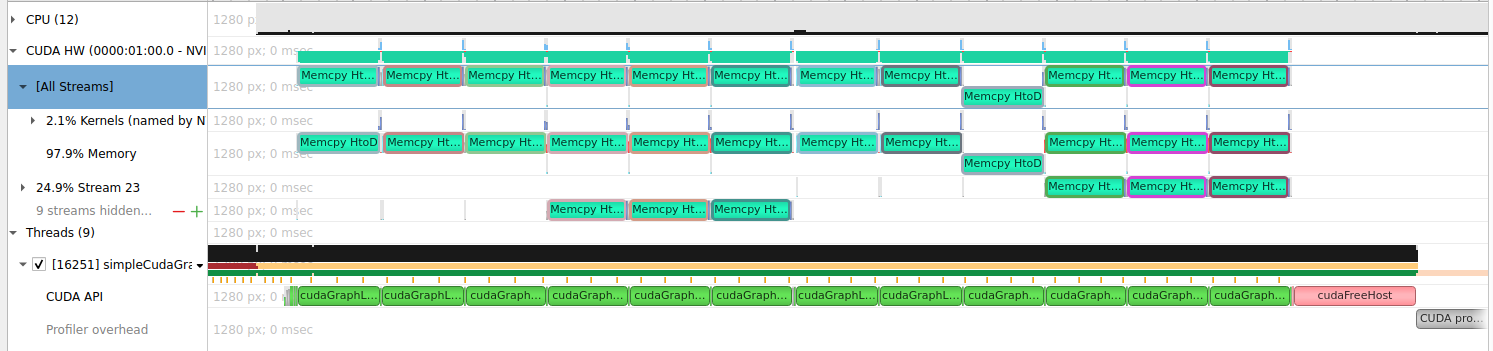
Tracing CUDA graphs at the graph level rather than the tracing the underlying nodes results in significantly less overhead. This option is only available with CUDA driver 515.43 or higher.
CUDA Event Trace#
Nsight Systems is capable of capturing information about CUDA Events
(the synchronization mechanism, e.g. cudaEventRecord(), cudaStreamWaitEvent()
etc.) in your application. This can be set in the CLI using the
--cuda-event-trace option, or in the GUI by setting the appropriate drop
down.
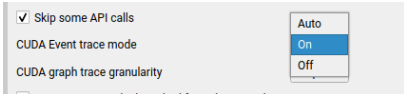
When CUDA event trace is set to true, users can see device-side CUDA event
completion markers in CUDA HW timelines:
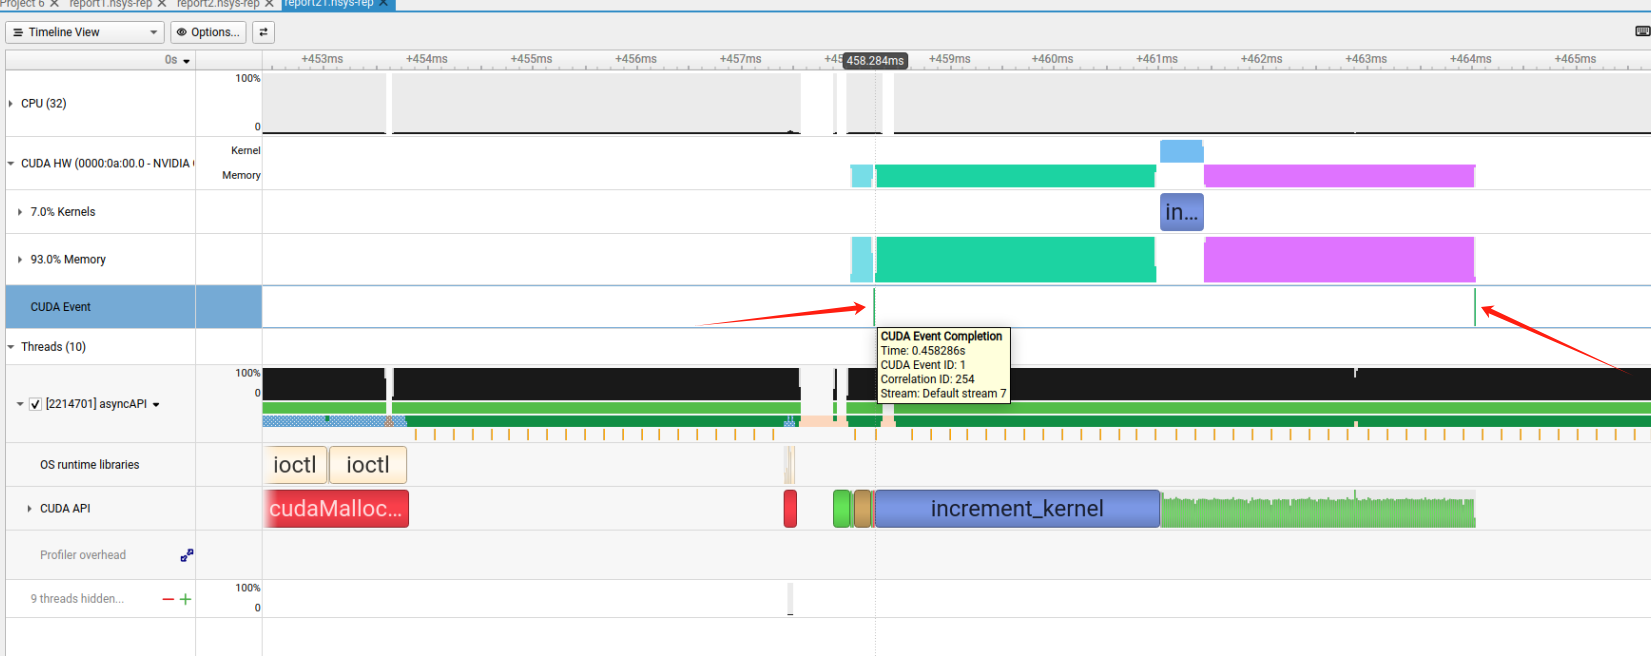
Additionally, there will be better correlation support among CUDA Event APIs, for example when clicking a cudaEventRecord(), the related calls such cudaEventSynchronize(), cudaStreamWaitEvent() that operate on the same CUDA event object will be highlighted:
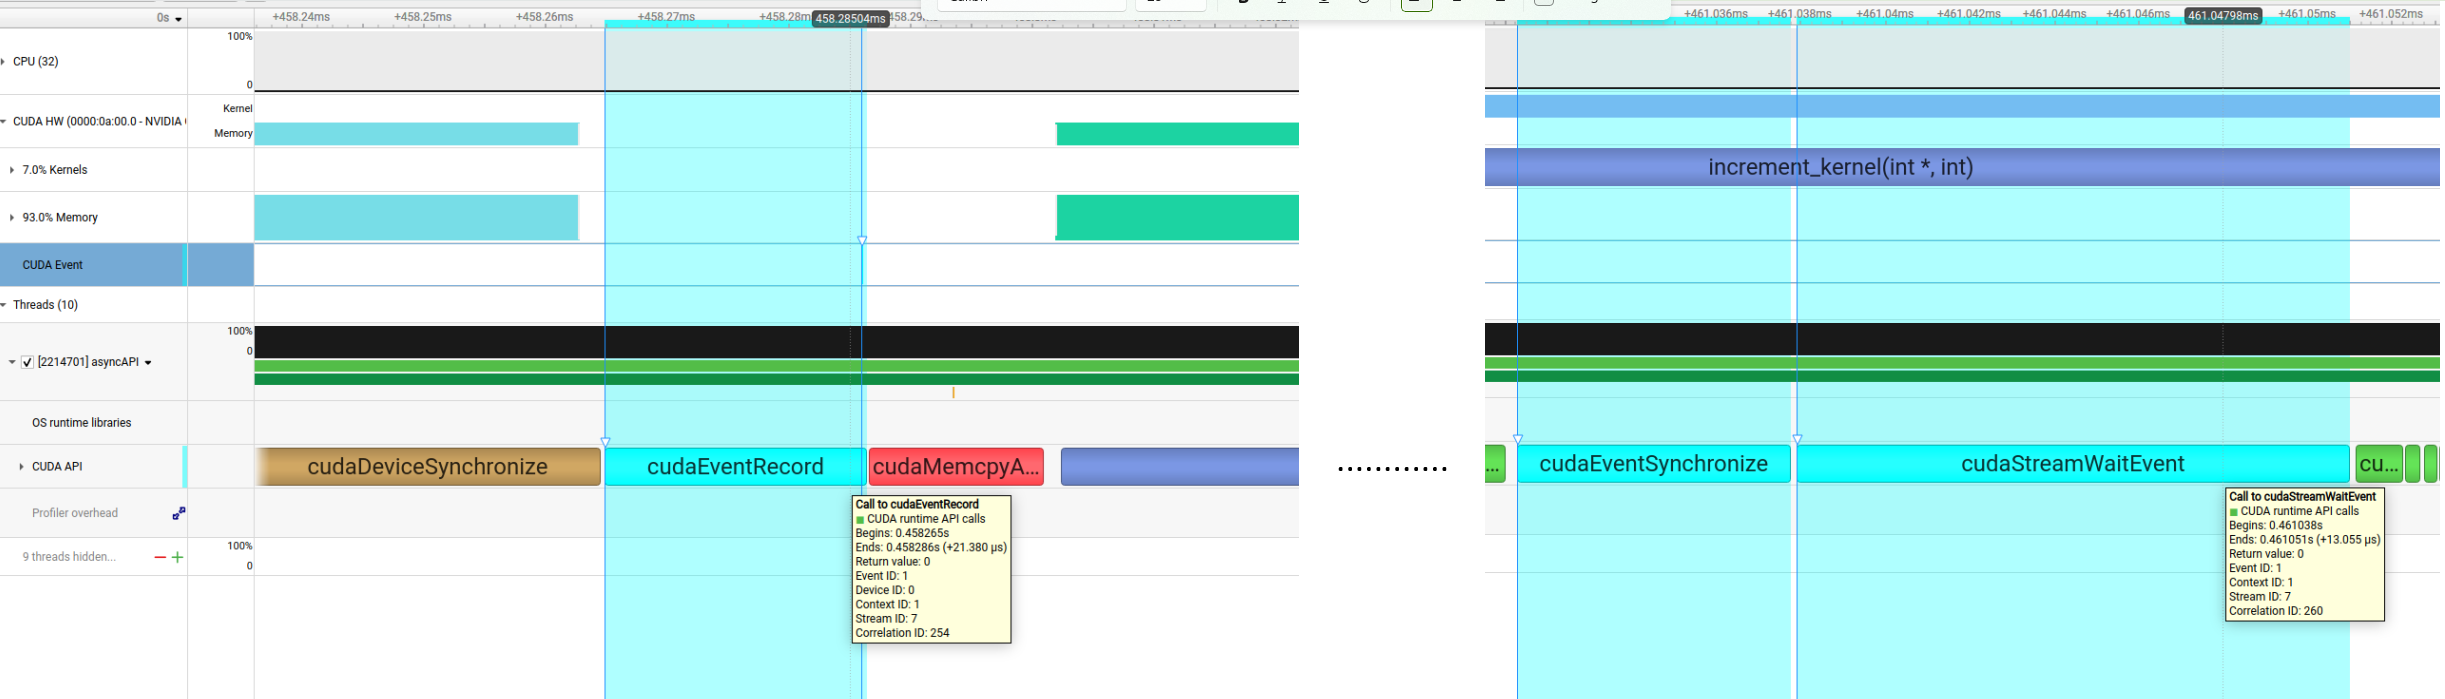
However, there are also some limitations with this feature:
Currently, CUDA Event object created with cudaEventInterprocess flag and/or used in CUDA Graphs are not supported. The support only works under non-IPC and non-CUDA-Graph scenarios.
Currently, the underlying mechanism for tracing device-side CUDA Event completion is same as CUDA Event’s own timing functionality (i.e. with a CUDA Event object is created without cudaEventDisableTiming flag). The mechanism is known to increase the possibility of false dependencies among seemingly unrelated CUDA Streams. Therefore, if the app’s behavior changes with this feature, consider disabling it.
This option is only available with CUDA user-mode driver 12.8 or higher.
CUDA Python Backtrace#
Nsight Systems for Arm server (SBSA) platforms and x86 Linux targets, is capable of capturing Python backtrace information when CUDA backtrace is being captured.
To enable CUDA Python backtrace from Nsight Systems:
CLI — Set --python-backtrace=cuda.
GUI — Select the Collect Python backtrace for selected API calls checkbox.
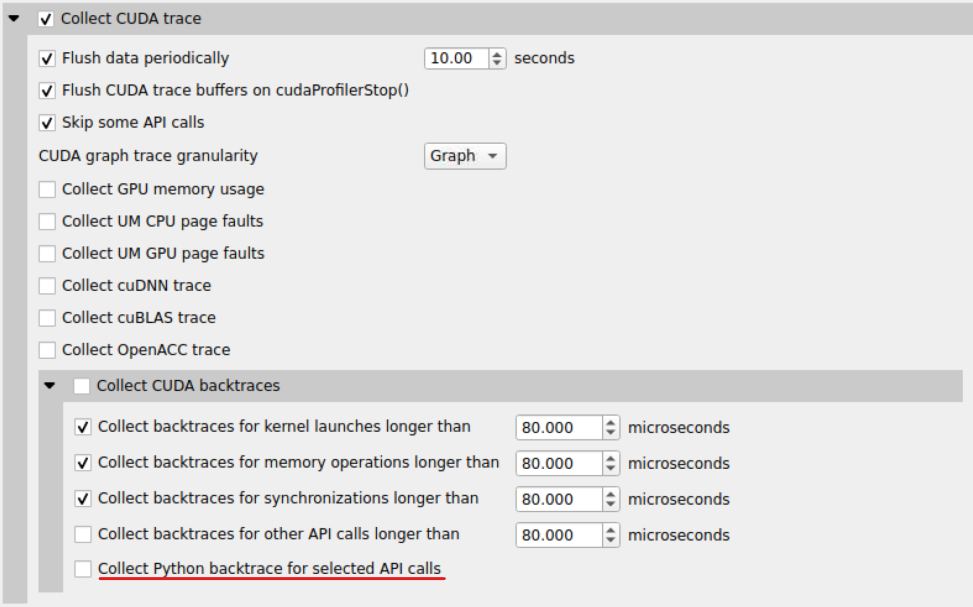
Example screenshot:
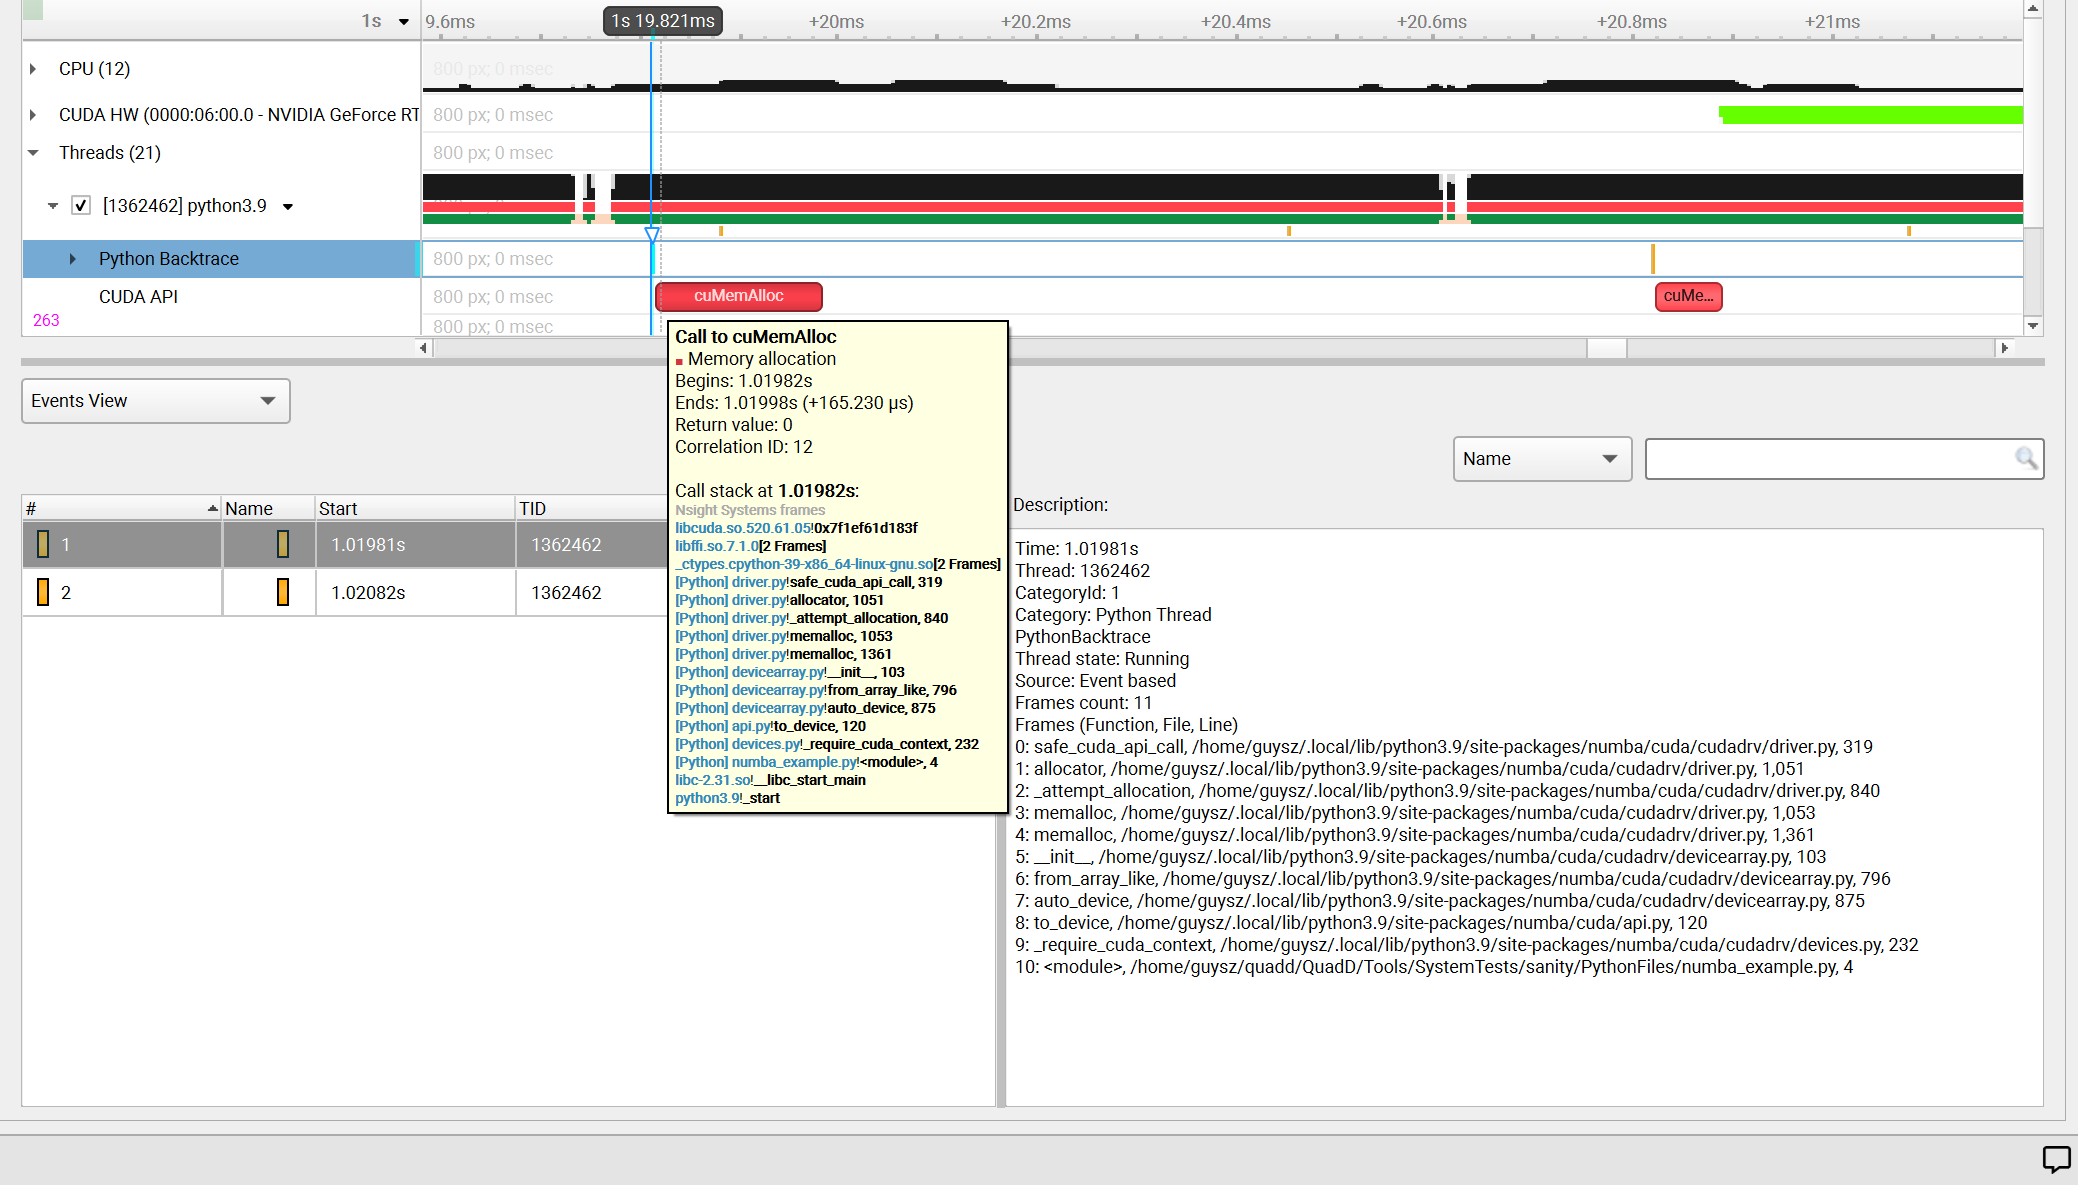
CUDA Functions Skipped by Default#
In order to decrease the overhead of CUDA API trace, Nsight Systems does not trace short duration CUDA functions with little impact on performance.
You can turn on full CUDA API trace using the CLI or the GUI, but since CUDA trace overhead is on a per API call basis, this will dramatically impact your overhead and may lead to non-representative performance analysis.
CUDA Runtime API Calls Skipped by Default
cudaBindSurfaceToArray
cudaBindTexture
cudaBindTexture2D
cudaBindTextureToArray
cudaBindTextureToMipmappedArray
cudaConfigureCall
cudaCreateSurfaceObject
cudaCreateTextureObject
cudaD3D10MapResources
cudaD3D10RegisterResource
cudaD3D10UnmapResources
cudaD3D10UnregisterResource
cudaD3D9MapResources
cudaD3D9MapVertexBuffer
cudaD3D9RegisterResource
cudaD3D9RegisterVertexBuffer
cudaD3D9UnmapResources
cudaD3D9UnmapVertexBuffer
cudaD3D9UnregisterResource
cudaD3D9UnregisterVertexBuffer
cudaDestroySurfaceObject
cudaDestroyTextureObject
cudaDeviceReset
cudaDeviceSynchronize
cudaEGLStreamConsumerAcquireFrame
cudaEGLStreamConsumerConnect
cudaEGLStreamConsumerConnectWithFlags
cudaEGLStreamConsumerDisconnect
cudaEGLStreamConsumerReleaseFrame
cudaEGLStreamConsumerReleaseFrame
cudaEGLStreamProducerConnect
cudaEGLStreamProducerDisconnect
cudaEGLStreamProducerReturnFrame
cudaEventCreate
cudaEventCreateFromEGLSync
cudaEventCreateWithFlags
cudaEventDestroy
cudaEventQuery
cudaEventRecord
cudaEventRecord_ptsz
cudaEventSynchronize
cudaFree
cudaFreeArray
cudaFreeHost
cudaFreeMipmappedArray
cudaGLMapBufferObject
cudaGLMapBufferObjectAsync
cudaGLRegisterBufferObject
cudaGLUnmapBufferObject
cudaGLUnmapBufferObjectAsync
cudaGLUnregisterBufferObject
cudaGraphicsD3D10RegisterResource
cudaGraphicsD3D11RegisterResource
cudaGraphicsD3D9RegisterResource
cudaGraphicsEGLRegisterImage
cudaGraphicsGLRegisterBuffer
cudaGraphicsGLRegisterImage
cudaGraphicsMapResources
cudaGraphicsUnmapResources
cudaGraphicsUnregisterResource
cudaGraphicsVDPAURegisterOutputSurface
cudaGraphicsVDPAURegisterVideoSurface
cudaHostAlloc
cudaHostRegister
cudaHostUnregister
cudaLaunch
cudaLaunchCooperativeKernel
cudaLaunchCooperativeKernelMultiDevice
cudaLaunchCooperativeKernel_ptsz
cudaLaunchKernel
cudaLaunchKernel_ptsz
cudaLaunch_ptsz
cudaMalloc
cudaMalloc3D
cudaMalloc3DArray
cudaMallocArray
cudaMallocHost
cudaMallocManaged
cudaMallocMipmappedArray
cudaMallocPitch
cudaMemGetInfo
cudaMemPrefetchAsync
cudaMemPrefetchAsync_ptsz
cudaMemcpy
cudaMemcpy2D
cudaMemcpy2DArrayToArray
cudaMemcpy2DArrayToArray_ptds
cudaMemcpy2DAsync
cudaMemcpy2DAsync_ptsz
cudaMemcpy2DFromArray
cudaMemcpy2DFromArrayAsync
cudaMemcpy2DFromArrayAsync_ptsz
cudaMemcpy2DFromArray_ptds
cudaMemcpy2DToArray
cudaMemcpy2DToArrayAsync
cudaMemcpy2DToArrayAsync_ptsz
cudaMemcpy2DToArray_ptds
cudaMemcpy2D_ptds
cudaMemcpy3D
cudaMemcpy3DAsync
cudaMemcpy3DAsync_ptsz
cudaMemcpy3DPeer
cudaMemcpy3DPeerAsync
cudaMemcpy3DPeerAsync_ptsz
cudaMemcpy3DPeer_ptds
cudaMemcpy3D_ptds
cudaMemcpyArrayToArray
cudaMemcpyArrayToArray_ptds
cudaMemcpyAsync
cudaMemcpyAsync_ptsz
cudaMemcpyFromArray
cudaMemcpyFromArrayAsync
cudaMemcpyFromArrayAsync_ptsz
cudaMemcpyFromArray_ptds
cudaMemcpyFromSymbol
cudaMemcpyFromSymbolAsync
cudaMemcpyFromSymbolAsync_ptsz
cudaMemcpyFromSymbol_ptds
cudaMemcpyPeer
cudaMemcpyPeerAsync
cudaMemcpyToArray
cudaMemcpyToArrayAsync
cudaMemcpyToArrayAsync_ptsz
cudaMemcpyToArray_ptds
cudaMemcpyToSymbol
cudaMemcpyToSymbolAsync
cudaMemcpyToSymbolAsync_ptsz
cudaMemcpyToSymbol_ptds
cudaMemcpy_ptds
cudaMemset
cudaMemset2D
cudaMemset2DAsync
cudaMemset2DAsync_ptsz
cudaMemset2D_ptds
cudaMemset3D
cudaMemset3DAsync
cudaMemset3DAsync_ptsz
cudaMemset3D_ptds
cudaMemsetAsync
cudaMemsetAsync_ptsz
cudaMemset_ptds
cudaPeerRegister
cudaPeerUnregister
cudaStreamAddCallback
cudaStreamAddCallback_ptsz
cudaStreamAttachMemAsync
cudaStreamAttachMemAsync_ptsz
cudaStreamCreate
cudaStreamCreateWithFlags
cudaStreamCreateWithPriority
cudaStreamDestroy
cudaStreamQuery
cudaStreamQuery_ptsz
cudaStreamSynchronize
cudaStreamSynchronize_ptsz
cudaStreamWaitEvent
cudaStreamWaitEvent_ptsz
cudaThreadSynchronize
cudaUnbindTexture
CUDA Primary API Calls Skipped by Default
cu64Array3DCreate
cu64ArrayCreate
cu64D3D9MapVertexBuffer
cu64GLMapBufferObject
cu64GLMapBufferObjectAsync
cu64MemAlloc
cu64MemAllocPitch
cu64MemFree
cu64MemGetInfo
cu64MemHostAlloc
cu64Memcpy2D
cu64Memcpy2DAsync
cu64Memcpy2DUnaligned
cu64Memcpy3D
cu64Memcpy3DAsync
cu64MemcpyAtoD
cu64MemcpyDtoA
cu64MemcpyDtoD
cu64MemcpyDtoDAsync
cu64MemcpyDtoH
cu64MemcpyDtoHAsync
cu64MemcpyHtoD
cu64MemcpyHtoDAsync
cu64MemsetD16
cu64MemsetD16Async
cu64MemsetD2D16
cu64MemsetD2D16Async
cu64MemsetD2D32
cu64MemsetD2D32Async
cu64MemsetD2D8
cu64MemsetD2D8Async
cu64MemsetD32
cu64MemsetD32Async
cu64MemsetD8
cu64MemsetD8Async
cuArray3DCreate
cuArray3DCreate_v2
cuArrayCreate
cuArrayCreate_v2
cuArrayDestroy
cuBinaryFree
cuCompilePtx
cuCtxCreate
cuCtxCreate_v2
cuCtxDestroy
cuCtxDestroy_v2
cuCtxSynchronize
cuD3D10CtxCreate
cuD3D10CtxCreateOnDevice
cuD3D10CtxCreate_v2
cuD3D10MapResources
cuD3D10RegisterResource
cuD3D10UnmapResources
cuD3D10UnregisterResource
cuD3D11CtxCreate
cuD3D11CtxCreateOnDevice
cuD3D11CtxCreate_v2
cuD3D9CtxCreate
cuD3D9CtxCreateOnDevice
cuD3D9CtxCreate_v2
cuD3D9MapResources
cuD3D9MapVertexBuffer
cuD3D9MapVertexBuffer_v2
cuD3D9RegisterResource
cuD3D9RegisterVertexBuffer
cuD3D9UnmapResources
cuD3D9UnmapVertexBuffer
cuD3D9UnregisterResource
cuD3D9UnregisterVertexBuffer
cuEGLStreamConsumerAcquireFrame
cuEGLStreamConsumerConnect
cuEGLStreamConsumerConnectWithFlags
cuEGLStreamConsumerDisconnect
cuEGLStreamConsumerReleaseFrame
cuEGLStreamProducerConnect
cuEGLStreamProducerDisconnect
cuEGLStreamProducerPresentFrame
cuEGLStreamProducerReturnFrame
cuEventCreate
cuEventCreateFromEGLSync
cuEventCreateFromNVNSync
cuEventDestroy
cuEventDestroy_v2
cuEventQuery
cuEventRecord
cuEventRecord_ptsz
cuEventSynchronize
cuGLCtxCreate
cuGLCtxCreate_v2
cuGLInit
cuGLMapBufferObject
cuGLMapBufferObjectAsync
cuGLMapBufferObjectAsync_v2
cuGLMapBufferObjectAsync_v2_ptsz
cuGLMapBufferObject_v2
cuGLMapBufferObject_v2_ptds
cuGLRegisterBufferObject
cuGLUnmapBufferObject
cuGLUnmapBufferObjectAsync
cuGLUnregisterBufferObject
cuGraphicsD3D10RegisterResource
cuGraphicsD3D11RegisterResource
cuGraphicsD3D9RegisterResource
cuGraphicsEGLRegisterImage
cuGraphicsGLRegisterBuffer
cuGraphicsGLRegisterImage
cuGraphicsMapResources
cuGraphicsMapResources_ptsz
cuGraphicsUnmapResources
cuGraphicsUnmapResources_ptsz
cuGraphicsUnregisterResource
cuGraphicsVDPAURegisterOutputSurface
cuGraphicsVDPAURegisterVideoSurface
cuInit
cuLaunch
cuLaunchCooperativeKernel
cuLaunchCooperativeKernelMultiDevice
cuLaunchCooperativeKernel_ptsz
cuLaunchGrid
cuLaunchGridAsync
cuLaunchKernel
cuLaunchKernel_ptsz
cuLinkComplete
cuLinkCreate
cuLinkCreate_v2
cuLinkDestroy
cuMemAlloc
cuMemAllocHost
cuMemAllocHost_v2
cuMemAllocManaged
cuMemAllocPitch
cuMemAllocPitch_v2
cuMemAlloc_v2
cuMemFree
cuMemFreeHost
cuMemFree_v2
cuMemGetInfo
cuMemGetInfo_v2
cuMemHostAlloc
cuMemHostAlloc_v2
cuMemHostRegister
cuMemHostRegister_v2
cuMemHostUnregister
cuMemPeerRegister
cuMemPeerUnregister
cuMemPrefetchAsync
cuMemPrefetchAsync_ptsz
cuMemcpy
cuMemcpy2D
cuMemcpy2DAsync
cuMemcpy2DAsync_v2
cuMemcpy2DAsync_v2_ptsz
cuMemcpy2DUnaligned
cuMemcpy2DUnaligned_v2
cuMemcpy2DUnaligned_v2_ptds
cuMemcpy2D_v2
cuMemcpy2D_v2_ptds
cuMemcpy3D
cuMemcpy3DAsync
cuMemcpy3DAsync_v2
cuMemcpy3DAsync_v2_ptsz
cuMemcpy3DPeer
cuMemcpy3DPeerAsync
cuMemcpy3DPeerAsync_ptsz
cuMemcpy3DPeer_ptds
cuMemcpy3D_v2
cuMemcpy3D_v2_ptds
cuMemcpyAsync
cuMemcpyAsync_ptsz
cuMemcpyAtoA
cuMemcpyAtoA_v2
cuMemcpyAtoA_v2_ptds
cuMemcpyAtoD
cuMemcpyAtoD_v2
cuMemcpyAtoD_v2_ptds
cuMemcpyAtoH
cuMemcpyAtoHAsync
cuMemcpyAtoHAsync_v2
cuMemcpyAtoHAsync_v2_ptsz
cuMemcpyAtoH_v2
cuMemcpyAtoH_v2_ptds
cuMemcpyDtoA
cuMemcpyDtoA_v2
cuMemcpyDtoA_v2_ptds
cuMemcpyDtoD
cuMemcpyDtoDAsync
cuMemcpyDtoDAsync_v2
cuMemcpyDtoDAsync_v2_ptsz
cuMemcpyDtoD_v2
cuMemcpyDtoD_v2_ptds
cuMemcpyDtoH
cuMemcpyDtoHAsync
cuMemcpyDtoHAsync_v2
cuMemcpyDtoHAsync_v2_ptsz
cuMemcpyDtoH_v2
cuMemcpyDtoH_v2_ptds
cuMemcpyHtoA
cuMemcpyHtoAAsync
cuMemcpyHtoAAsync_v2
cuMemcpyHtoAAsync_v2_ptsz
cuMemcpyHtoA_v2
cuMemcpyHtoA_v2_ptds
cuMemcpyHtoD
cuMemcpyHtoDAsync
cuMemcpyHtoDAsync_v2
cuMemcpyHtoDAsync_v2_ptsz
cuMemcpyHtoD_v2
cuMemcpyHtoD_v2_ptds
cuMemcpyPeer
cuMemcpyPeerAsync
cuMemcpyPeerAsync_ptsz
cuMemcpyPeer_ptds
cuMemcpy_ptds
cuMemcpy_v2
cuMemsetD16
cuMemsetD16Async
cuMemsetD16Async_ptsz
cuMemsetD16_v2
cuMemsetD16_v2_ptds
cuMemsetD2D16
cuMemsetD2D16Async
cuMemsetD2D16Async_ptsz
cuMemsetD2D16_v2
cuMemsetD2D16_v2_ptds
cuMemsetD2D32
cuMemsetD2D32Async
cuMemsetD2D32Async_ptsz
cuMemsetD2D32_v2
cuMemsetD2D32_v2_ptds
cuMemsetD2D8
cuMemsetD2D8Async
cuMemsetD2D8Async_ptsz
cuMemsetD2D8_v2
cuMemsetD2D8_v2_ptds
cuMemsetD32
cuMemsetD32Async
cuMemsetD32Async_ptsz
cuMemsetD32_v2
cuMemsetD32_v2_ptds
cuMemsetD8
cuMemsetD8Async
cuMemsetD8Async_ptsz
cuMemsetD8_v2
cuMemsetD8_v2_ptds
cuMipmappedArrayCreate
cuMipmappedArrayDestroy
cuModuleLoad
cuModuleLoadData
cuModuleLoadDataEx
cuModuleLoadFatBinary
cuModuleUnload
cuStreamAddCallback
cuStreamAddCallback_ptsz
cuStreamAttachMemAsync
cuStreamAttachMemAsync_ptsz
cuStreamBatchMemOp
cuStreamBatchMemOp_ptsz
cuStreamCreate
cuStreamCreateWithPriority
cuStreamDestroy
cuStreamDestroy_v2
cuStreamSynchronize
cuStreamSynchronize_ptsz
cuStreamWaitEvent
cuStreamWaitEvent_ptsz
cuStreamWaitValue32
cuStreamWaitValue32_ptsz
cuStreamWaitValue64
cuStreamWaitValue64_ptsz
cuStreamWriteValue32
cuStreamWriteValue32_ptsz
cuStreamWriteValue64
cuStreamWriteValue64_ptsz
cuSurfObjectCreate
cuSurfObjectDestroy
cuSurfRefCreate
cuSurfRefDestroy
cuTexObjectCreate
cuTexObjectDestroy
cuTexRefCreate
cuTexRefDestroy
cuVDPAUCtxCreate
cuVDPAUCtxCreate_v2
cuDNN Function List for X86 CLI#
cuDNN API functions
cudnnActivationBackward
cudnnActivationBackward_v3
cudnnActivationBackward_v4
cudnnActivationForward
cudnnActivationForward_v3
cudnnActivationForward_v4
cudnnAddTensor
cudnnBatchNormalizationBackward
cudnnBatchNormalizationBackwardEx
cudnnBatchNormalizationForwardInference
cudnnBatchNormalizationForwardTraining
cudnnBatchNormalizationForwardTrainingEx
cudnnCTCLoss
cudnnConvolutionBackwardBias
cudnnConvolutionBackwardData
cudnnConvolutionBackwardFilter
cudnnConvolutionBiasActivationForward
cudnnConvolutionForward
cudnnCreate
cudnnCreateAlgorithmPerformance
cudnnDestroy
cudnnDestroyAlgorithmPerformance
cudnnDestroyPersistentRNNPlan
cudnnDivisiveNormalizationBackward
cudnnDivisiveNormalizationForward
cudnnDropoutBackward
cudnnDropoutForward
cudnnDropoutGetReserveSpaceSize
cudnnDropoutGetStatesSize
cudnnFindConvolutionBackwardDataAlgorithm
cudnnFindConvolutionBackwardDataAlgorithmEx
cudnnFindConvolutionBackwardFilterAlgorithm
cudnnFindConvolutionBackwardFilterAlgorithmEx
cudnnFindConvolutionForwardAlgorithm
cudnnFindConvolutionForwardAlgorithmEx
cudnnFindRNNBackwardDataAlgorithmEx
cudnnFindRNNBackwardWeightsAlgorithmEx
cudnnFindRNNForwardInferenceAlgorithmEx
cudnnFindRNNForwardTrainingAlgorithmEx
cudnnFusedOpsExecute
cudnnIm2Col
cudnnLRNCrossChannelBackward
cudnnLRNCrossChannelForward
cudnnMakeFusedOpsPlan
cudnnMultiHeadAttnBackwardData
cudnnMultiHeadAttnBackwardWeights
cudnnMultiHeadAttnForward
cudnnOpTensor
cudnnPoolingBackward
cudnnPoolingForward
cudnnRNNBackwardData
cudnnRNNBackwardDataEx
cudnnRNNBackwardWeights
cudnnRNNBackwardWeightsEx
cudnnRNNForwardInference
cudnnRNNForwardInferenceEx
cudnnRNNForwardTraining
cudnnRNNForwardTrainingEx
cudnnReduceTensor
cudnnReorderFilterAndBias
cudnnRestoreAlgorithm
cudnnRestoreDropoutDescriptor
cudnnSaveAlgorithm
cudnnScaleTensor
cudnnSoftmaxBackward
cudnnSoftmaxForward
cudnnSpatialTfGridGeneratorBackward
cudnnSpatialTfGridGeneratorForward
cudnnSpatialTfSamplerBackward
cudnnSpatialTfSamplerForward
cudnnTransformFilter
cudnnTransformTensor
cudnnTransformTensorEx
OpenMP Trace#
Nsight Systems for Linux is capable of capturing information about OpenMP events. This functionality is built on the OpenMP Tools Interface (OMPT), full support is available only for runtime libraries supporting tools interface defined in OpenMP 5.0 or greater.
As an example, LLVM OpenMP runtime library partially implements tools interface. If you use PGI compiler <= 20.4 to build your OpenMP applications, add the -mp=libomp switch to use LLVM OpenMP runtime and enable OMPT based tracing. If you use Clang, make sure the LLVM OpenMP runtime library you link to was compiled with tools interface enabled.
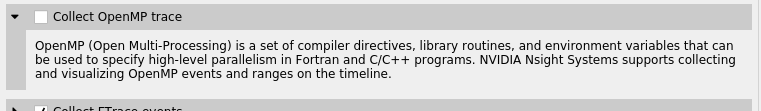
Only a subset of the OMPT callbacks are processed:
ompt_callback_parallel_begin
ompt_callback_parallel_end
ompt_callback_sync_region
ompt_callback_task_create
ompt_callback_task_schedule
ompt_callback_implicit_task
ompt_callback_master
ompt_callback_reduction
ompt_callback_task_create
ompt_callback_cancel
ompt_callback_mutex_acquire, ompt_callback_mutex_acquired
ompt_callback_mutex_acquired, ompt_callback_mutex_released
ompt_callback_mutex_released
ompt_callback_work
ompt_callback_dispatch
ompt_callback_flush
Note
The raw OMPT events are used to generate ranges indicating the runtime of OpenMP operations and constructs.
Example screenshot:
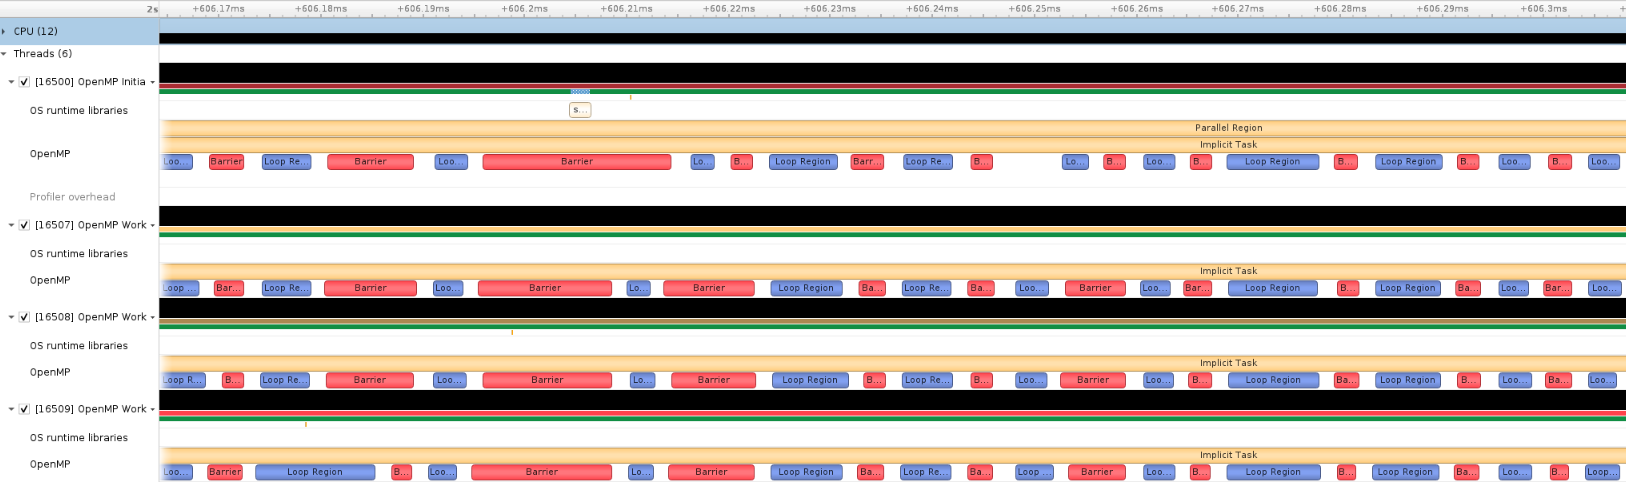
OS Runtime Libraries Trace#
On Linux, OS runtime libraries can be traced to gather information about low-level userspace APIs. This traces the system call wrappers and thread synchronization interfaces exposed by the C runtime and POSIX Threads (pthread) libraries. This does not perform a complete runtime library API trace, but instead focuses on the functions that can take a long time to execute, or could potentially cause your thread be unscheduled from the CPU while waiting for an event to complete. OS runtime trace is not available for Windows targets.
OS runtime tracing complements and enhances sampling information by:
Visualizing when the process is communicating with the hardware, controlling resources, performing multi-threading synchronization or interacting with the kernel scheduler.
Adding additional thread states by correlating how OS runtime libraries traces affect the thread scheduling:
Waiting — the thread is not scheduled on a CPU, it is inside of an OS runtime libraries trace and is believed to be waiting on the firmware to complete a request.
In OS runtime library function — the thread is scheduled on a CPU and inside of an OS runtime libraries trace. If the trace represents a system call, the process is likely running in kernel mode.
Collecting backtraces for long OS runtime libraries call. This provides a way to gather blocked-state backtraces, allowing you to gain more context about why the thread was blocked so long, yet avoiding unnecessary overhead for short events.
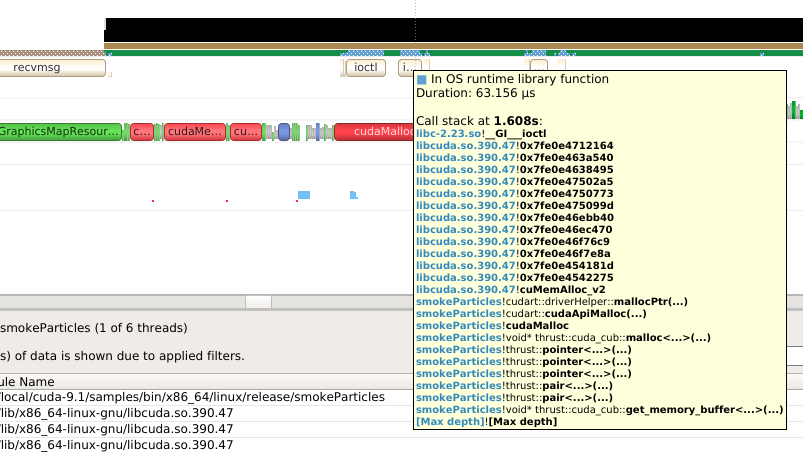
Collecting file access data for API calls that interact with files. This helps in identifying performance bottlenecks related to file I/O operations and provides insights into how file access patterns affect overall application performance.
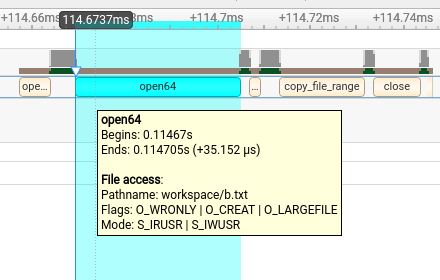
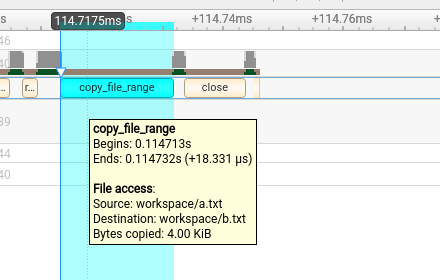
Note
File access data collection is not enabled by default.
To enable OS runtime libraries tracing from Nsight Systems:
CLI — Use the -t, --trace option with the osrt parameter. See
Command Line Options for more information.
GUI — Select the Collect OS runtime libraries trace checkbox.
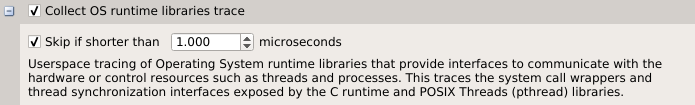
You can also use Skip if shorter than. This will skip calls shorter than the given threshold. Enabling this option will improve performances as well as reduce noise on the timeline. We strongly encourage you to skip OS runtime libraries call shorter than 1 μs.
Locking a Resource#
The functions listed below receive a special treatment. If the tool detects that the resource is already acquired by another thread and will induce a blocking call, we always trace it. Otherwise, it will never be traced.
pthread_mutex_lock
pthread_rwlock_rdlock
pthread_rwlock_wrlock
pthread_spin_lock
sem_wait
Note that even if a call is determined as potentially blocking, there is a chance that it may not actually block after a few cycles have elapsed. The call will still be traced in this scenario.
Limitations#
Nsight Systems only traces syscall wrappers exposed by the C runtime. It is not able to trace syscall invoked through assembly code.
Additional thread states, as well as backtrace collection on long calls, are only enabled if sampling is turned on.
It is not possible to configure the depth and duration threshold when collecting backtraces. Currently, only OS runtime libraries calls longer than 80 μs will generate a backtrace with a maximum of 24 frames. This limitation will be removed in a future version of the product.
It is required to compile your application and libraries with the
-funwind-tablescompiler flag in order for Nsight Systems to unwind the backtraces correctly.
OS Runtime Libraries Trace Filters#
The OS runtime libraries tracing is limited to a select list of functions. It also depends on the version of the C runtime linked to the application.
OS Runtime Default Function List#
Libc system call wrappers
accept
accept4
acct
alarm
arch_prctl
bind
bpf
brk
chroot
clock_nanosleep
connect
copy_file_range
creat
creat64
dup
dup2
dup3
epoll_ctl
epoll_pwait
epoll_wait
fallocate
fallocate64
fcntl
fdatasync
flock
fork
fsync
ftruncate
futex
ioctl
ioperm
iopl
kill
killpg
listen
membarrier
mlock
mlock2
mlockall
mmap
mmap64
mount
move_pages
mprotect
mq_notify
mq_open
mq_receive
mq_send
mq_timedreceive
mq_timedsend
mremap
msgctl
msgget
msgrcv
msgsnd
msync
munmap
nanosleep
nfsservctl
open
open64
openat
openat64
pause
pipe
pipe2
pivot_root
poll
ppoll
prctl
pread
pread64
preadv
preadv2
preadv64
process_vm_readv
process_vm_writev
pselect6
ptrace
pwrite
pwrite64
pwritev
pwritev2
pwritev64
read
readv
reboot
recv
recvfrom
recvmmsg
recvmsg
rt_sigaction
rt_sigqueueinfo
rt_sigsuspend
rt_sigtimedwait
sched_yield
seccomp
select
semctl
semget
semop
semtimedop
send
sendfile
sendfile64
sendmmsg
sendmsg
sendto
shmat
shmctl
shmdt
shmget
shutdown
sigaction
sigsuspend
sigtimedwait
socket
socketpair
splice
swapoff
swapon
sync
sync_file_range
syncfs
tee
tgkill
tgsigqueueinfo
tkill
truncate
umount2
unshare
uselib
vfork
vhangup
vmsplice
wait
wait3
wait4
waitid
waitpid
write
writev
_sysctl
POSIX Threads
pthread_barrier_wait
pthread_cancel
pthread_cond_broadcast
pthread_cond_signal
pthread_cond_timedwait
pthread_cond_wait
pthread_create
pthread_join
pthread_kill
pthread_mutex_lock
pthread_mutex_timedlock
pthread_mutex_trylock
pthread_rwlock_rdlock
pthread_rwlock_timedrdlock
pthread_rwlock_timedwrlock
pthread_rwlock_tryrdlock
pthread_rwlock_trywrlock
pthread_rwlock_wrlock
pthread_spin_lock
pthread_spin_trylock
pthread_timedjoin_np
pthread_tryjoin_np
pthread_yield
sem_timedwait
sem_trywait
sem_wait
I/O
aio_fsync
aio_fsync64
aio_suspend
aio_suspend64
fclose
fcloseall
fflush
fflush_unlocked
fgetc
fgetc_unlocked
fgets
fgets_unlocked
fgetwc
fgetwc_unlocked
fgetws
fgetws_unlocked
flockfile
fopen
fopen64
fputc
fputc_unlocked
fputs
fputs_unlocked
fputwc
fputwc_unlocked
fputws
fputws_unlocked
fread
fread_unlocked
freopen
freopen64
ftrylockfile
fwrite
fwrite_unlocked
getc
getc_unlocked
getdelim
getline
getw
getwc
getwc_unlocked
lockf
lockf64
mkfifo
mkfifoat
posix_fallocate
posix_fallocate64
putc
putc_unlocked
putwc
putwc_unlocked
Miscellaneous
forkpty
popen
posix_spawn
posix_spawnp
sigwait
sigwaitinfo
sleep
system
usleep
Syscall Trace#
Nsight Systems for Linux and Nsight Systems Embedded Platforms Edition are capable of tracing Linux system calls in kernel space. This feature uses Linux’s eBPF technology, and is supported on systems running Linux v5.11 or newer, specifically those that are built with CONFIG_DEBUG_INFO_BTF enabled, which is the default on most major Linux distros. This feature requires CAP_BPF and CAP_PERFMON capabilities (alternatively, CAP_SYS_ADMIN or root privileges) for the nsys process, see the capabilities man page for details.
To enable this feature:
CLI — Add the --syscall option to the nsys start or nsys profile commands (setting syscall in the --trace option is deprecated and will be ignored). The following values are supported:
none— No syscall tracing [default].process-tree— Collect syscalls for the profiled application process and its child processes.pid-namespace— Collect syscalls made by all processes in the current PID namespace and its child namespaces. This is very close to how other features work in thesystem-widemode, e.g. inside a container, tracing will be limited to this container.
GUI — Select the Collect syscall trace checkbox. Currently, equivalent to the --syscall=process-tree option.
Please note that only syscalls running 1000ns and more are traced.
Example screenshot:
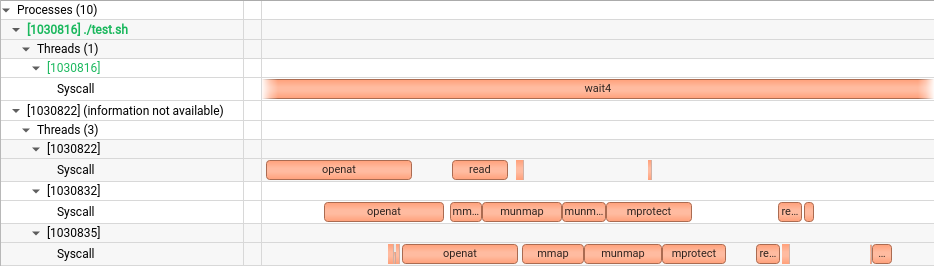
Long running (more than 80 microseconds) syscalls are also collected with their backtraces:
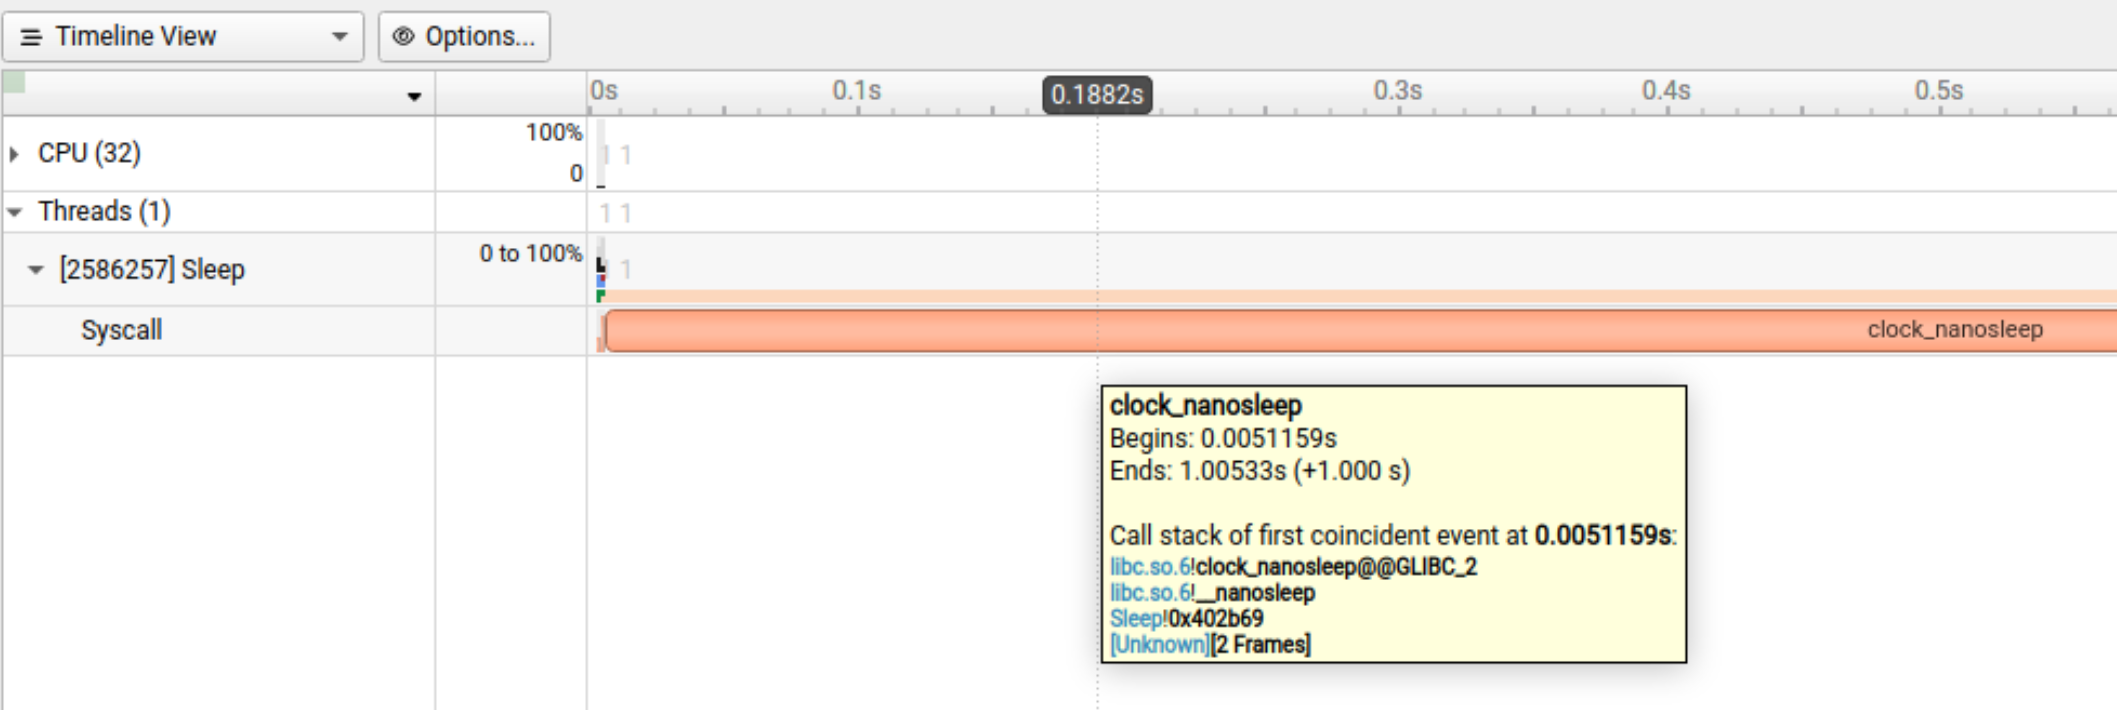
NVTX Trace#
The NVIDIA Tools Extension Library (NVTX) is a powerful mechanism that allows users to manually instrument their application. Nsight Systems can then collect the information and present it on the timeline.
NVTX is shipped as a C-based, header-only library. NVIDIA also supports and provides library-specific wrappers for C++, Python, and Rust. See the NVTX GitHub repository.
Nsight Systems supports version 3.0 of the NVTX specification.
The most commonly used features:
Domains
nvtxDomainCreate(), nvtxDomainDestroy()
nvtxDomainRegisterString()
Push-pop ranges (nested ranges that start and end in the same thread).
nvtxRangePush(), nvtxRangePushEx()
nvtxRangePop()
nvtxDomainRangePushEx()
nvtxDomainRangePop()
Start-end ranges (ranges that are global to the process and are not restricted to a single thread)
nvtxRangeStart(), nvtxRangeStartEx()
nvtxRangeEnd()
nvtxDomainRangeStartEx()
nvtxDomainRangeEnd()
Marks
nvtxMark(), nvtxMarkEx()
nvtxDomainMarkEx()
Thread names
nvtxNameOsThread()
Categories
nvtxNameCategory()
nvtxDomainNameCategory()
To learn more about specific features of NVTX, please refer to the NVTX header
file: nvToolsExt.h or the NVTX documentation.
Note
It is strongly recommended that you use registered strings for your range names. This enables profiling tools to use a more performant match algorithm. For more information about creating registered strings, see NVTX String Registration.
To use NVTX in your application, follow these steps:
Add
#include "nvtx3/nvToolsExt.h"in your source code. The nvtx3 directory is located in the Nsight Systems package in theTarget-<architecture>/nvtx/includedirectory and is available via github at NVIDIA/NVTX.Add the following compiler flag:
-ldlAdd calls to the NVTX API functions. For example, try adding
nvtxRangePush("main")in the beginning of themain()function, andnvtxRangePop()just before the return statement in the end.For convenience in C++ code, consider adding a wrapper that implements RAII (resource acquisition is initialization) pattern, which would guarantee that every range gets closed.
In the project settings, select the Collect NVTX trace checkbox.
In addition, by enabling the “Insert NVTX Marker hotkey” option it is possible to add NVTX markers to a running non-console applications by pressing the F11 key. These will appear in the report under the NVTX Domain named “HotKey markers.”
Typically, calls to NVTX functions can be left in the source code even if the application is not being built for profiling purposes, since the overhead is very low when the profiler is not attached.
NVTX is not intended to annotate very small pieces of code that are being called very frequently. A good rule of thumb to use: if code being annotated usually takes less than 1 microsecond to execute, adding an NVTX range around this code should be done carefully.
Note
Range annotations should be matched carefully. If many ranges are opened but not closed, Nsight Systems has no meaningful way to visualize it. A rule of thumb is to not have more than a couple dozen ranges open at any point in time. Nsight Systems does not support reports with many unclosed ranges.
Sample with C++ Wrapper
The following example uses the NVTX C++ wrapper to create a range around
some_function() and a nested range for each loop iteration.
#include <nvtx3/nvtx3.hpp>
#include <thread>
#include <chrono>

void some_function()
{
    NVTX3_FUNC_RANGE();  // Range around the whole function

    for (int i = 0; i < 6; ++i) {
        nvtx3::scoped_range loop{"loop range"};  // Range for iteration

        // Make each iteration last for one second
        std::this_thread::sleep_for(std::chrono::seconds{1});
    }
}
A complete program that calls some_function() does not require linking to
an NVTX library. Compile the program as usual.
g++ -o example example.cpp
Run the executable with nsys to collect and view the data.
nsys profile ./example
nsys-ui report1.nsys-rep
The NVTX C++ header is available in the <target-platform-folder>/nvtx/include
directory of the Nsight Systems installation.
export NSYS_NVTX_PATH=<nsys_install_dir>/<target-platform-folder>/nvtx
g++ -o example example.cpp -I${NSYS_NVTX_PATH}/include
Using the NVTX C API, the following example creates the same function and loop ranges.
#include <nvtx3/nvToolsExt.h>
#include <thread>
#include <chrono>

void some_function()
{
    nvtxRangePush(__func__);

    for (int i = 0; i < 6; ++i) {
        nvtxRangePush("loop range");

        std::this_thread::sleep_for(std::chrono::seconds{1});

        nvtxRangePop();
    }

    nvtxRangePop();
}

The NVTX row shows the function’s name “some_function” in the top-level range and the “loop range” message in the nested ranges. The loop iterations each last for the expected one second.
If the function returns or throws before calling nvtxRangePop, the range is
left unclosed and tool behavior is undefined. The C++ API is safer because the
range object ends the range from its destructor.
NVTX Payloads and Counters
NVTX Extended Payloads and NVTX Counters increase the flexibility of NVTX annotations by allowing users to pass arbitrary structured data to NVTX events. This then will allow users to define the layout of this data in the Nsight Systems UI without additional data conversion.
For more information, see NVTX documentation.
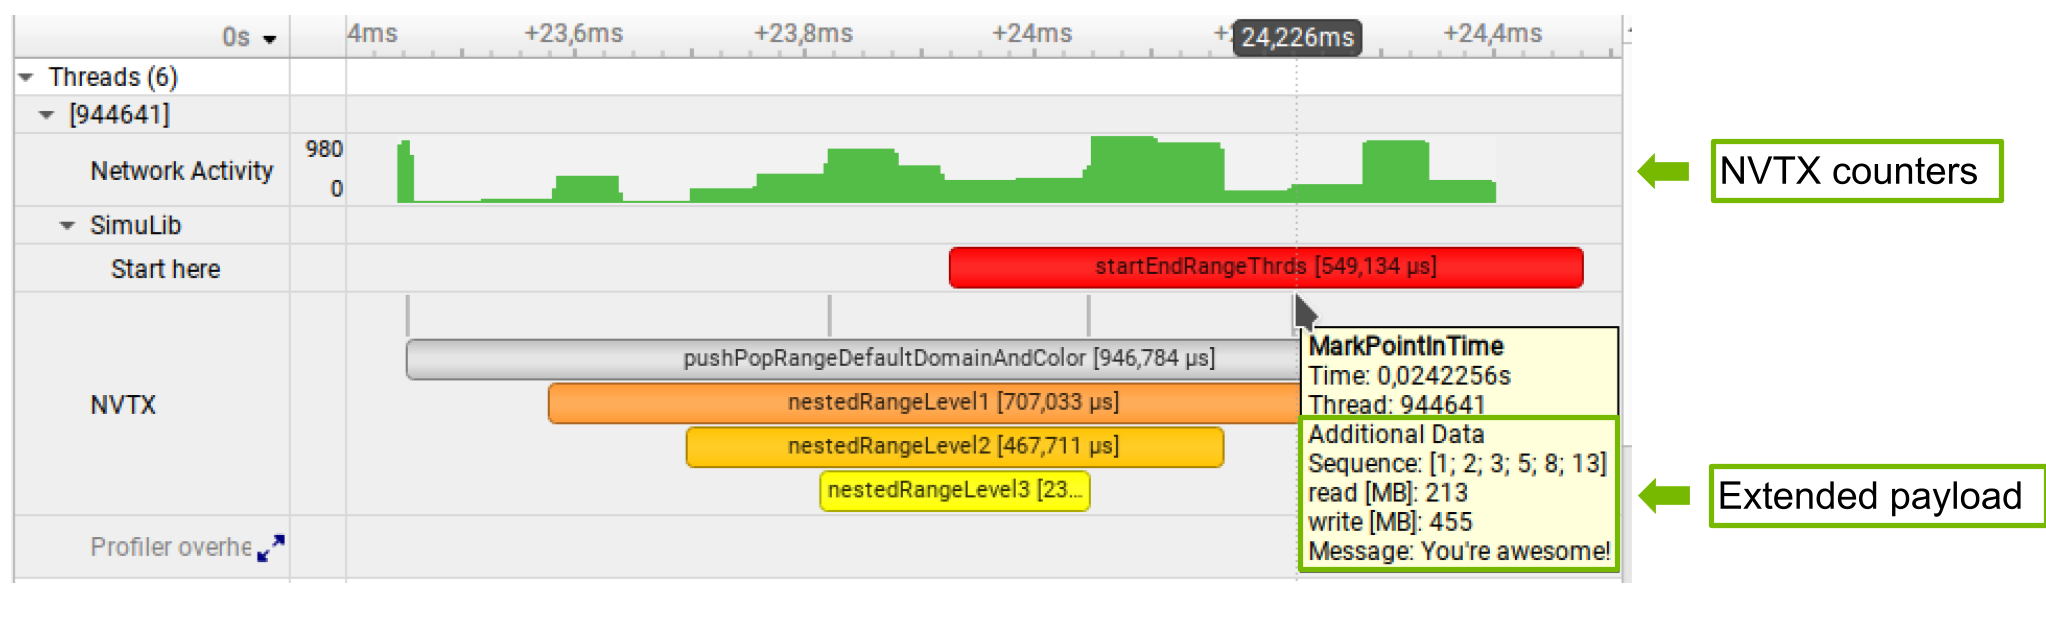
NVTX Domains and Categories
NVTX domains enable scoping of annotations. Unless specified differently, all events and annotations are in the default domain. Additionally, categories can be used to group events.
Nsight Systems gives the user the ability to include or exclude NVTX events from a particular domain. This can be especially useful if you are profiling across multiple libraries and are only interested in nvtx events from some of them.
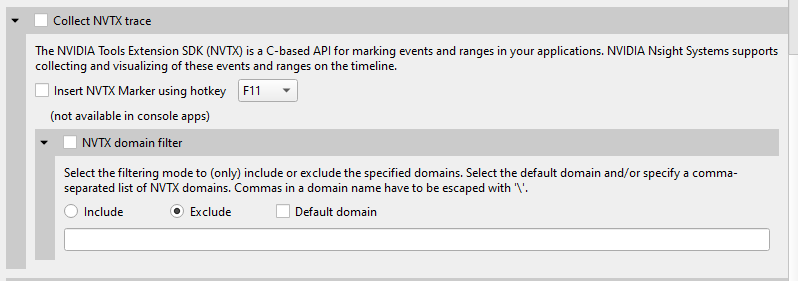
This functionality is also available from the CLI. See the CLI documentation
for --nvtx-domain-include and --nvtx-domain-exclude for more details.
Categories that are set in by the user will be recognized and displayed in the GUI.

OpenACC Trace#
Nsight Systems for Linux x86_64 is capable of capturing information about OpenACC execution in the profiled process.
OpenACC versions 2.0, 2.5, and 2.6 are supported when using PGI runtime version 15.7 or later. In order to differentiate constructs (see tooltip below), a PGI runtime of 16.0 or later is required. Note that Nsight Systems does not support the GCC implementation of OpenACC at this time.
Under the CPU rows in the timeline tree, each thread that uses OpenACC will show OpenACC trace information. You can click on an OpenACC API call to see correlation with the underlying CUDA API calls (highlighted in teal):
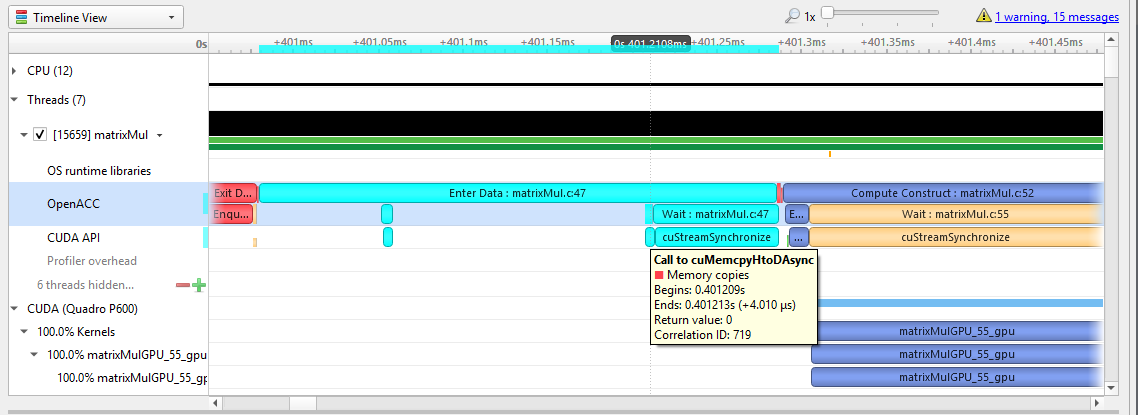
If the OpenACC API results in GPU work, that will also be highlighted:
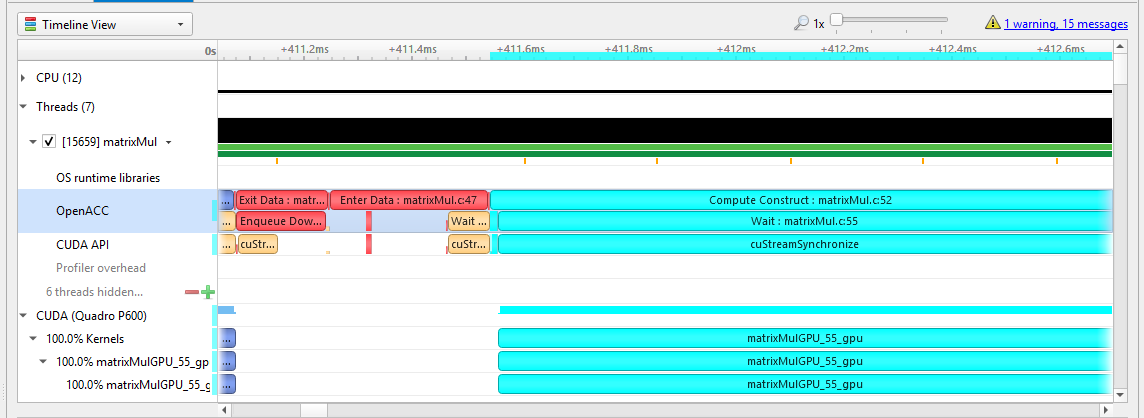
Hovering over a particular OpenACC construct will bring up a tooltip with details about that construct:
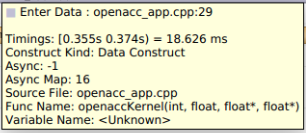
To capture OpenACC information from the Nsight Systems GUI, select the Collect OpenACC trace checkbox under Collect CUDA trace configurations. Note that turning on OpenACC tracing will also turn on CUDA tracing.
Note
If your application crashes before all collected OpenACC trace data has been copied out, some or all data might be lost and not present in the report.
OpenGL Trace#
OpenGL and OpenGL ES APIs can be traced to assist in the analysis of CPU and GPU interactions.
A few usage examples are:
Visualize how long
eglSwapBuffers(or similar) is taking.API trace can easily show correlations between thread state and graphics driver’s behavior, uncovering where the CPU may be waiting on the GPU.
Spot bubbles of opportunity on the GPU, where more GPU workload could be created.
Use
KHR_debugextension to trace GL events on both the CPU and GPU.
OpenGL trace feature in Nsight Systems consists of two different activities which will be shown in the CPU rows for those threads
CPU trace: interception of API calls that an application does to APIs (such as OpenGL, OpenGL ES, EGL, GLX, WGL, etc.).
GPU trace (or workload trace): trace of GPU workload (activity) triggered by use of OpenGL or OpenGL ES. Since draw calls are executed back-to-back, the GPU workload trace ranges include many OpenGL draw calls and operations in order to optimize performance overhead, rather than tracing each individual operation.
To collect GPU trace, the glQueryCounter() function is used to measure how much time batches of GPU workload take to complete.
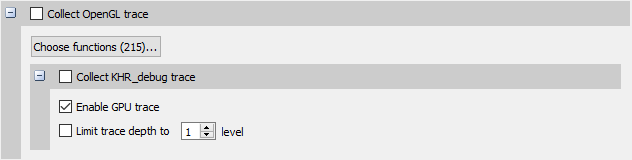
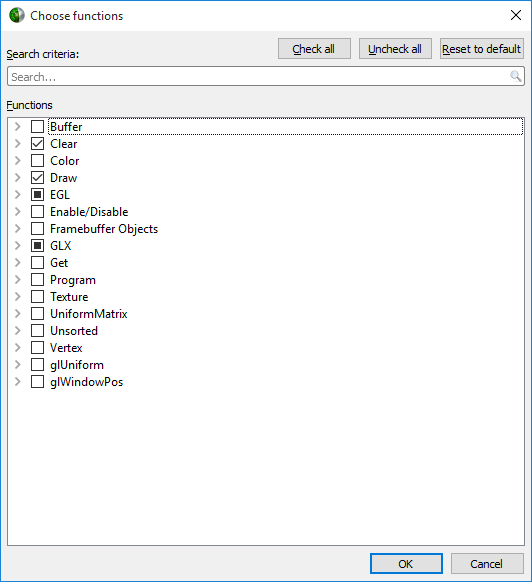
Ranges defined by the KHR_debug calls are represented similarly to OpenGL API and OpenGL GPU workload trace. GPU ranges in this case represent incremental draw cost. They cannot fully account for GPUs that can execute multiple draw calls in parallel. In this case, Nsight Systems will not show overlapping GPU ranges.
OpenGL Trace Using Command Line#
For general information on using the target CLI, see CLI Profiling on Linux. For the CLI, the functions that are traced are set to the following list:
glWaitSync
glReadPixels
glReadnPixelsKHR
glReadnPixelsEXT
glReadnPixelsARB
glReadnPixels
glFlush
glFinishFenceNV
glFinish
glClientWaitSync
glClearTexSubImage
glClearTexImage
glClearStencil
glClearNamedFramebufferuiv
glClearNamedFramebufferiv
glClearNamedFramebufferfv
glClearNamedFramebufferfi
glClearNamedBufferSubDataEXT
glClearNamedBufferSubData
glClearNamedBufferDataEXT
glClearNamedBufferData
glClearIndex
glClearDepthx
glClearDepthf
glClearDepthdNV
glClearDepth
glClearColorx
glClearColorIuiEXT
glClearColorIiEXT
glClearColor
glClearBufferuiv
glClearBufferSubData
glClearBufferiv
glClearBufferfv
glClearBufferfi
glClearBufferData
glClearAccum
glClear
glDispatchComputeIndirect
glDispatchComputeGroupSizeARB
glDispatchCompute
glComputeStreamNV
glNamedFramebufferDrawBuffers
glNamedFramebufferDrawBuffer
glMultiDrawElementsIndirectEXT
glMultiDrawElementsIndirectCountARB
glMultiDrawElementsIndirectBindlessNV
glMultiDrawElementsIndirectBindlessCountNV
glMultiDrawElementsIndirectAMD
glMultiDrawElementsIndirect
glMultiDrawElementsEXT
glMultiDrawElementsBaseVertex
glMultiDrawElements
glMultiDrawArraysIndirectEXT
glMultiDrawArraysIndirectCountARB
glMultiDrawArraysIndirectBindlessNV
glMultiDrawArraysIndirectBindlessCountNV
glMultiDrawArraysIndirectAMD
glMultiDrawArraysIndirect
glMultiDrawArraysEXT
glMultiDrawArrays
glListDrawCommandsStatesClientNV
glFramebufferDrawBuffersEXT
glFramebufferDrawBufferEXT
glDrawTransformFeedbackStreamInstanced
glDrawTransformFeedbackStream
glDrawTransformFeedbackNV
glDrawTransformFeedbackInstancedEXT
glDrawTransformFeedbackInstanced
glDrawTransformFeedbackEXT
glDrawTransformFeedback
glDrawTexxvOES
glDrawTexxOES
glDrawTextureNV
glDrawTexsvOES
glDrawTexsOES
glDrawTexivOES
glDrawTexiOES
glDrawTexfvOES
glDrawTexfOES
glDrawRangeElementsEXT
glDrawRangeElementsBaseVertexOES
glDrawRangeElementsBaseVertexEXT
glDrawRangeElementsBaseVertex
glDrawRangeElements
glDrawPixels
glDrawElementsInstancedNV
glDrawElementsInstancedEXT
glDrawElementsInstancedBaseVertexOES
glDrawElementsInstancedBaseVertexEXT
glDrawElementsInstancedBaseVertexBaseInstanceEXT
glDrawElementsInstancedBaseVertexBaseInstance
glDrawElementsInstancedBaseVertex
glDrawElementsInstancedBaseInstanceEXT
glDrawElementsInstancedBaseInstance
glDrawElementsInstancedARB
glDrawElementsInstanced
glDrawElementsIndirect
glDrawElementsBaseVertexOES
glDrawElementsBaseVertexEXT
glDrawElementsBaseVertex
glDrawElements
glDrawCommandsStatesNV
glDrawCommandsStatesAddressNV
glDrawCommandsNV
glDrawCommandsAddressNV
glDrawBuffersNV
glDrawBuffersATI
glDrawBuffersARB
glDrawBuffers
glDrawBuffer
glDrawArraysInstancedNV
glDrawArraysInstancedEXT
glDrawArraysInstancedBaseInstanceEXT
glDrawArraysInstancedBaseInstance
glDrawArraysInstancedARB
glDrawArraysInstanced
glDrawArraysIndirect
glDrawArraysEXT
glDrawArrays
eglSwapBuffersWithDamageKHR
eglSwapBuffers
glXSwapBuffers
glXQueryDrawable
glXGetCurrentReadDrawable
glXGetCurrentDrawable
glGetQueryObjectuivEXT
glGetQueryObjectuivARB
glGetQueryObjectuiv
glGetQueryObjectivARB
glGetQueryObjectiv
OpenXR API Trace#
OpenXR is a royalty-free, open standard that provides high-performance access to Augmented Reality (AR) and Virtual Reality (VR)—collectively known as XR—platforms and devices. Information about OpenXR can be found at the OpenXR Overview.
Nsight Systems can capture information about OpenXR usage by the profiled process. This includes capturing the execution time of OpenXR API functions, debug labels, and frame durations. OpenXR profiling is supported on Windows operating systems.
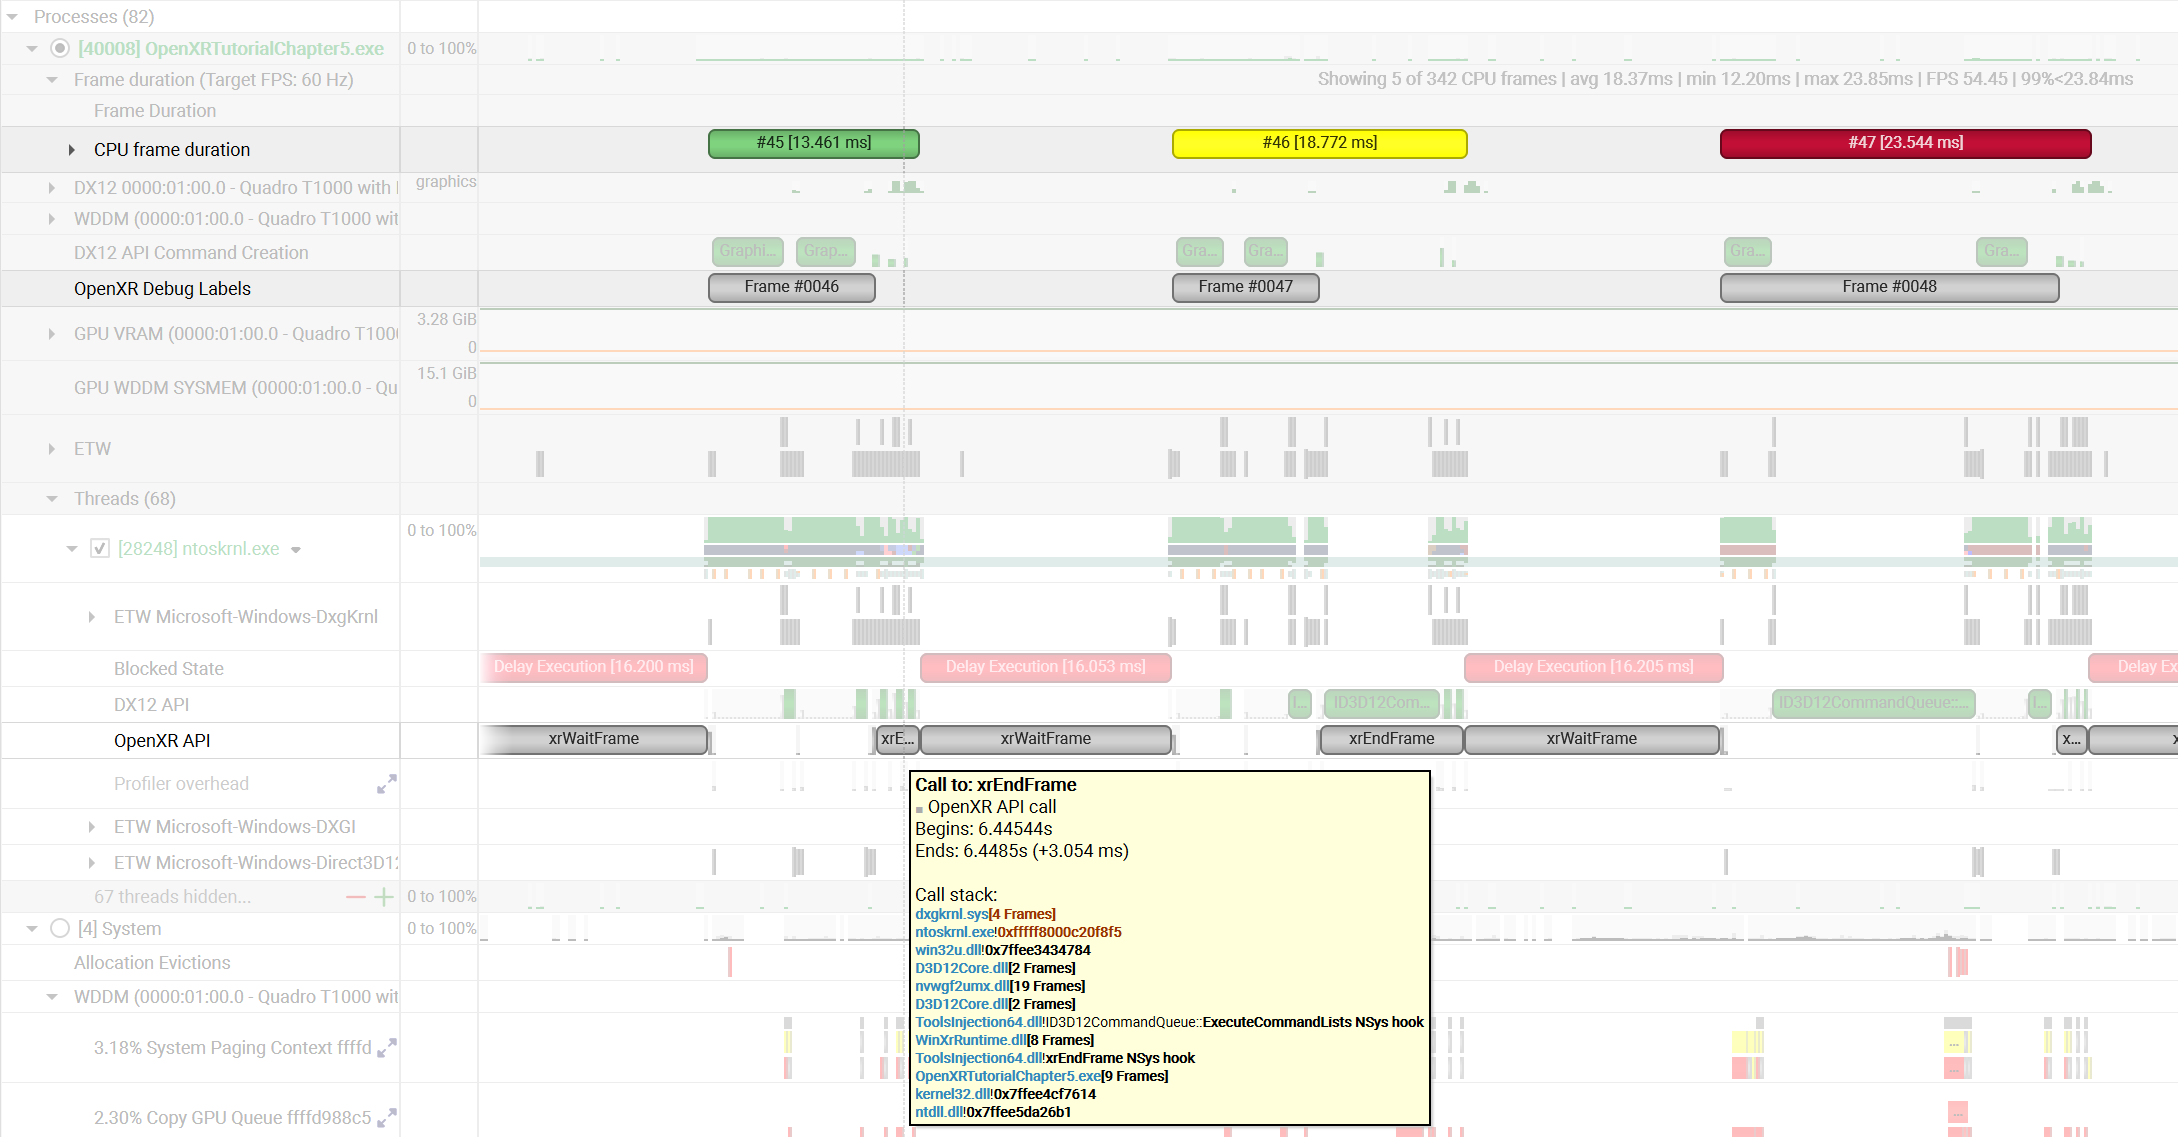
GPU Hardware Profiling#
GPU Context Switch#
Nsight Systems provides the ability to trace GPU context switches.
To enable trace, run from the CLI using the --gpuctxsw option
From the GUI:

Specifically, the behavior is as follows:
When collecting GPU context switch data as root, you will get records about contexts from all processes. The records have valid context IDs and process IDs, and have full-precision timestamps.
When collecting GPU context switch data as a normal user, you will still get records about contexts from all processes. For processes running as your user, the records have valid context ID and process IDs, and full-precision timestamps. For processes running as a different user, the records have context ID = 0 and process ID = 0, and reduced-precision timestamps (which are still guaranteed to be in the correct order).
When collecting GPU context switch data in a virtual machine using vGPU, the above rules apply to records relating to your VM. No records are collected for contexts running on other VMs, so the timeline may show gaps when the vGPU is switched to another VM’s context(s). We do not currently support collecting GPU context switch data on a host system where vGPUs are in use by VMs.
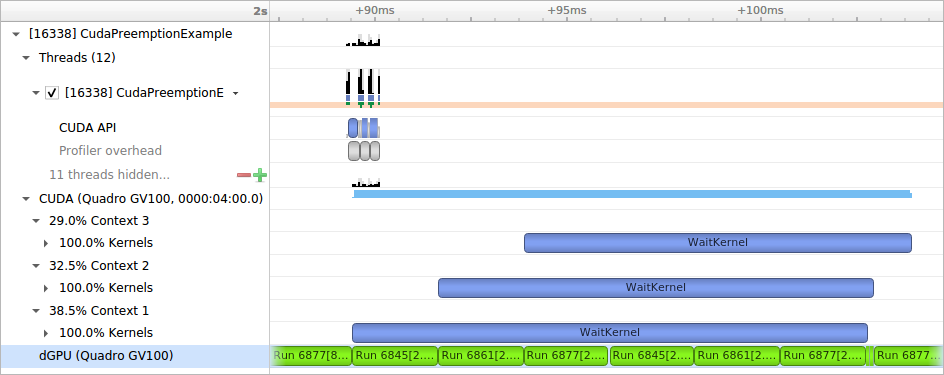
GPU Metrics#
Overview#
GPU Metrics feature is intended to identify performance limiters in applications using GPU for computations and graphics. It uses periodic sampling to gather performance metrics and detailed timing statistics associated with different GPU hardware units taking advantage of specialized hardware to capture this data in a single pass with minimal overhead.
Note
GPU Metrics will give you precise device level information, but it does not know which process or context is involved. GPU context switch trace provides less precise information, but will give you process and context information.
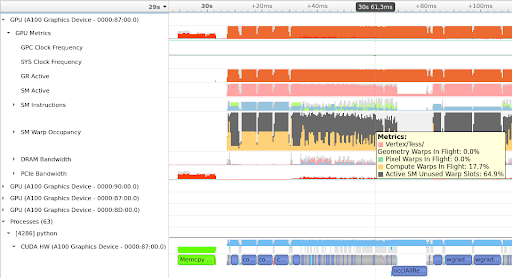
These metrics provide an overview of GPU efficiency over time within compute, graphics, and input/output (IO) activities such as:
IO throughputs: PCIe, NVLink, and GPU memory bandwidth
SM utilization: SMs activity, tensor core activity, instructions issued, warp occupancy, and unassigned warp slots
It is designed to help users answer the common questions:
Is my GPU idle?
Is my GPU full? Enough kernel grids size and streams? Are my SMs and warp slots full?
Am I using TensorCores?
Is my instruction rate high?
Am I possibly blocked on IO, or number of warps, etc.?
Nsight Systems GPU Metrics is only available for Linux targets on x86-64 and aarch64, and for Windows targets. It requires NVIDIA Turing architecture or newer.
Minimum required driver versions:
NVIDIA Turing architecture TU10x, TU11x - r440
NVIDIA Ampere architecture GA100 - r450
NVIDIA Ampere architecture GA100 MIG - r470 TRD1
NVIDIA Ampere architecture GA10x - r455
Note
Permissions: Elevated permissions are required. On Linux use sudo to elevate privileges. On Windows the user must run from an admin command prompt or accept the UAC escalation dialog. See Permissions Issues and Performance Counters for more information.
Note
Tensor Core: If you run nsys profile --gpu-metrics-devices all, the
Tensor Core utilization can be found in the GUI under the
SM instructions/Tensor Active row.
Note that it is not practical to expect a CUDA kernel to reach 100% Tensor Core utilization since there are other overheads. In general, the more computation-intensive an operation is, the higher Tensor Core utilization rate the CUDA kernel can achieve.
Launching GPU Metrics from the CLI#
GPU Metrics feature is controlled with 3 CLI switches:
--gpu-metrics-devices=[all, cuda-visible, none, <index>]selects GPUs to sample (default is none).--gpu-metrics-set=[<alias>, file:<file name>]selects metric set to use (default is the 1st suitable from the list).--gpu-metrics-frequency=[10..200000]selects sampling frequency in Hz (default is 10000).
To profile with default options and sample GPU Metrics on GPU 1:
# Must have elevated permissions (see https://developer.nvidia.com/ERR_NVGPUCTRPERM) or be root (Linux) or Administrator (Windows)
$ nsys profile --gpu-metrics-devices=1 ./my-app
To list available GPUs, use:
$ nsys profile --gpu-metrics-devices=help
Possible --gpu-metrics-devices values are:
    1: Turing TU104 | GeForce RTX 2070 SUPER PCI[0000:65:00.0]
    all: Select all supported GPUs
    cuda-visible: Select GPUs that match CUDA_VISIBLE_DEVICES
    none: Disable GPU Metrics [Default]
Some GPUs are not supported:
    0: Volta GV100 | Quadro GV100 PCI[0000:17:00.0]
See the user guide: https://docs.nvidia.com/nsight-systems/UserGuide/index.html#gpu-metrics
By default, the first metric set which supports all selected GPUs is used. You can manually select another metric set from the list. To see metrics sets available for the selected GPUs, use:
$ nsys profile --gpu-metrics-devices=all --gpu-metrics-set=help
Possible --gpu-metrics-set values are:
    tu10x        : General Metrics for NVIDIA TU10x (any frequency)
    tu10x-gfxt   : Graphics Throughput Metrics for NVIDIA TU10x (frequency >= 10kHz)
    file:<file name> : use metric set from a given file
By default, sampling frequency is set to 10 kHz. But you can manually set it from 10 Hz to 200 kHz using the following:
--gpu-metrics-frequency=<value>
Launching GPU Metrics from the GUI#
For commands to launch GPU Metrics from the CLI with examples, see Profiling from the CLI.
When launching analysis in Nsight Systems, select Collect GPU Metrics.
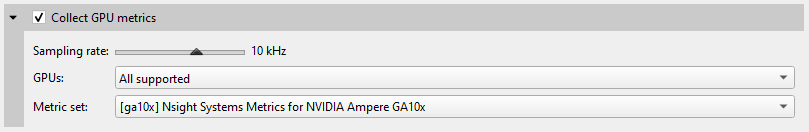
Select the GPUs dropdown to pick which GPUs you wish to sample.
Select the Metric set: dropdown to choose which available metric set you would like to sample.
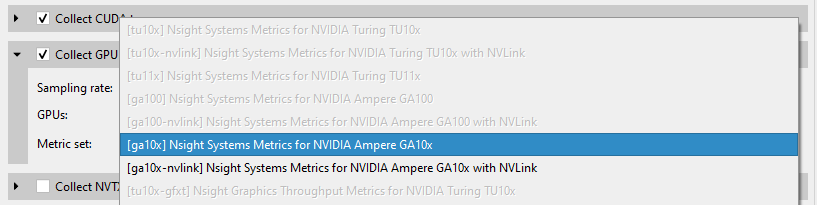
Note
Metric sets for GPUs that are not being sampled will be greyed out.
Sampling frequency#
Sampling frequency can be selected from the range of 10 Hz - 200 kHz. The default value is 10 kHz.
The maximum sampling frequency without buffer overflow events depends on GPU (SM count), GPU load intensity, and overall system load. The bigger the chip and the higher the load, the lower the maximum frequency. If you need higher frequency, you can increase it until you get “Buffer overflow” message in the Diagnostics Summary report page.
Each metric set has a recommended sampling frequency range in its description.
These ranges are approximate. If you observe Inconsistent Data or
Missing Data ranges on timeline, please try closer to the recommended
frequency.
Available metrics#
GPC Clock Frequency -
gpc__cycles_elapsed.avg.per_secondThe average GPC clock frequency in hertz. In public documentation the GPC clock may be called the “Application” clock, “Graphic” clock, “Base” clock, or “Boost” clock.
Note
The collection mechanism for GPC can result in a small fluctuation between samples.
SYS Clock Frequency -
sys__cycles_elapsed.avg.per_secondThe average SYS clock frequency in hertz. The GPU front end (command processor), copy engines, and the performance monitor run at the SYS clock. On Turing and NVIDIA GA100 GPUs, the sampling frequency is based upon a period of SYS clocks (not time) so samples per second will vary with SYS clock. On NVIDIA GA10x GPUs, the sampling frequency is based upon a fixed frequency clock. The maximum frequency scales linearly with the SYS clock.
GR Active -
gr__cycles_active.sum.pct_of_peak_sustained_elapsedThe percentage of cycles the graphics/compute engine is active. The graphics/compute engine is active if there is any work in the graphics pipe or if the compute pipe is processing work.
GA100 MIG - MIG is not yet supported. This counter will report the activity of the primary GR engine.
Sync Compute In Flight -
gr__dispatch_cycles_active_queue_sync.avg.pct_of_peak_sustained_elapsedThe percentage of cycles with synchronous compute in flight.
CUDA: CUDA will only report synchronous queue in the case of MPS configured with 64 sub-context. Synchronous refers to work submitted in VEID=0.
Graphics: This will be true if any compute work submitted from the direct queue is in flight.
Async Compute in Flight -
gr__dispatch_cycles_active_queue_async.avg.pct_of_peak_sustained_elapsedThe percentage of cycles with asynchronous compute in flight.
CUDA: CUDA will only report all compute work as asynchronous. The one exception is if MPS is configured and all 64 sub-context are in use. 1 sub-context (VEID=0) will report as synchronous.
Graphics: This will be true if any compute work submitted from a compute queue is in flight.
Draw Started -
fe__draw_count.avg.pct_of_peak_sustained_elapsedThe ratio of draw calls issued to the graphics pipe to the maximum sustained rate of the graphics pipe.
Note
The percentage will always be very low as the front end can issue draw calls significantly faster than the pipe can execute the draw call. The rendering of this row will be changed to help indicate when draw calls are being issued.
Dispatch Started -
gr__dispatch_count.avg.pct_of_peak_sustained_elapsedThe ratio of compute grid launches (dispatches) to the compute pipe to the maximum sustained rate of the compute pipe.
Note
The percentage will always be very low as the front end can issue grid launches significantly faster than the pipe can execute the draw call. The rendering of this row will be changed to help indicate when grid launches are being issued.
Vertex/Tess/Geometry Warps in Flight -
tpc__warps_active_shader_vtg_realtime.avg.pct_of_peak_sustained_elapsedThe ratio of active vertex, geometry, tessellation, and meshlet shader warps resident on the SMs to the maximum number of warps per SM as a percentage.
Pixel Warps in Flight -
tpc__warps_active_shader_ps_realtime.avg.pct_of_peak_sustained_elapsedThe ratio of active pixel/fragment shader warps resident on the SMs to the maximum number of warps per SM as a percentage.
Compute Warps in Flight -
tpc__warps_active_shader_cs_realtime.avg.pct_of_peak_sustained_elapsedThe ratio of active compute shader warps resident on the SMs to the maximum number of warps per SM as a percentage.
Active SM Unused Warp Slots -
tpc__warps_inactive_sm_active_realtime.avg.pct_of_peak_sustained_elapsedThe ratio of inactive warp slots on the SMs to the maximum number of warps per SM as a percentage. This is an indication of how many more warps may fit on the SMs if occupancy is not limited by a resource such as max warps of a shader type, shared memory, registers per thread, or thread blocks per SM.
Idle SM Unused Warp Slots -
tpc__warps_inactive_sm_idle_realtime.avg.pct_of_peak_sustained_elapsedThe ratio of inactive warps slots due to idle SMs to the the maximum number of warps per SM as a percentage.
This is an indicator that the current workload on the SM is not sufficient to put work on all SMs. This can be due to:
CPU starving the GPU.
Current work is too small to saturate the GPU.
Current work is trailing off but blocking next work.
SMs Active -
sm__cycles_active.avg.pct_of_peak_sustained_elapsedThe ratio of cycles SMs had at least 1 warp in flight (allocated on SM) to the number of cycles as a percentage. A value of 0 indicates all SMs were idle (no warps in flight). A value of 50% can indicate some gradient between all SMs active 50% of the sample period or 50% of SMs active 100% of the sample period.
SM Issue -
sm__inst_executed_realtime.avg.pct_of_peak_sustained_elapsedThe ratio of cycles that SM sub-partitions (warp schedulers) issued an instruction to the number of cycles in the sample period as a percentage.
Tensor Active -
sm__pipe_tensor_cycles_active_realtime.avg.pct_of_peak_sustained_elapsedThe ratio of cycles the SM tensor pipes were active issuing tensor instructions to the number of cycles in the sample period as a percentage.
TU102/4/6: This metric is not available on TU10x for periodic sampling. Please see Tensor Active/FP16 Active.
Tensor Active / FP16 Active -
sm__pipe_shared_cycles_active_realtime.avg.pct_of_peak_sustained_elapsedTU102/4/6 only.
The ratio of cycles the SM tensor pipes or FP16x2 pipes were active issuing tensor instructions to the number of cycles in the sample period as a percentage.
DRAM Read Bandwidth -
dramc__read_throughput.avg.pct_of_peak_sustained_elapsed,dram__read_throughput.avg.pct_of_peak_sustained_elapsedVRAM Read Bandwidth -
FBPA.TriageA.dramc__read_throughput.avg.pct_of_peak_sustained_elapsed,FBSP.TriageSCG.dramc__read_throughput.avg.pct_of_peak_sustained_elapsed,FBSP.TriageAC.dramc__read_throughput.avg.pct_of_peak_sustained_elapsedThe ratio of cycles the DRAM interface was active reading data to the elapsed cycles in the same period as a percentage.
DRAM Write Bandwidth -
dramc__write_throughput.avg.pct_of_peak_sustained_elapsed,dram__write_throughput.avg.pct_of_peak_sustained_elapsedVRAM Write Bandwidth -
FBPA.TriageA.dramc__write_throughput.avg.pct_of_peak_sustained_elapsed,FBSP.TriageSCG.dramc__write_throughput.avg.pct_of_peak_sustained_elapsed,FBSP.TriageAC.dramc__write_throughput.avg.pct_of_peak_sustained_elapsedThe ratio of cycles the DRAM interface was active writing data to the elapsed cycles in the same period as a percentage.
- NVENC Active
NVENC.TriageTop.nvenc__cycles_active.avg.pct_of_peak_sustained_elapsed
The ratio of cycles the NVENC unit was actively processing a command to the number of cycles in the same sample period as a percentage.
- NVENC Read Throughput
NVENC.TriageTop.nvenc__memif2nvenc_read_throughput.avg.pct_of_peak_sustained_elapsed- NVENC Write Throughput
NVENC.TriageTop.nvenc__nvenc2memif_write_throughput.avg.pct_of_peak_sustained_elapsed
The ratio of cycles the NVENC unit was actively processing read/write operations to the number of cycles in the same sample period as a percentage.
- OFA Active
OFA.TriageTop.ofa_cycles_active.avg.pct_of_peak_sustained_elapsed
The ratio of cycles the OFA (Optical Flow Accelerator) was actively processing a command to the number of cycles in the same sample period as a percentage.
- OFA Read Throughput
OFA.TriageTop.ofa__memif2ofa_read_throughput.avg.pct_of_peak_sustained_elapsed- OFA Write Throughput
OFA.TriageTop.ofa__ofa2memif_write_throughput.avg.pct_of_peak_sustained_elapsed
The ratio of cycles the OFA (Optical Flow Accelerator) was actively processing read/write operations to the number of cycles in the same sample period as a percentage.
NVLink bytes received -
nvlrx__bytes.avg.pct_of_peak_sustained_elapsedThe ratio of bytes received on the NVLink interface to the maximum number of bytes receivable in the sample period as a percentage. This value includes protocol overhead.
NVLink bytes transmitted -
nvltx__bytes.avg.pct_of_peak_sustained_elapsedThe ratio of bytes transmitted on the NVLink interface to the maximum number of bytes transmittable in the sample period as a percentage. This value includes protocol overhead.
PCIe Read Throughput -
pcie__read_bytes.avg.pct_of_peak_sustained_elapsedThe ratio of bytes received on the PCIe interface to the maximum number of bytes receivable in the sample period as a percentage. The theoretical value is calculated based upon the PCIe generation and number of lanes. This value includes protocol overhead.
PCIe Write Throughput -
pcie__write_bytes.avg.pct_of_peak_sustained_elapsedThe ratio of bytes transmitted on the PCIe interface to the maximum number of bytes receivable in the sample period as a percentage. The theoretical value is calculated based upon the PCIe generation and number of lanes. This value includes protocol overhead.
PCIe Read Requests to BAR1 -
pcie__rx_requests_aperture_bar1_op_read.sumPCIe Write Requests to BAR1 -
pcie__rx_requests_aperture_bar1_op_write.sumBAR1 is a PCI Express (PCIe) interface used to allow the CPU or other devices to directly access GPU memory. The GPU normally transfers memory with its copy engines, which would not show up as BAR1 activity. The GPU drivers on the CPU do a small amount of BAR1 accesses, but heavier traffic is typically coming from other technologies.
On Linux, technologies like GPU Direct, GPU Direct RDMA, and GPU Direct Storage transfer data across PCIe BAR1. In the case of GPU Direct RDMA, that would be an Ethernet or InfiniBand adapter directly writing to GPU memory.
On Windows, Direct3D12 resources can also be made accessible directly to the CPU via NVAPI functions to support small writes or reads from GPU buffers, in this case too many BAR1 accesses can indicate a performance issue, like it has been demonstrated in the Optimizing DX12 Resource Uploads to the GPU Using CPU-Visible VRAM technical blog post.
Exporting and Querying Data#
It is possible to access metric values for automated processing using the Nsight Systems CLI export capabilities.
An example that extracts values of SMs Active:
$ nsys export -t sqlite report.nsys-rep
$ sqlite3 report.sqlite "SELECT timestamp, value FROM GPU_METRICS
   JOIN TARGET_INFO_GPU_METRICS USING (metricId) WHERE value != 0
   AND metricName LIKE \"SMs Active%\" LIMIT 10;"

309277039|80
309301295|99
309325583|99
309349776|99
309373872|60
309397872|19
309421840|100
309446000|100
309470096|100
309494161|99
Values are integer percentages (0..100).
Limitations#
If metric sets with NVLink are used but the links are not active, they may appear as fully utilized.
Only one tool that subscribes to these counters can be used at a time, therefore, Nsight Systems GPU Metrics feature cannot be used at the same time as the following tools:
Nsight Graphics
Nsight Compute
DCGM (Data Center GPU Manager)
Use the following command:
dcgmi profile --pausedcgmi profile --resume
Or API:
dcgmProfPausedcgmProfResume
Non-NVIDIA products which use:
CUPTI sampling used directly in the application. CUPTI trace is okay (although it will block Nsight Systems CUDA trace)
DCGM library
Nsight Systems limits the amount of memory that can be used to store GPU Metrics samples. Analysis with higher sampling rates or on GPUs with more SMs has a risk of exceeding this limit. This will lead to gaps on timeline filled with
Missing Dataranges. Future releases will reduce the frequency of this happening.
NVML power and temperature metrics#
Nsight Systems can now periodically sample power and temperature metrics from GPUs and plot them on
the timeline in the GUI.
These metrics are provided by the NVML API calls nvmlDeviceGetPowerUsage and
nvmlDeviceGetTemperature respectively. The power metrics are provided in milliwatts (mW) and
the temperature in degrees Celcius (C).
To enable the power and temperature sampling add the following option to the nsys
profile or start commands:
--enable nvml_metrics[,arg1[=value1],arg2[=value2], ...]
There are no spaces following nvml_metrics plugin name. It is followed by a
comma separated list of arguments or argument=value pairs. Arguments with spaces
should be enclosed in double quotes.
Supported arguments are:
Short name |
Long name |
Possible Parameters |
Default |
Switch Description |
|---|---|---|---|---|
|
|
integer |
100 |
Sampling interval in milliseconds |
|
|
Print help message |
||
|
|
all, cuda-visible, comma-separated GPU IDs list |
cuda-visible |
Set the GPUs to be sampled. cuda-visible will sample the GPUs set with CUDA_VISIBLE_DEVICES. An empty CUDA_VISIBLE_DEVICES will result in all GPUs being sampled. all and a GPU IDs list will precede CUDA_VISIBLE_DEVICES. |
Usage Examples
nsys profile --enable nvml_metrics ...Sample power and temperature on all available GPUs every 100ms.
nsys profile --enable nvml_metrics,-i10Sample power and temperature on all available GPUs every 10ms.
For general information on Nsight Systems plugins please refer to Nsight Systems Plugins system.
DCGM#
NVIDIA Data Center GPU Manager (DCGM) is a suite of tools for managing and monitoring NVIDIA Datacenter GPUs in cluster environments. It includes active health monitoring, comprehensive diagnostics, system alerts, and governance policies including power and clock management. Infrastructure teams can use it standalone and in addition easily integrate it into cluster management tools, resource scheduling, and monitoring products from NVIDIA partners. For more information, see DCGM Documentation
Nsight Systems can now directly access metrics from DCGM and integrate them with other data collected, displaying on the timeline or making available for further analysis.
Supported arguments are:
Option |
Available Parameters (default in bold) |
Switch Description |
|---|---|---|
|
all, help, dcgm:<ID> dcgm:<ID1-ID2> |
Indicate which CPU(s) you are interested in or all. If you want to build a combination of CPUs, you can
build a comma-separated combo like |
|
all, cuda-visible, help, dcgm:<ID>, dcgm:<ID1-ID2> |
Indicate which GPUs you are interested in, or all. If you want to build a combination of GPUs, you can
build a comma-separated combo like |
|
host:port |
Address of the DCGM hostengine (host:port) or UDS path. When not specified, the plugin connects to localhost:5555 and falls back to embedded DCGM if that connection fails. |
|
comma-separated list of metric names or help |
Give the list of DCGM metrics that you would like to collect, help will give the list of available metrics for your platform. If no metrics are selected, the tool will collect summary data for the CPUs, GPUs, and nvswitches on the system. See default metric options below. |
|
all, help, dcgm:<ID> dcgm:<ID1-ID2> |
Indicate which NIC(s) you are interested in or all. If you want to build a combination of NICs, you can
build a comma-separated combo like |
|
all, help, dcgm:<ID> dcgm:<ID1-ID2> |
Indicate which nvswitch(es) you are interested in or all. If you want to build a combination of
nvswitch(es), you can build a comma-separated combo like |
|
milliseconds |
Sampling period in milliseconds. Minimum allowed value is 100ms. |
Note
Unlike in most Nsight Systems collectors, the output from this command will not be sent to the standard CLI output, but rather to the output location for DCGM.
Example 1 - Specifying Metrics
nsys profile --enable=dcgm,--metrics=gpu_temp,power_usage_instant,sm_active,
   cpu_power_utilization,cpu_temp,--cpu=dcgm:0,--gpu=dcgm:0,--sampling-period=100
   appname
Screenshot:
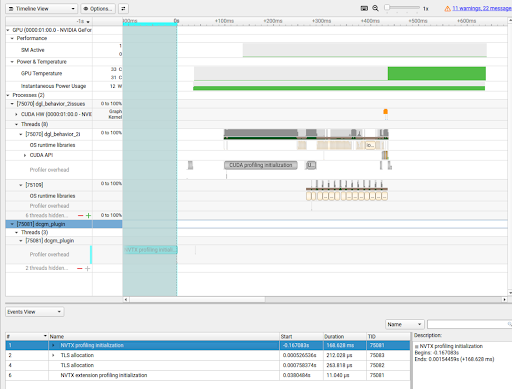
Example 2 - Using Presets
The s- prefix selects preset metric groups defined in counter_groups.yaml;
available presets are gpu, gpu-perf, cpu, nvswitch, and
power_smoothing (for example, s-gpu-perf or s-nvswitch).
nsys profile --enable=dcgm,--metrics=s-gpu-perf,s-nvswitch
   ./nccl-tests/build/alltoall_perf -g 8 -n 100 -b 1M -e 32G -f 2
Screenshot:
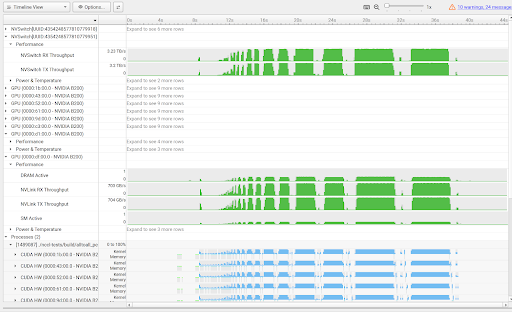
For general information on Nsight Systems plugins please refer to Nsight Systems Plugins.
SoC Metrics#
Overview#
SoC Metrics feature is intended to identify performance limiters in applications running on NVIDIA SoCs and is similar to GPU Metrics.
Nsight Systems SoC Metrics is only available for Linux and QNX targets on aarch64. It requires NVIDIA Orin architecture or newer.
Available metrics#
- CPU Read Throughput
mcc__dram_throughput_srcnode_cpu_op_read.avg.pct_of_peak_sustained_elapsed- CPU Write Throughput
mcc__dram_throughput_srcnode_cpu_op_write.avg.pct_of_peak_sustained_elapsed
The ratio of cycles the SoC memory controllers were actively processing read/write operations from the CPU to the number of cycles in the same sample period as a percentage.
- GPU Read Throughput
mcc__dram_throughput_srcnode_gpu_op_read.avg.pct_of_peak_sustained_elapsed- GPU Write Throughput
mcc__dram_throughput_srcnode_gpu_op_write.avg.pct_of_peak_sustained_elapsed
The ratio of cycles the SoC memory controllers were actively processing read/write operations from the GPU to the number of cycles in the same sample period as a percentage.
- DBB Read Throughput
mcc__dram_throughput_srcnode_dbb_op_read.avg.pct_of_peak_sustained_elapsed- DBB Write Throughput
mcc__dram_throughput_srcnode_dbb_op_write.avg.pct_of_peak_sustained_elapsed
The ratio of cycles the SoC memory controllers were actively processing read/write operations from not-CPU/not-GPU to the number of cycles in the same sample period as a percentage.
- DRAM Read Throughput
mcc__dram_throughput_op_read.avg.pct_of_peak_sustained_elapsed- DRAM Write Throughput
mcc__dram_throughput_op_write.avg.pct_of_peak_sustained_elapsed
The ratio of cycles the SoC memory controllers were actively processing read/write operations to the number of cycles in the same sample period as a percentage.
- DLA0/DLA1 Active
nvdla__cycles_active.avg.pct_of_peak_sustained_elapsed
The ratio of cycles the DLA (Deep Learning Accelerator) was actively processing a command to the number of cycles in the same sample period as a percentage.
- DLA0/DLA1 Read Throughput
nvdla__dbb2nvdla_read_throughput.avg.pct_of_peak_sustained_elapsed- DLA0/DLA1 Write Throughput
nvdla__nvdla2dbb_write_throughput.avg.pct_of_peak_sustained_elapsed
The ratio of cycles the DLA (Deep Learning Accelerator) was actively processing read/write operations to the number of cycles in the same sample period as a percentage.
- NVENC Active
nvenc__cycles_active.avg.pct_of_peak_sustained_elapsed
The ratio of cycles the NVENC unit was actively processing a command to the number of cycles in the same sample period as a percentage.
- NVENC Read Throughput
nvenc__memif2nvenc_read_throughput.avg.pct_of_peak_sustained_elapsed- NVENC Write Throughput
nvenc__nvenc2memif_write_throughput.avg.pct_of_peak_sustained_elapsed
The ratio of cycles the NVENC unit was actively processing read/write operations to the number of cycles in the same sample period as a percentage.
- PVA VPU Active
pvavpu__vpu_cycles_active.avg.pct_of_peak_sustained_elapsed
The ratio of cycles the PVA (Programmable Vision Accelerator) VPU (Vector Processing Unit) was actively processing a command to the number of cycles in the same sample period as a percentage.
- PVA DMA Read Throughput
pva__dbb2pvadma_read_throughput.avg.pct_of_peak_sustained_elapsed- PVA DMA Write Throughput
pva__pvadma2dbb_write_throughput.avg.pct_of_peak_sustained_elapsed
The ratio of cycles the PVA (Programmable Vision Accelerator) VPU (Vector Processing Unit) was actively processing read/write operations to the number of cycles in the same sample period as a percentage.
Note
To enable PVA trace on DRIVE 6.0.8.0, run these two commands before mounting any additional partitions:
echo 1 >/dev/nvpvadebugfs/pva0/tracingecho 2 >/dev/nvpvadebugfs/pva0/trace_level- OFA Active
ofa_cycles_active.avg.pct_of_peak_sustained_elapsed
The ratio of cycles the OFA (Optical Flow Accelerator) was actively processing a command to the number of cycles in the same sample period as a percentage.
- OFA Read Throughput
ofa__memif2ofa_read_throughput.avg.pct_of_peak_sustained_elapsed- OFA Write Throughput
ofa__ofa2memif_write_throughput.avg.pct_of_peak_sustained_elapsed
The ratio of cycles the OFA (Optical Flow Accelerator) was actively processing read/write operations to the number of cycles in the same sample period as a percentage.
- VIC Active
vic_cycles_active.avg.pct_of_peak_sustained_elapsed
The ratio of cycles the VIC (Video Image Compositor) was actively processing a command to the number of cycles in the same sample period as a percentage.
- VIC Read Throughput
vic__dbb2vic_read_throughput.avg.pct_of_peak_sustained_elapsed- VIC Write Throughput
vic__vic2dbb_write_throughput.avg.pct_of_peak_sustained_elapsed
The ratio of cycles the VIC (Video Image Compositor) was actively processing read/write operations to the number of cycles in the same sample period as a percentage.
Launching SoC Metrics from the CLI#
SoC Metrics feature is controlled with 3 CLI switches:
--soc-metrics=[true, false]enables SoC Metrics sampling (default is false)--soc-metrics-set=[<alias>, file:<file name>]selects metric set to use (default is the 1st suitable from the list)--soc-metrics-frequency=[100..200000]selects sampling frequency in Hz (default is 10000)
To profile with default options:
# Must be root or added to 'debug' group
$ nsys profile --soc-metrics=true ./my-app
Launching SoC Metrics from the GUI#
When launching analysis in Nsight Systems, select Collect SoC Metrics.
The settings are similar to GPU Metrics.
For commands to launch SoC Metrics from the CLI with examples, see the CLI documentation.
CPU Profiling on Linux#
Nsight Systems on Linux targets, utilizes the Linux OS’ perf subsystem to sample CPU Instruction Pointers (IPs) and backtraces, trace CPU context switches, and sample CPU and OS event counts. The Linux perf tool utilizes the same perf subsystem.
Nsight Systems Embedded Platforms Edition on Linux kernel prior to v5.15 uses a custom kernel module to
collect the same data. The Nsight Systems CLI command
nsys status --environment indicates when the kernel module is used instead
of the Linux OS’ perf subsystem.
Features#
CPU Instruction Pointer / Backtrace Sampling
Nsight Systems can sample CPU Instruction Pointers / backtraces periodically. The collection of a sample is triggered by a hardware event overflow - e.g., a sample is collected after every 1 million CPU reference cycles on a per thread basis. In the GUI, samples are shown on the individual thread timelines, in the Event Viewer, and in the Top Down, Bottom Up, or Flat views which provide histogram-like summaries of the data. IP / backtrace collections can be configured in process-tree or system-wide mode. In process-tree mode, Nsight Systems will sample the process, and any of its descendants, launched by the tool. In system-wide mode, Nsight Systems will sample all processes running on the system, including any processes launched by the tool.
CPU Context Switch Tracing
Nsight Systems can trace every time the OS schedules a thread on a logical CPU and every time the OS thread gets unscheduled from a logical CPU. The data is used to show CPU utilization and OS thread utilization within the Nsight Systems GUI. Context switch collections can be configured in process-tree or system-wide mode. In process-tree mode, Nsight Systems will trace the process, and any of its descendants, launched by Nsight Systems. In system-wide mode, Nsight Systems will trace all processes running on the system, including any processes launched by the Nsight Systems.
CPU Event Sampling
Nsight Systems can periodically sample CPU hardware event counts and OS event counts and show the event’s rate over time in the Nsight Systems GUI. Event sample collections can be configured in system-wide mode only. In system-wide mode, Nsight Systems will sample event counts of all CPUs and the OS event counts running on the system. Event counts are not directly associated with processes or threads.
CPU Core Metrics
Nsight Systems can access and make available information about CPU core metrics. The
--cpu-metrics=helpcommand will list available metrics. Then selected options can be fed into the--cpu-metricsswitch by name or by alias. These metrics can be used to determine how the CPU is oversubscribed. For example, see the Grace Performance Tuning Guide.In this version of Nsight Systems
--cpu-metricsis available only on Linux and only for NVIDIA Grace CPU, NVIDIA GB10 Grace Blackwell Superchip (for example, on NVIDIA DGX Spark), and NVIDIA Thor (for example, in NVIDIA Jetson AGX Thor).
System Requirements#
Paranoid Level
The system’s paranoid level must be 2 or lower.
Paranoid Level |
CPU IP/backtrace Sampling process-tree mode |
CPU IP/backtrace Sampling system-wide mode |
CPU Context Switch Tracing process-tree mode |
CPU Context Switch Tracing system-wide mode |
Event Sampling system-wide mode |
|---|---|---|---|---|---|
3 or greater |
not available |
not available |
not available |
not available |
not available |
2 |
User mode IP/backtrace samples only |
not available |
available |
not available |
not available |
1 |
Kernel and user mode IP/backtrace samples |
not available |
available |
not available |
not available |
0, -1 |
Kernel and user mode IP/backtrace samples |
Kernel and user mode IP/backtrace samples |
available |
available |
hardware and OS events |
Kernel Version
To support the CPU profiling features utilized by Nsight Systems, the kernel version must be greater than or equal to v4.3. RedHat has backported the required features to the v3.10.0-693 kernel. RedHat distros and their derivatives (e.g. CentOS) require a 3.10.0-693 or later kernel. Use the
uname -rcommand to check the kernel’s version.perf_event_open syscall
The perf_event_open syscall needs to be available. When running within a Docker container, the default seccomp settings will normally block the perf_event_open syscall. To workaround this issue, use the Docker
run --privilegedswitch when launching the docker or modify the docker’s seccomp settings. Some VMs (virtual machines), e.g. AWS, may also block the perf_event_open syscall.Sampling Trigger
In some rare case, a sampling trigger is not available. The sampling trigger is either a hardware or software event that causes a sample to be collected. Some VMs block hardware events from being accessed and therefore, prevent hardware events from being used as sampling triggers. In those cases, Nsight Systems will fall back to using a software trigger if possible.
Checking Your Target System
Use the
nsys status --environmentcommand to check if a system meets the Nsight Systems CPU profiling requirements. Example output from this command is shown below. Note that this command does not check for Linux capability overrides - i.e., if the user or executable files haveCAP_SYS_ADMINorCAP_PERFMONcapability. Also, note that this command does not indicate if system-wide mode can be used.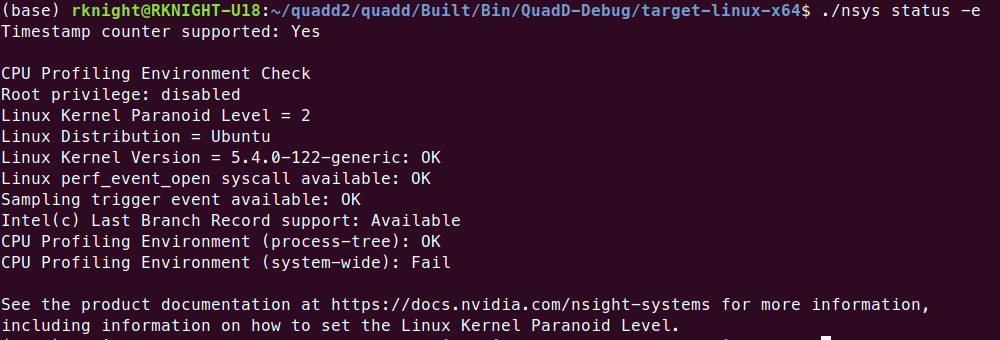
Configuring a CPU Profiling Collection#
When configuring Nsight Systems for CPU Profiling from the CLI, use some or all
of the following options: --sample, --cpuctxsw, --event-sample,
--backtrace, --cpu-core-events, --event-sampling-interval,
--os-events, --samples-per-backtrace, and --sampling-period.
Details about these options, including examples can be found at Profiling from the CLI.
When configuring from the GUI, the following options are available:
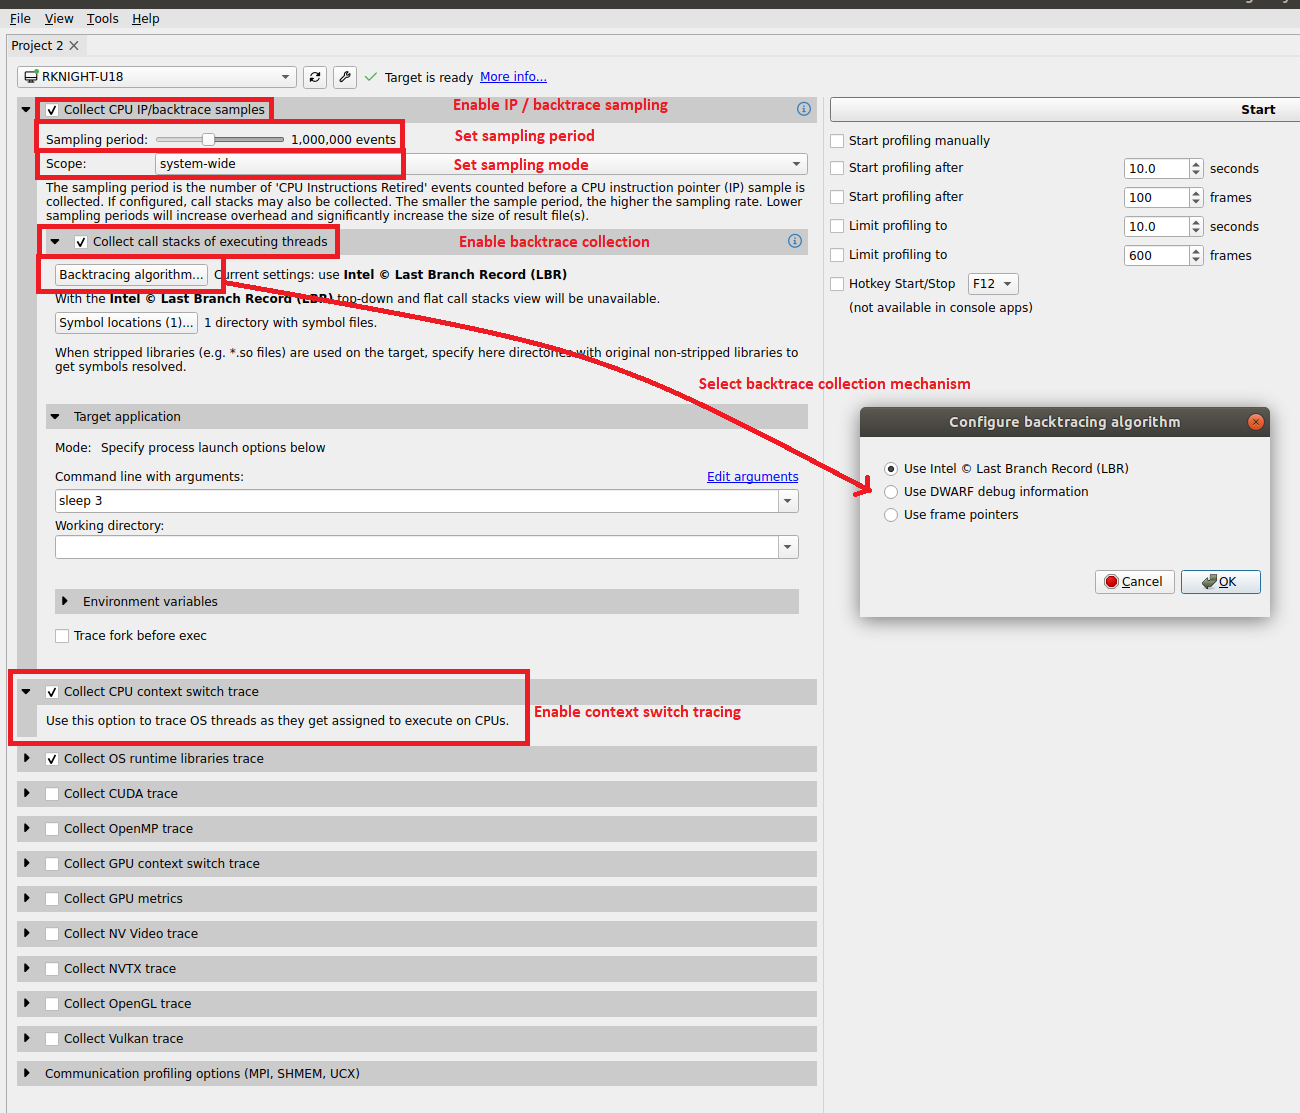
The configuration used during CPU profiling is documented in the Analysis Summary:
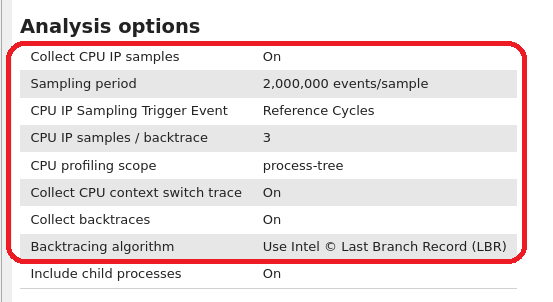
As well as in the Diagnosics Summary:
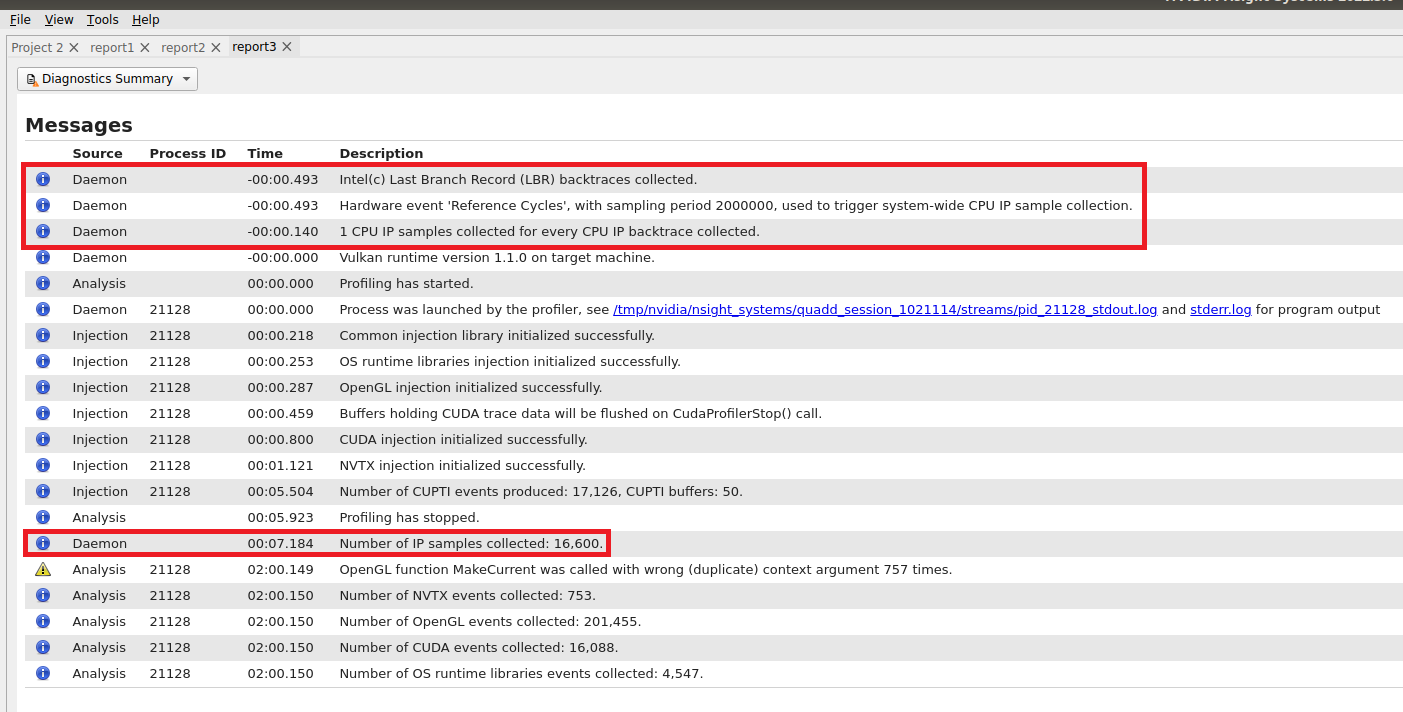
Visualizing CPU Profiling Results#
Here are example screenshots visualizing CPU profiling results. For details about navigating the Timeline View and the backtraces, see the section on Timeline View in the Reading Your Report in the GUI section of the User Guide.
Example of CPU IP/Backtrace Data
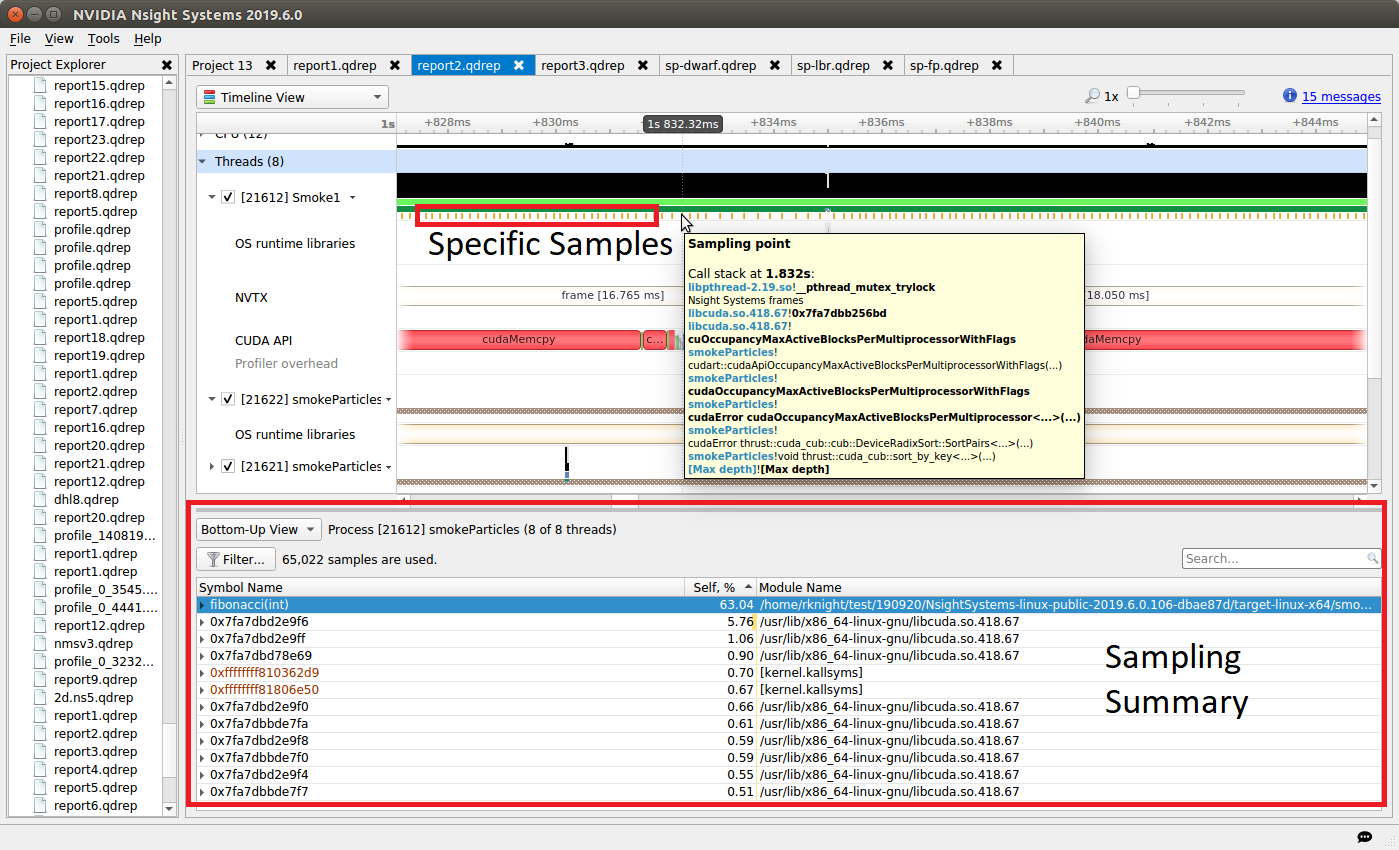
In the timeline, yellow-orange marks can be found under each thread’s timeline that indicate the moment an IP / backtrace sample was collected on that thread (e.g., see the yellow-orange marks in the Specific Samples box above). Hovering the cursor over a mark will cause a tooltip to display the backtrace for that sample.
Below the Timeline is a drop-down list with multiple options including Events View, Top-Down View, Bottom-Up View, and Flat View. All four of these views can be used to view CPU IP / back trace sampling data.
Example of Event Sampling
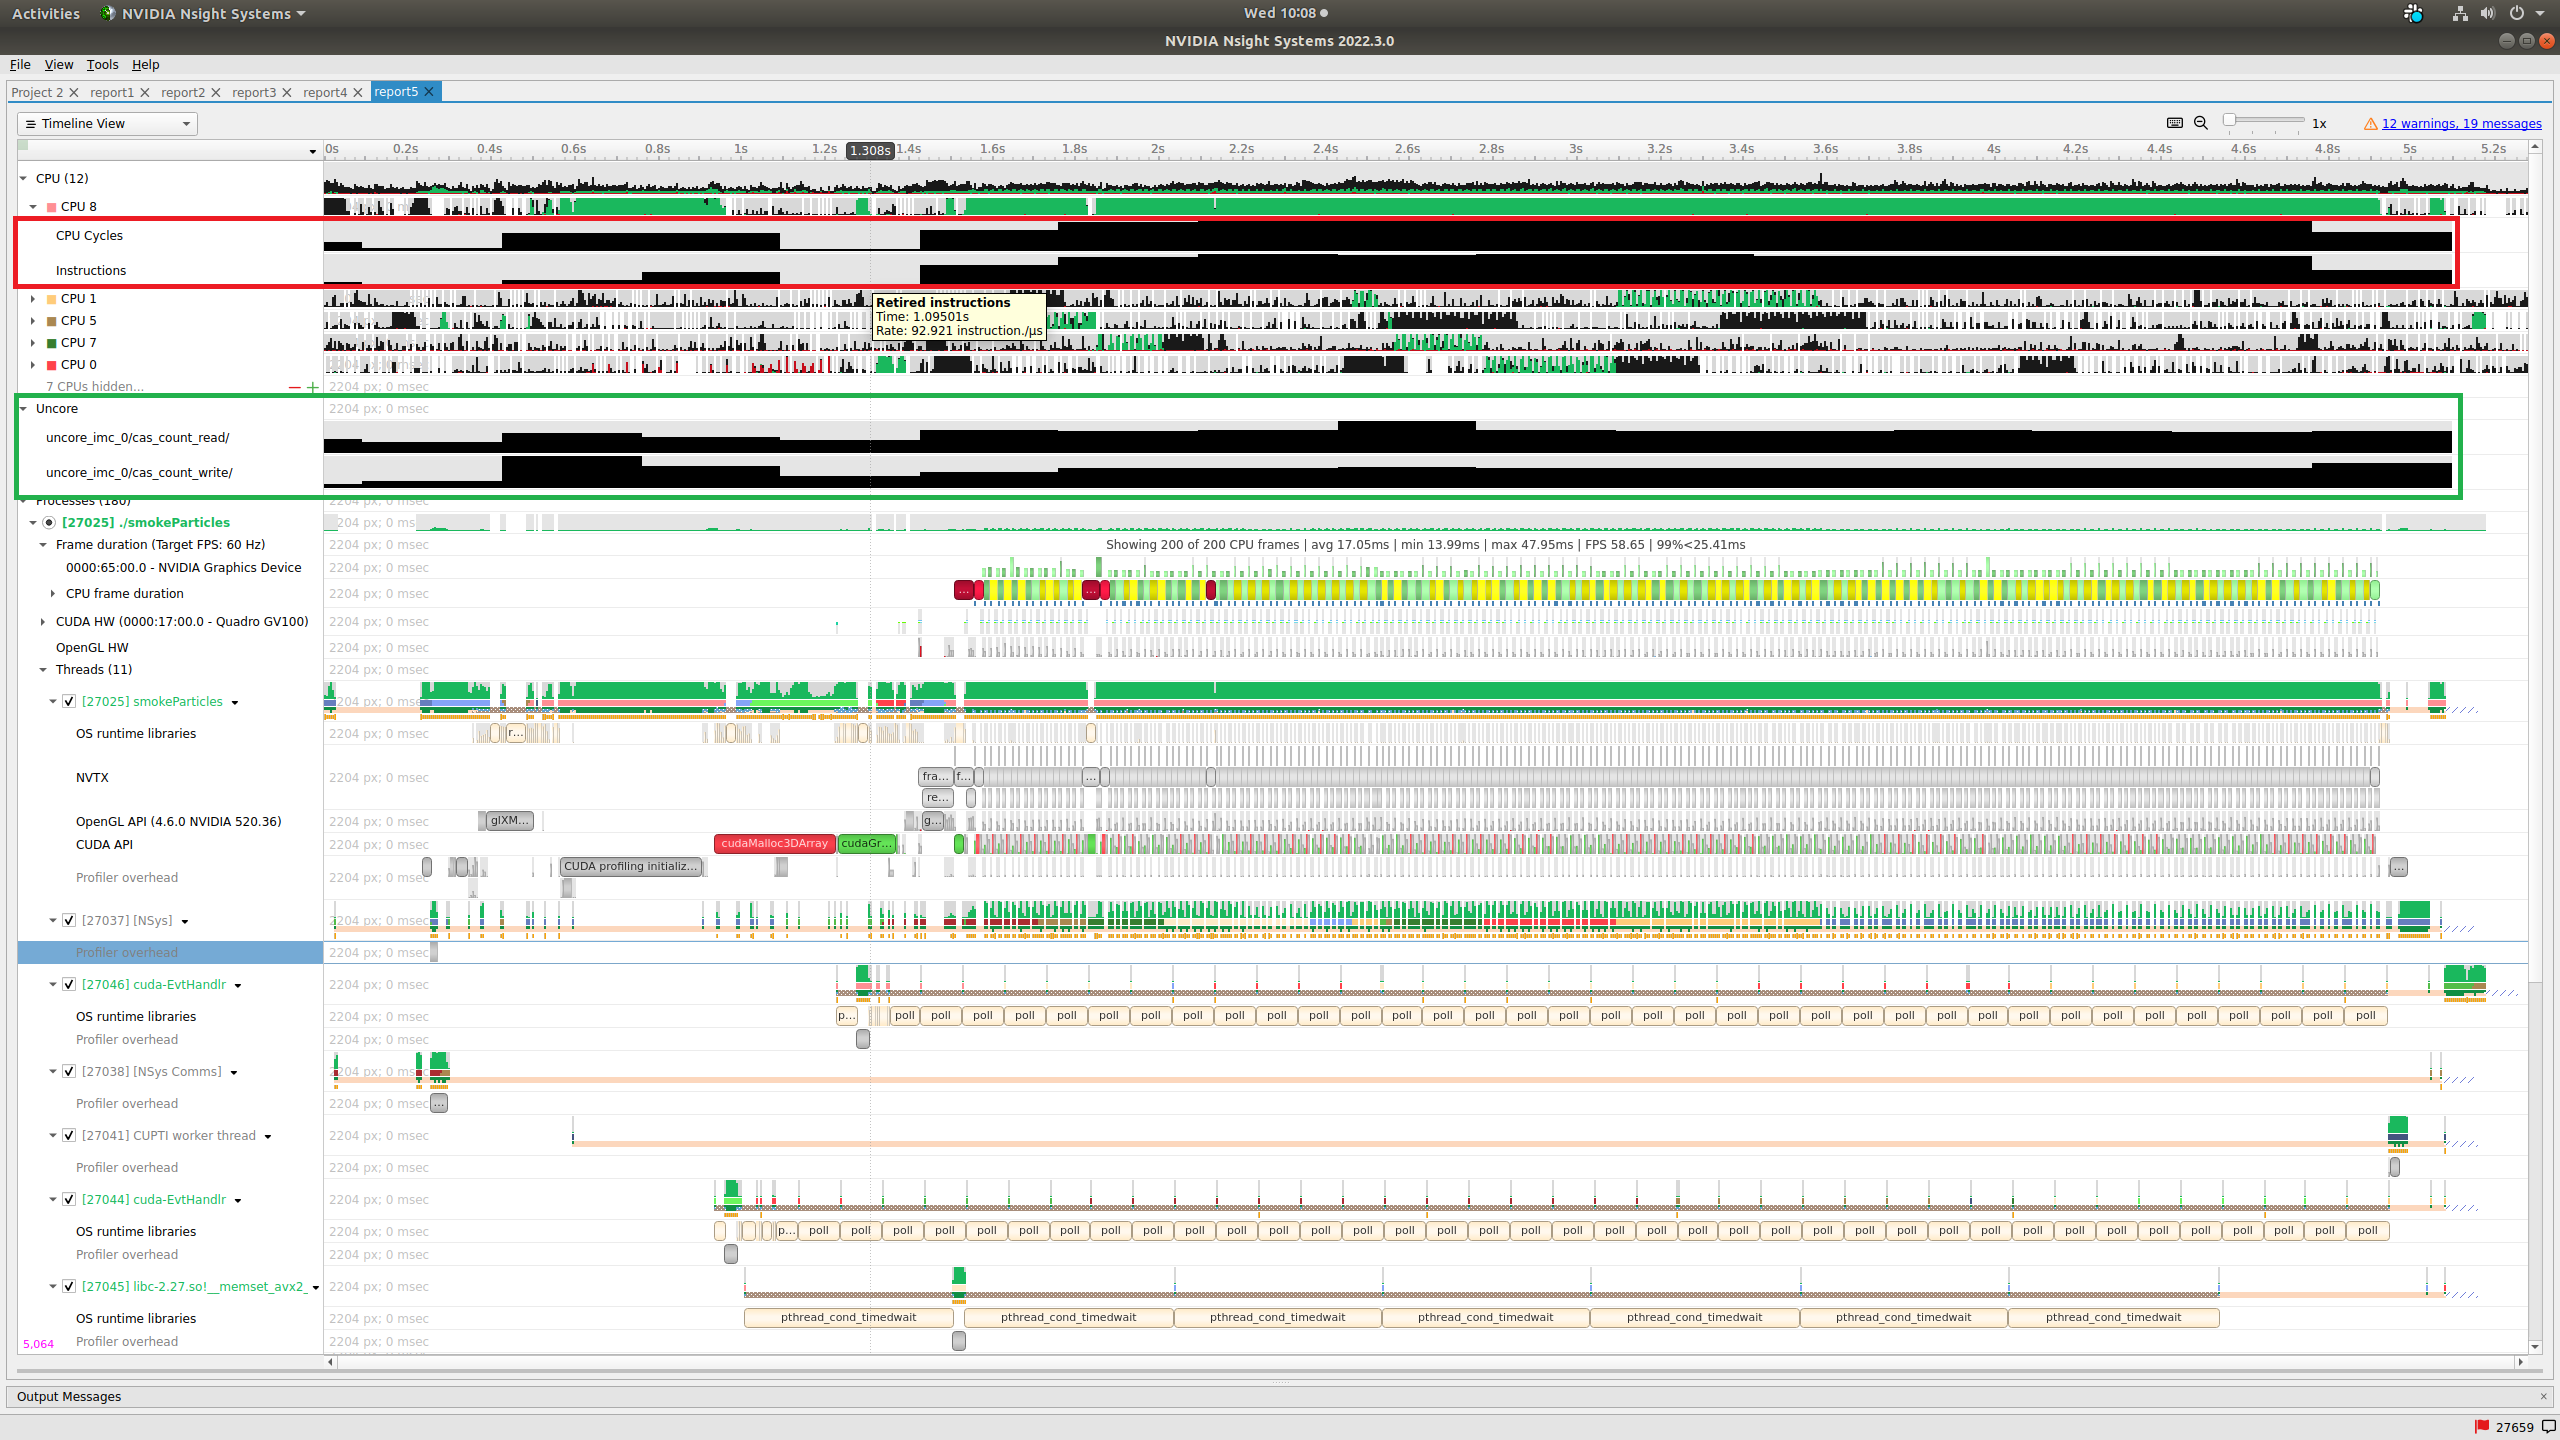
Event sampling samples hardware or software event counts during a collection and then graphs those events as rates on the Timeline. The above screenshot shows four hardware events. Core and cache events are graphed under the associated CPU row (see the red box in the screenshot) while uncore and OS events are graphed in their own row (see the green box in the screenshot). Hovering the cursor over an event sampling row in the timeline shows the event’s rate at that moment.
CPU Event Counters/Core Metrics#
Nsight Systems can access and make available information about activities on the CPU. What exact data is available varies by the CPU and by the architecture.
nsys profile/start command |
Grace CPU |
Future NVIDIA CPUs |
Intel CPUs |
AMD CPUs |
Non-NVIDIA Arm-based CPUs |
|---|---|---|---|---|---|
|
full |
n/a |
extended |
basic |
basic |
|
full |
n/a |
n/a |
n/a |
n/a |
|
full |
full |
extended |
basic |
basic |
Events Support:
basic - only standard perf_event_open architecture-independent CPU core events
extended - basic + a few common architecture-specific CPU core events
full - basic + some architecture-specific CPU core events
Metrics Support:
full - metrics derived from architecture-specific CPU core events
The --cpu-metrics=help command will list available events and metrics for
your CPU. Then selected options can be fed into the --cpu-metrics switch by
name or by alias.
Future versions of Nsight Systems will provide full event and metric support for other x86 and Arm architectures.
Event Multiplexing#
There are hardware limitations on how many CPU counters can be collected at one time. If you need to collect more counters than are available, you can either perform multiple runs (as in the Arm Topdown methodology below) or you can take advantage of Nsight Systems’s support for event multiplexing.
To multiplex events, you need to define event groups. An event group can be
defined in any of the following switches: --os-events, --cpu-core-events,
--cpu-core-metrics, --cpu-socket-events, or --cpu-socket-metrics.
One new switch is added to support this feature but is not required. It is
--event-sampling-multiplex-interval. If this switch is not set, the
default interval is 2000 ms (i.e. 2 seconds). This switch defines when event
group scheduling changes are made. The minimum
--event-sampling-multiplex-interval is 250ms.
An event group is a group of events to be sampled concurrently. Use the ‘%’ delimiter to define an event group. For example;
--cpu-core-events=1,2,3%4,5,6
In this case, Nsight Systems will sample events 1,2, and 3 for 2 seconds, then
switch the events 4,5, and 6 for 2 seconds, then switch back to events 1,2, and
3, etc. assuming the --event-sampling-multiplex-interval switch was not set.
nsys profile --os-events %3,2%% --cpu-socket-metrics 6,11%%14,15%
--cpu-core-events %%67,68%64,65,85,77,81 --event-sample system-wide
--event-sampling-interval 100 --event-sampling-multiplex-interval 500
--cpuctxsw system-wide -s none -t none -o five ../../ClockBenchmark
In this case, the following event groups were defined by the command line switches. The event groups were switched every 500ms. So, after 2 seconds, all of the events have been sampled and nsys reschedules group 0 to be sampled again.
group 0 - events used by socket-metrics 6 and 11
group 1 - os events 2 and 3
group 2 - events used by socket-metrics 14 and 15, core events 67 and 68
group 3 - core events 64,65,85,77, and 81
There is no limit to the number of event groups that can be defined. If an event group is empty, the command line will return an error. The events defined for an event group must fit in the available hardware PMUs as documented by the individual event switch help output. There is no limit on the number of concurrent os events.
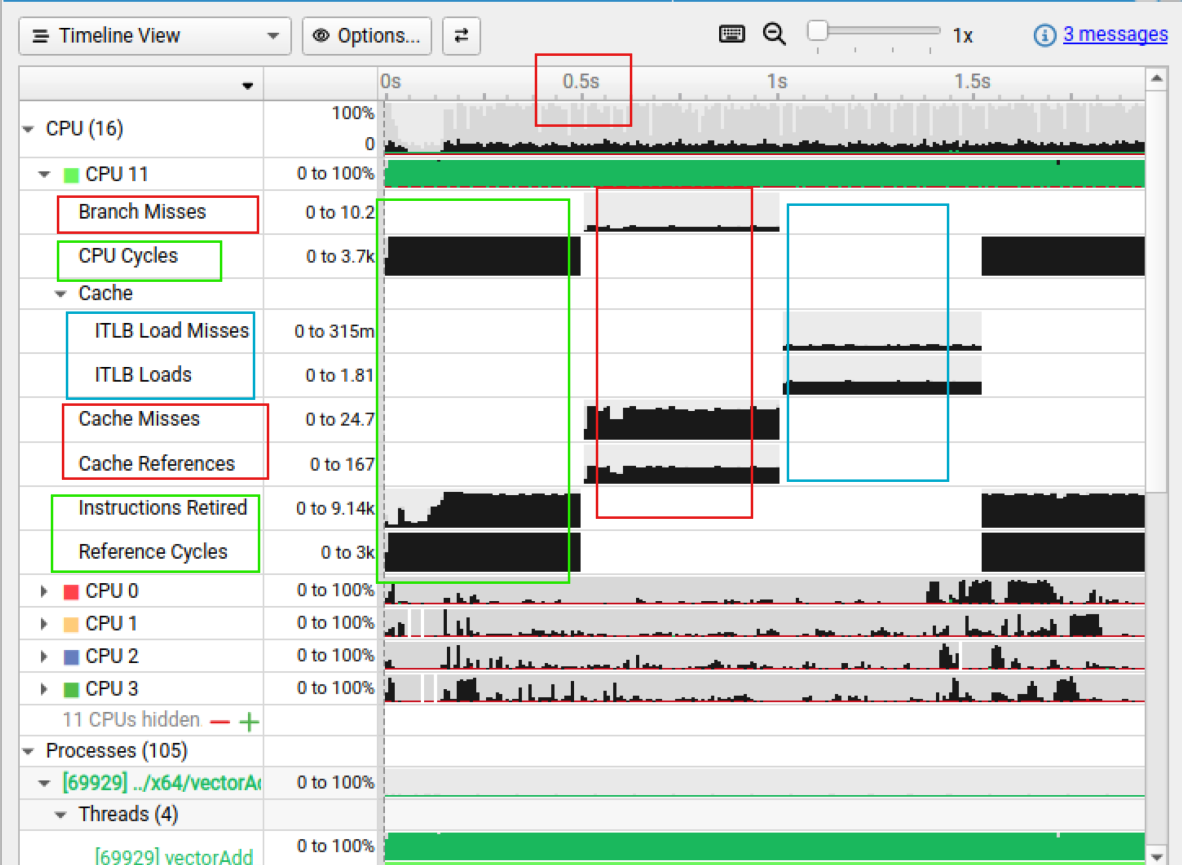
Arm Topdown Analysis#
Arm Topdown methodology supports performance analysis, workload characterization, and microarchitecture exploration. You can find details on the technique at Arm Topdown Methodology.
Nsight Systems provides scripting to support running this analysis for the Grace (TM) and DGX Spark (TM) systems.
In your target-linux-sbsa-armv8/CpuProfiling directory, look for a script named
collect_cpu_topdown.sh. This script simplifies collecting all PMU core
event and metric data needed to perform a traditional CPU Topdown analysis of
the workload’s CPU performance.
The script runs multiple system-wide nsys profile commands sequentially to
collect the data. You can add additional Nsight Systems options to the command
line as per usual, with the following exceptions:
--event-sample,--event-sampling-interval,--cpu-core-events, and--cpu-core-metricsswitches are set by the script for Topdown analysis.-f,--force-overwriteswitch is set to true by the script-o,--outputswitch is set by the script to generate a list of predefined output nsys-rep files.--killswitch is set to the default value ofsigterm
If an application is to be launched by the script, place a -- between the nsys
switches and the application command line.
Example command line:
collect_cpu_topdown.sh --trace=osrt,nvtx,cuda -- myApp arg1 arg2
Output files will be written to the current working directory. The output consists of a collection of .nsys-rep files that contain the metric data required to do a Topdown analysis of the workload. These files can be opened in the Nsight Systems GUI to view the metric results on the timeline.
You can futher use the NVTX CPU Topdown recipe
(nsys recipe nvtx_cpu_topdown --input .) that will process the data from
the .nsys-rep files and generate an output with CPU Topdown Methodology metrics
computed for NVTX ranges. For details and use cases of this recipe, see
nvtx_cpu_topdown Recipe.
Note
Arm Topdown analysis requires multiple system-wide collections and may take a significantly long time to run and post-process.
Common Issues#
Reducing Overhead Caused By Sampling
There are several ways to reduce overhead caused by sampling.
Disable sampling (i.e., use the
--sampling=noneswitch).Increase the sampling period (i.e., reduce the sampling rate) using the
--sampling-periodswitch.Stop collecting backtraces (i.e., use the
--backtrace=noneswitch) or collect more efficient backtraces - if available, use the--backtrace=lbrswitch.reduce the number of backtraces collected per sample. See documentation for the
--samples-per-backtraceswitch.
Throttling
The Linux operating system enforces a maximum time to handle sampling interrupts. This means that if collecting samples takes more than a specified amount of time, the OS will throttle (i.e., slow down) the sampling rate to prevent the perf subsystem from causing too much overhead. When this occurs, sampling data may become irregular even though the thread is very busy.
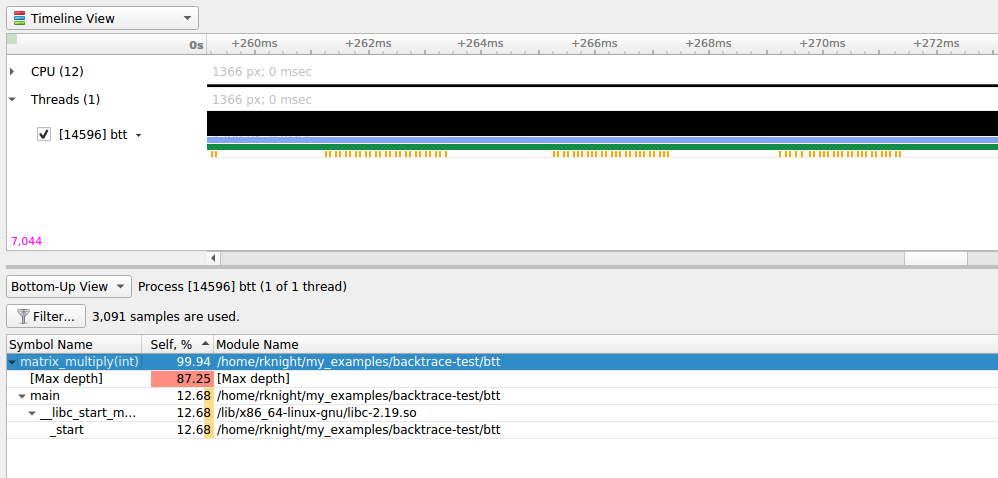
The above screenshot shows a case where CPU IP / backtrace sampling was throttled during a collection. Note the irregular intervals of sampling tickmarks on the thread timeline. The number of times a collection throttled is provided in the Nsight Systems GUI’s Diagnostics messages. If a collection throttles frequently (e.g., 1000s of times), increasing the sampling period should help reduce throttling.
Note
When throttling occurs, the OS sets a new (lower) maximum sampling rate in the procfs. This value must be reset before the sampling rate can be increased again. Use the following command to reset the OS’ max sampling rate
echo '100000' | sudo tee /proc/sys/kernel/perf_event_max_sample_rateSample intervals are irregular
My samples are not periodic - why? My samples are clumped up - why? There are gaps in between the samples - why? Likely reasons:
Throttling, as described above.
The paranoid level is set to 2. If the paranoid level is set to 2, anytime the workload makes a system call and spends time executing kernel mode code, samples will not be collected and there will be gaps in the sampling data.
The sampling trigger itself is not periodic. If the trigger event is not periodic, for example, the Instructions Retired. event, sample collection will primarily occur when cache misses are occurring.
No CPU profiling data is collected
There are a few common issues that cause CPU profiling data to not be collected:
System requirements are not met. Check your system settings with the
nsys status --environmentcommand and see the System Requirements section above.I profiled my workload in a Docker container but no sampling data was collected. By default, Docker containers prevent the perf_event_open syscall from being utilized. To override this behavior, launch the Docker with the
--privilegedswitch or modify the Docker’sseccompsettings.I profiled my workload in a Docker container running Ubuntu 20+ running on top of a host system running CentOS with a kernel version < 3.10.0-693. The
nsys status --environmentcommand indicated that CPU profiling was supported. The host OS kernel version determines if CPU profiling is allowed and a CentOS host with a version < 3.10.0-693 is too old. In this case, thensys status --environmentcommand is incorrect.
NVIDIA Video Profiling#
NVIDIA Video Hardware Profiling#
Limitations/Requirements#
NVIDIA Video Hardware profiling requires:
Linux (x86_64 or Arm) and Windows (x86_64)
Only covers desktop platforms
Driver version >= 535
GPU architecture Turing+
No NVIDIA Video Hardware profiling for:
Mobile platforms
Driver version < 535
GPU architecture < Turing
GSP is enabled and Driver < 545.31
MIG is enabled
Confidential computing is enabled
vGPU software < 18.0
To learn more about GSP and on which GPUs it’s enabled by default, see the following link.
To turn off GSP permanently:
sudo su -c 'echo options nvidia NVreg_EnableGpuFirmware=0 > /etc/modprobe.d/nvidia-gsp.conf'
sudo update-initramfs -u # for Ubuntu-based systems
Then reboot.
Alternatively if you do not wish to reboot, this will disable until the next reboot:
sudo rmmod nvidia_uvm nvidia_drm nvidia_modeset nvidia && \
sudo insmod /lib/modules/$(uname -r)/updates/dkms/nvidia.ko NVreg_EnableGpuFirmware=0
for i in $(seq 0 7); do sudo nvidia-smi -i $i -pm ENABLED; done
Running from the CLI#
The feature is enabled through the --gpu-video-devices option. It is available
from the nsys profile, nsys launch and nsys start commands.
The option behaves exactly like --gpu-metrics-device and accepts the
following arguments:
--gpu-video-devices help- List supported devices and their IDs, List unsupported devices (if any) and the reason.--gpu-video-devices none- Turn the feature off.--gpu-video-devices all- Enable the feature on all supported devices. An error is returned if no devices support the feature.--gpu-video-devices <id1,id2,...>- Enable the feature on the specified devices. The ID corresponds to whathelpreturns. An error is returned if the ID is invalid.
Example:
$ nsys profile --gpu-video-devices help
Possible --gpu-video-devices values are:
    0: NVIDIA GeForce RTX 3070 PCI[0000:65:00.0]
    all: Select all supported GPUs
    none: Disable GPU video accelerator tracing [Default]

Some GPUs don't support video accelerator tracing:
    Quadro P620 PCI[0000:04:00.0] (reason = Arch Pascal < Turing)

See the user guide: https://docs.nvidia.com/nsight-systems/UserGuide/index.html
Note that this is a system-wide feature; i.e., it doesn’t require a program to be launched.
NVIDIA Video Codec SDK Trace#
Nsight Systems for x86 Linux and Windows targets can trace calls from the NVIDIA Video Codec SDK. This software trace can be launched from the GUI or using the --trace nvvideo from the CLI
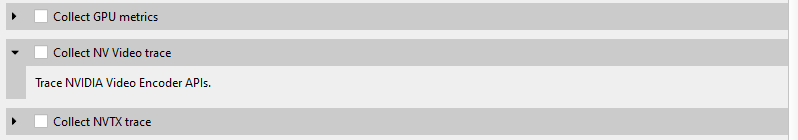
On the timeline, calls on the CPU to the NVIDIA Encoder API, NVIDIA Decoder API, and NVIDIA nvJPEG API will be shown.
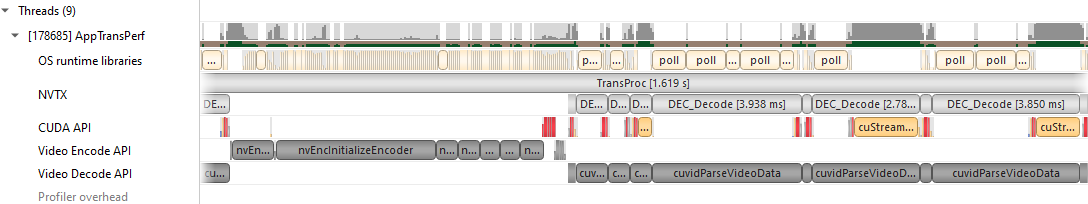
NV Encoder API Functions Traced by Default#
NvEncodeAPICreateInstance
nvEncOpenEncodeSession
nvEncGetEncodeGUIDCount
nvEncGetEncodeGUIDs
nvEncGetEncodeProfileGUIDCount
nvEncGetEncodeProfileGUIDs
nvEncGetInputFormatCount
nvEncGetInputFormats
nvEncGetEncodeCaps
nvEncGetEncodePresetCount
nvEncGetEncodePresetGUIDs
nvEncGetEncodePresetConfig
nvEncGetEncodePresetConfigEx
nvEncInitializeEncoder
nvEncCreateInputBuffer
nvEncDestroyInputBuffer
nvEncCreateBitstreamBuffer
nvEncDestroyBitstreamBuffer
nvEncEncodePicture
nvEncLockBitstream
nvEncUnlockBitstream
nvEncLockInputBuffer
nvEncUnlockInputBuffer
nvEncGetEncodeStats
nvEndGetSequenceParams
nvEncRegisterAsyncEvent
nvEncUnregisterAsyncEvent
nvEncMapInputResource
nvEncUnmapInputResource
nvEncDestroyEncoder
nvEncInvalidateRefFrames
nvEncOpenEncodeSessionEx
nvEncRegisterResource
nvEncUnregisterResource
nvEncReconfigureEncoder
nvEncCreateMVBuffer
nvEncDestroyMVBuffer
nvEncRunMotionEstimationOnly
nvEncGetLastErrorString
nvEncSetIOCudaStreams
nvEncGetSequenceParamEx
NV Decoder API Functions Traced by Default#
cuvidCreateVideoSource
cuvidCreateVideoSourceW
cuvidDestroyVideoSource
cuvidSetVideoSourceState
cudaVideoState
cuvidGetSourceVideoFormat
cuvidGetSourceAudioFormat
cuvidCreateVideoParser
cuvidParseVideoData
cuvidDestroyVideoParser
cuvidCreateDecoder
cuvidDestroyDecoder
cuvidDecodePicture
cuvidGetDecodeStatus
cuvidReconfigureDecoder
cuvidMapVideoFrame
cuvidUnmapVideoFrame
cuvidMapVideoFrame64
cuvidUnmapVideoFrame64
cuvidCtxLockCreate
cuvidCtxLockDestroy
cuvidCtxLock
cuvidCtxUnlock
NV JPEG API Functions Traced by Default#
nvjpegBufferDeviceCreate
nvjpegBufferDeviceRetrieve
nvjpegBufferPinnedCreate
nvjpegBufferPinnedRetrieve
nvjpegCreate
nvjpegCreateEx
nvjpegCreateSimple
nvjpegDecode
nvjpegDecodeBatched
nvjpegDecodeBatchedEx
nvjpegDecodeBatchedInitialize
nvjpegDecodeBatchedPreAllocate
nvjpegDecodeBatchedSupported
nvjpegDecodeBatchedSupportedEx
nvjpegDecodeJpeg
nvjpegDecodeJpegDevice
nvjpegDecodeJpegHost
nvjpegDecodeJpegTransferToDevice
nvjpegDecodeParamsCreate
nvjpegDecodeParamsDestroy
nvjpegDecodeParamsSetAllowCMYK
nvjpegDecodeParamsSetOutputFormat
nvjpegDecodeParamsSetROI
nvjpegDecodeParamsSetScaleFactor
nvjpegDecoderCreate
nvjpegDecoderDestroy
nvjpegDecoderJpegSupported
nvjpegDecoderStateCreate
nvjpegDestroy
nvjpegEncodeGetBufferSize
nvjpegEncodeImage
nvjpegEncodeRetrieveBitstream
nvjpegEncodeRetrieveBitstreamDevice
nvjpegEncoderParamsCopyHuffmanTables
nvjpegEncoderParamsCopyMetadata
nvjpegEncoderParamsCopyQuantizationTables
nvjpegEncoderParamsCreate
nvjpegEncoderParamsDestroy
nvjpegEncoderParamsSetEncoding
nvjpegEncoderParamsSetOptimizedHuffman
nvjpegEncoderParamsSetQuality
nvjpegEncoderParamsSetSamplingFactors
nvjpegEncoderStateCreate
nvjpegEncoderStateDestroy
nvjpegEncodeYUV,(nvjpegHandle_t handle
nvjpegGetCudartProperty
nvjpegGetDeviceMemoryPadding
nvjpegGetImageInfo
nvjpegGetPinnedMemoryPadding
nvjpegGetProperty
nvjpegJpegStateCreate
nvjpegJpegStateDestroy
nvjpegJpegStreamCreate
nvjpegJpegStreamDestroy
nvjpegJpegStreamGetChromaSubsampling
nvjpegJpegStreamGetComponentDimensions
nvjpegJpegStreamGetComponentsNum
nvjpegJpegStreamGetFrameDimensions
nvjpegJpegStreamGetJpegEncoding
nvjpegJpegStreamParse
nvjpegJpegStreamParseHeader
nvjpegSetDeviceMemoryPadding
nvjpegSetPinnedMemoryPadding
nvjpegStateAttachDeviceBuffer
nvjpegStateAttachPinnedBuffer
Network Communication Profiling#
Nsight Systems can be used to profiles several popular network communication protocols and many network hardware components. To enable this, please select the Network profiling options dropdown.
Note
Network hardware profiling uses statistical sampling of counters on the various appliances. Network communication API profiling uses direct trace of relevant function calls. Nsight Systems correlates the data as well as we can, however the inherent profiling differences make correlation somewhat inexact.
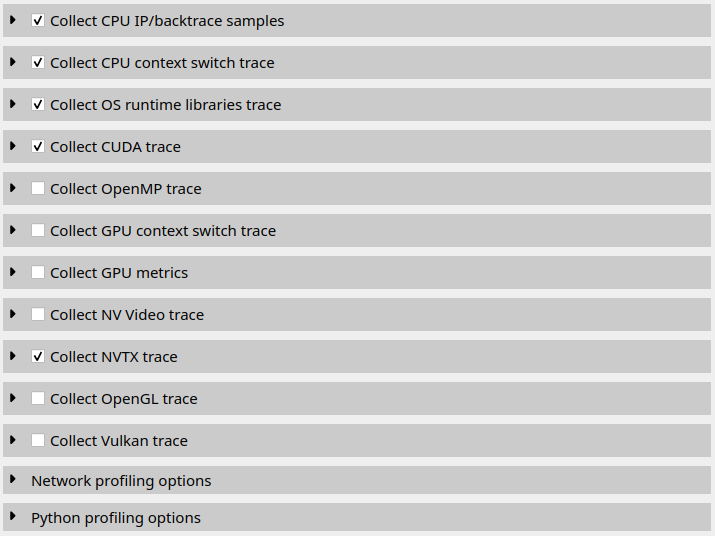
Then select the libraries you would like to trace:
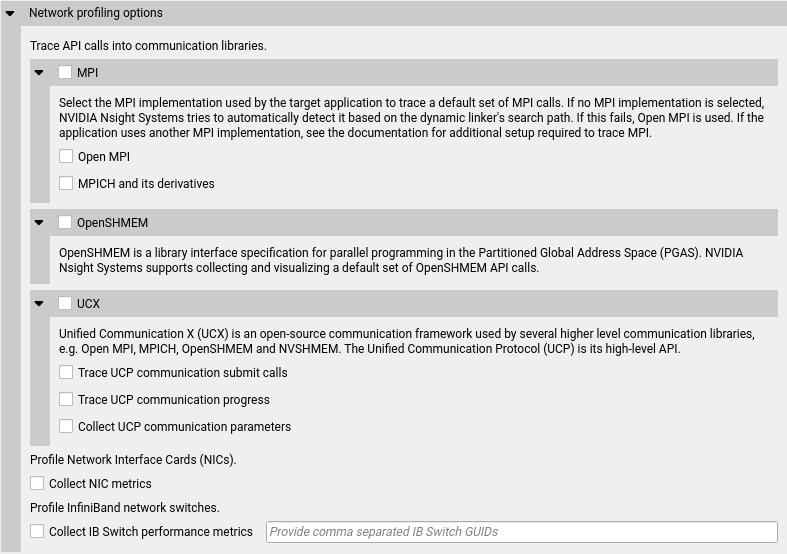
The corresponding Nsight Systems CLI --trace|-t options are mpi,
oshmem, ucx, and nccl. For multi-node runs, please refer to the section on
Handling Application Launchers (mpirun, deepspeed, etc).
MPI API Trace#
Nsight Systems has built-in API trace support for Open MPI and MPICH
based MPI implementations via --trace=mpi or by selecting the MPI checkbox
under Network profiling options. If the auto-detection of the MPI
implementation fails, it is possible to specify
it via --mpi-impl=[openmpi|mpich] or the respective checkbox in the GUI.
Nsight Systems will trace a subset of the MPI API, including blocking and non-blocking point-to-point and collective communications as well as MPI one-sided communications, file I/O, and pack operations (see MPI functions traced).
If you require more control over the list of traced APIs or if you are using a different MPI implementation, you can use the NVTX wrappers for MPI on GitHub. Choose an NVTX domain name other than “MPI,” since it is filtered out by Nsight Systems when MPI tracing is not enabled. Use the NVTX-instrumented MPI wrapper library as follows:
nsys profile -e LD_PRELOAD=${PATH_TO_YOUR_NVTX_MPI_LIB} --trace=nvtx
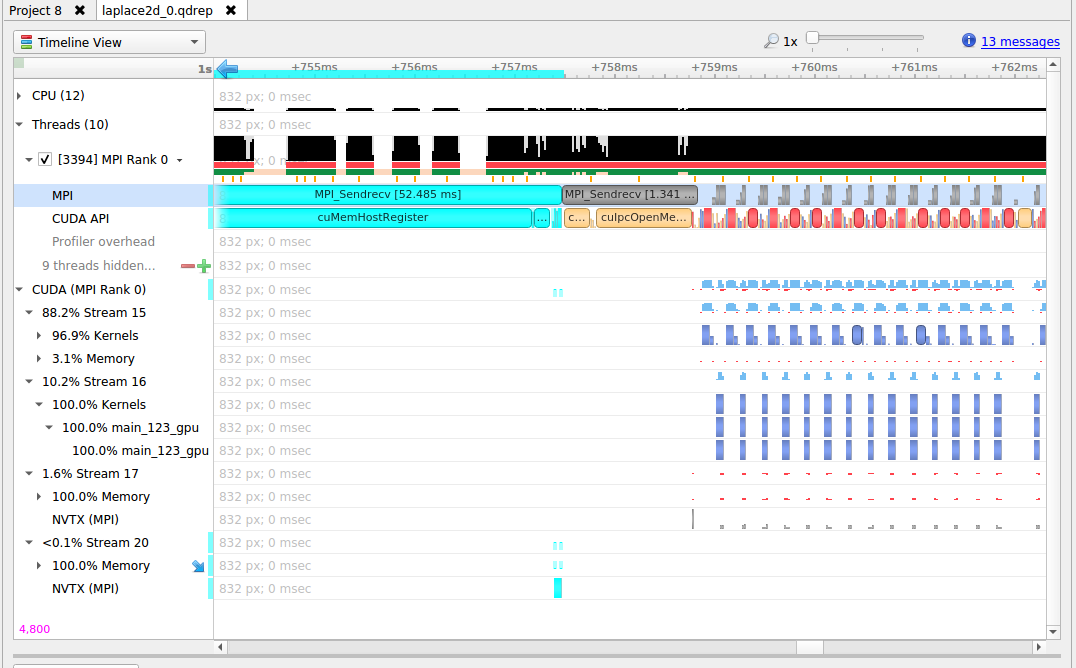
Note
If not all ranks are traced, NSYS_MPI_STORE_TEAMS_PER_RANK has to be set to 1.
If communicator tracking is still causing issues, it can be disabled by setting
NSYS_MPI_DISABLE_COMMUNICATOR_TRACKING=1.
MPI Communication Parameters#
Nsight Systems can get additional information about MPI communication parameters. Currently, the parameters are only visible in the mouseover tooltips or in the event log. This means that the data is only available via the GUI. Future versions of the tool will export this information into the SQLite data files for postrun analysis.
In order to fully interpret MPI communications, data for all ranks associated with a communication operation must be loaded into Nsight Systems.
Here is an example of MPI_COMM_WORLD data. This does not require any additional team data, since local rank is the same as global rank.
(Screenshot shows communication parameters for an MPI_Bcast call on rank 3.)
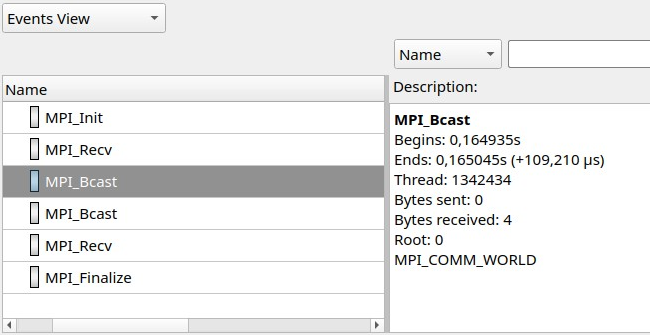
When not all processes that are involved in an MPI communication are loaded into Nsight Systems the following information is available.
Right-hand screenshot shows a reused communicator handle (last number increased).
Encoding:
MPI_COMM[\*team size\*]*global-group-root-rank\*.*group-ID\*
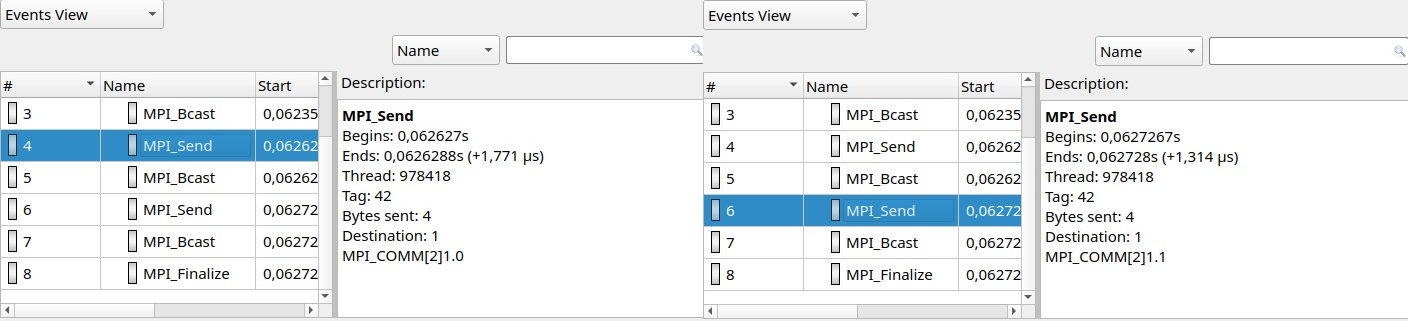
When all reports are loaded into Nsight Systems:
World rank is shown in addition to group-local rank “(world rank X).”
Encoding: MPI_COMM[*team size*]{rank0, rank1, …}.
At most 8 ranks are shown (the numbers represent world ranks, the position in the list is the group-local rank).
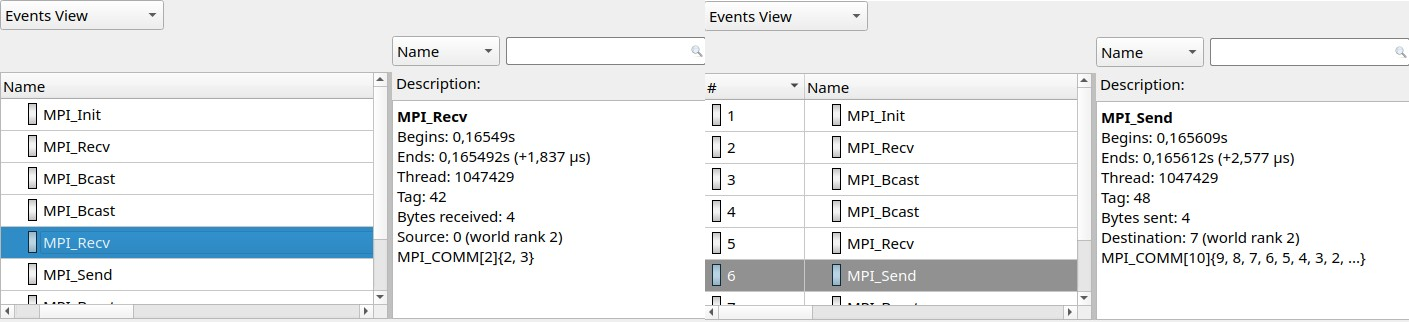
MPI functions traced#
MPI_Init[_thread], MPI_Finalize
MPI_Send, MPI_{B,S,R}send, MPI_Recv, MPI_Mrecv
MPI_Sendrecv[_replace]

MPI_Barrier, MPI_Bcast
MPI_Scatter[v], MPI_Gather[v]
MPI_Allgather[v], MPI_Alltoall[{v,w}]
MPI_Allreduce, MPI_Reduce[_{scatter,scatter_block,local}]
MPI_Scan, MPI_Exscan

MPI_Isend, MPI_I{b,s,r}send, MPI_I[m]recv
MPI_{Send,Bsend,Ssend,Rsend,Recv}_init
MPI_Start[all]
MPI_Ibarrier, MPI_Ibcast
MPI_Iscatter[v], MPI_Igather[v]
MPI_Iallgather[v], MPI_Ialltoall[{v,w}]
MPI_Iallreduce, MPI_Ireduce[{scatter,scatter_block}]
MPI_I[ex]scan
MPI_Wait[{all,any,some}]

MPI_Put, MPI_Rput, MPI_Get, MPI_Rget
MPI_Accumulate, MPI_Raccumulate
MPI_Get_accumulate, MPI_Rget_accumulate
MPI_Fetch_and_op, MPI_Compare_and_swap

MPI_Win_allocate[_shared]
MPI_Win_create[_dynamic]
MPI_Win_{attach, detach}
MPI_Win_free
MPI_Win_fence
MPI_Win_{start, complete, post, wait}
MPI_Win_[un]lock[_all]
MPI_Win_flush[_local][_all]
MPI_Win_sync

MPI_File_{open,close,delete,sync}
MPI_File_{read,write}[_{all,all_begin,all_end}]
MPI_File_{read,write}_at[_{all,all_begin,all_end}]
MPI_File_{read,write}_shared
MPI_File_{read,write}_ordered[_{begin,end}]
MPI_File_i{read,write}[_{all,at,at_all,shared}]
MPI_File_set_{size,view,info}
MPI_File_get_{size,view,info,group,amode}
MPI_File_preallocate

MPI_Pack[_external]
MPI_Unpack[_external]
OpenSHMEM Library Trace#
If OpenSHMEM library trace is selected Nsight Systems will trace the subset of OpenSHMEM API functions that are most likely be involved in performance bottlenecks. To keep overhead low Nsight Systems does not trace all functions.
OpenSHMEM 1.5 Functions Not Traced
shmem_my_pe
shmem_n_pes
shmem_global_exit
shmem_pe_accessible
shmem_addr_accessible
shmem_ctx_{create,destroy,get_team}
shmem_global_exit
shmem_info_get_{version,name}
shmem_{my_pe,n_pes,pe_accessible,ptr}
shmem_query_thread
shmem_team_{create_ctx,destroy}
shmem_team_get_config
shmem_team_{my_pe,n_pes,translate_pe}
shmem_team_split_{2d,strided}
shmem_test*
UCX API Trace#
If UCX API trace is selected Nsight Systems will trace the subset of functions of the UCX protocol layer UCP that are most likely be involved in performance bottlenecks. To keep overhead low Nsight Systems does not trace all functions.
The following environment variables control what is recorded:
NSYS_UCP_COMM_SUBMIT: (enabled by default) If set to0, UCP communication submission calls are not recorded any more. These calls are usually short, because the communication itself is handled in a worker thread.NSYS_UCP_COMM_PROGRESS: (enabled by default) If set to0, tracking of (process-local) UCP communication progress is disabled. The progress tracking uses UCP completion callbacks.NSYS_UCP_COMM_PARAMS: (enabled by default) If set to0, UCP communication parameters (tag, remote worker UID, packed message size, buffer address) will not be recorded. Recording the remote worker UID requires UCX >= 1.12.0. Recording the packed message size requires UCX >= 1.14.0.
UCX functions traced#
ucp_am_send_nb[x]
ucp_am_recv_data_nbx
ucp_am_data_release
ucp_atomic_{add{32,64},cswap{32,64},fadd{32,64},swap{32,64}}
ucp_atomic_{post,fetch_nb,op_nbx}
ucp_cleanup
ucp_config_{modify,read,release}
ucp_disconnect_nb
ucp_dt_{create_generic,destroy}
ucp_ep_{create,destroy,modify_nb,close_nbx}
ucp_ep_flush[{_nb,_nbx}]
ucp_listener_{create,destroy,query,reject}
ucp_mem_{advise,map,unmap,query}
ucp_{put,get}[_nbi]
ucp_{put,get}_nb[x]
ucp_request_{alloc,cancel,is_completed}
ucp_rkey_{buffer_release,destroy,pack,ptr}
ucp_stream_data_release
ucp_stream_recv_data_nb
ucp_stream_{send,recv}_nb[x]
ucp_stream_worker_poll
ucp_tag_msg_recv_nb[x]
ucp_tag_{send,recv}_nbr
ucp_tag_{send,recv}_nb[x]
ucp_tag_send_sync_nb[x]
ucp_worker_{create,destroy,get_address,get_efd,arm,fence,wait,signal,wait_mem}
ucp_worker_flush[{_nb,_nbx}]
ucp_worker_set_am_{handler,recv_handler}
UCX Functions Not Traced:
ucp_config_print
ucp_conn_request_query
ucp_context_{query,print_info}
ucp_get_version[_string]
ucp_ep_{close_nb,print_info,query,rkey_unpack}
ucp_mem_print_info
ucp_request_{check_status,free,query,release,test}
ucp_stream_recv_request_test
ucp_tag_probe_nb
ucp_tag_recv_request_test
ucp_worker_{address_query,print_info,progress,query,release_address}
Additional API functions from other UCX layers may be added in a future version of the product.
NVIDIA NCCL Trace#
Nsight Systems provides two methods for tracing NVIDIA NCCL (NVIDIA Collective Communications Library) operations:
Legacy NCCL tracing: is based on NVTX annotations within the NCCL library itself.
Enabled by default when NVTX tracing is active
Traces API calls on the CPU
Provides limited GPU-projection of ranges in the GUI
Advanced NCCL tracing: A more detailed tracing mechanism introduced in Nsight Systems 2025.6.1.
Requires NCCL version 2.28 or higher (with limited support for versions 2.27.4 and later)
Support for Copy Engine (CE) collectives requires NCCL version 2.29 or higher
Provides detailed information about GPU operations and asynchronous runtime scheduling
Enhances correlation across events
Less precise timestamps for CPU API calls compared to legacy NCCL tracing
NCCL Execution Concepts#
To effectively interpret NCCL traces, it is important to understand the following aspects of NCCL’s operation. A NCCL collective operation comprises multiple steps on the CPU and GPU:
The application calls the NCCL API.
The NCCL runtime prepares and schedules the operation in queues for the GPU.
The CUDA kernel is launched.
The operation executes within a CUDA kernel.
The order of these steps and the threads in which they occur depend on the application pattern:
Use of groups
Blocking vs. non-blocking communicators
CUDA graph capture
Group Operations
When using NCCL groups, all operations within the group are executed at the end of the group:
Operations in a group are typically fused into a single CUDA kernel per rank/device.
With legacy NCCL tracing, the
ncclGroupEndfunction is projected to the fused CUDA kernel on the GPU.When no explicit groups are used, there is an implicit group as part of each API call. This implicit grouping is not shown in legacy NCCL tracing.
Non-blocking Communicators
For non-blocking communicators, CUDA calls are performed in different threads:
Legacy NCCL tracing cannot track these cross-thread operations.
Plugin-based tracing properly correlates all events (e.g., API calls, CUDA calls, and GPU operations) that belong to one logical operation.
Graph Capture
With graph capture, the API calls and kernel launch are captured once, but the runtime scheduling and GPU operations happen multiple times, once per graph launch.
Advanced NCCL Tracing#
The advanced NCCL tracing mechanism provides comprehensive visibility into NCCL operations across the CPU and GPU. The actual trace structure depends heavily on the specific application patterns.
Internally, the advanced NCCL tracing is built as a profiler plugin of NCCL (not to be confused with an nsys plugin).
Trace Information#
The advanced NCCL tracing provides the following information in reports:
API Calls
NCCL API calls (collective, point-to-point, and group operations) on the CPU are traced with the following characteristics:
Groups are shown as an
API Grouprange that spans all API calls within the group. Technically, this range does not includencclGroupStart, but extends through the end ofncclGroupEnd/GroupLaunch.Individual API calls are shown below the
API Grouprange.The
ncclprefix is omitted from function names (e.g.,ncclAllReduceappears asAllReduce).The
GroupLaunchrange corresponds to thencclGroupEndfunction call on the application thread invoking the NCCL group functions.For blocking communication, this range encompasses the preparation for kernel launches. There can be multiple launches per group, usually one per rank/device, and the actual CUDA kernel launches are collected as
KernelLaunchranges.
Runtime Scheduling
Runtime scheduling events show where NCCL runs on the CPU and queues operations for the GPU:
GroupRuntimeranges encompass the individual runtime scheduling for collective and point-to-point operations.Runtime scheduling can occur in different contexts:
Directly at the end of the
API Groupfor blocking communicatorsIn a separate thread for non-blocking communicators
For graph launches, there are multiple runtime groups for a single API group, one per launch, and the group events occur in a host function on a special thread
GPU Operations
GPU operations are displayed with the following details:
Individual operations within fused CUDA kernels are shown with accurate GPU timestamps.
Operations are further split across multiple channels that execute concurrently.
GPU operations are shown directly under the GPU in the timeline view.
Copy Engine (CE) Collectives
CE-based collectives are not shown as GPU operations in the NCCL device row.
They use CUDA memory operations rather than CUDA kernels.
By default, for each API call to a CE collective, a corresponding range will be shown within the GroupLaunch range.
In addition, you can configure Nsight Systems to add two CE Sync ranges and one CE Batch range below each CE collective range (see Configuration Options).
Proxy Activity
NCCL uses a proxy thread to support CPU-orchestrated inter-node communication. Some activity in this proxy thread can be collected and shown in the timeline view. Proxy activity recording is experimental, may change in future releases, and is not enabled by default. This view is intended for expert-level analysis and can be difficult to interpret. Use it for deep dives into network bottlenecks and supplement it with general network counters. In the Nsight Systems GUI, proxy step visualization can be dense due to the volume of detail and is best suited to analysis of exported files.
Proxy operation ranges encapsulate the proxy activity for one peer, channel and direction. Each proxy operation is split into proxy steps to process individual chunks in a pipelined manner. Within each proxy step, state changes are recorded. Due to the amount of data collected for proxy steps, the data collection can have a significant performance impact.
Proxy counters summarize the proxy activity within one communicator.
They display the number of proxy steps in any given state, separated into ProxyStepSend and ProxyStepRecv.
All NCCL proxy activity is performed by a dedicated CPU thread for each rank/communicator.
This thread is named NCCL Progress [$rank/$nRanks]: $commHash to easily identify the context.
Nsight Systems shows both the proxy operations and proxy counters as part of this thread.
Communicators
All NCCL events are organized in categories: one for each communicator.
In the GUI, NCCL rows initially show events from all communicators but can be expanded to display events grouped by communicator.
For complex applications, developers should assign names to communicators within the application by setting commName in ncclConfig_t.
Creation of communicators is indicated by a CommInit marker in a dedicated initialization thread.
Metadata
All NCCL events carry metadata (payload information):
Information about the communicator,
Operation-related events carry metadata about the specific operation, e.g., data type, element count, etc.,
Correlation identifiers.
Event Correlation
Events corresponding to individual operations are correlated by the apiId, which for collective operations includes the operations of all participating ranks.
The correlation links the API call, collective runtime scheduling, and GPU operation, helping to track operations through the UI.
Additional correlation identifiers are available but not currently used to avoid highlighting too many ranges simultaneously:
apiGroupId: All API calls and corresponding kernel launches in a specific (thread-local) groupgroup: Group identifier
CUDA Graph Capture
The advanced NCCL tracing can track individual operations through CUDA graph capture and graph launches, from the API call through runtime scheduling in host functions to the GPU operation.
Memory Overhead
To collect a consistent and correlated trace, the NCCL injection allocates data for each event using a growing pre-allocated buffer. The buffer is freed when the communicator is finalized.
Capture Ranges
Capture ranges affect data collection. Outside of capture ranges, no data is collected and the overhead is significantly reduced. In particular, the NCCL injection does not allocate data for each event outside capture ranges. If correlating NCCL events are only partially inside a capture range, the correlation may be lost. For example, if the API calls occur before a capture range and only the operations are inside, the operations will be included but without correlation identifiers.
Report View#
The timeline view of a report with advanced NCCL tracing includes several types of NCCL rows:
A
NCCLrow directly under each device shows the GPU operations.CPU threads that call API functions include a
NCCLrow showing the respective API events.Internal threads that execute non-blocking or graph host functions also include a
NCCLrow showing runtime events (not shown in the example).An additional global
NCCLrow at the bottom combines the CPU-side NCCL events from all processes/threads in the report.Below the stream rows on the device,
NCCLrows show projections of the respective internal NCCL ranges which were responsible for launching the corresponding CUDA activity.
Each NCCL row can be expanded to show individual events for each communicator.
The screenshot shows two participating devices with a simple API group that includes two API calls (one for each rank).
Since this is a blocking communicator, the group directly executes the NCCL internal functions GroupLaunch and GroupRuntime.
A tooltip shows the metadata of a NCCL operation.
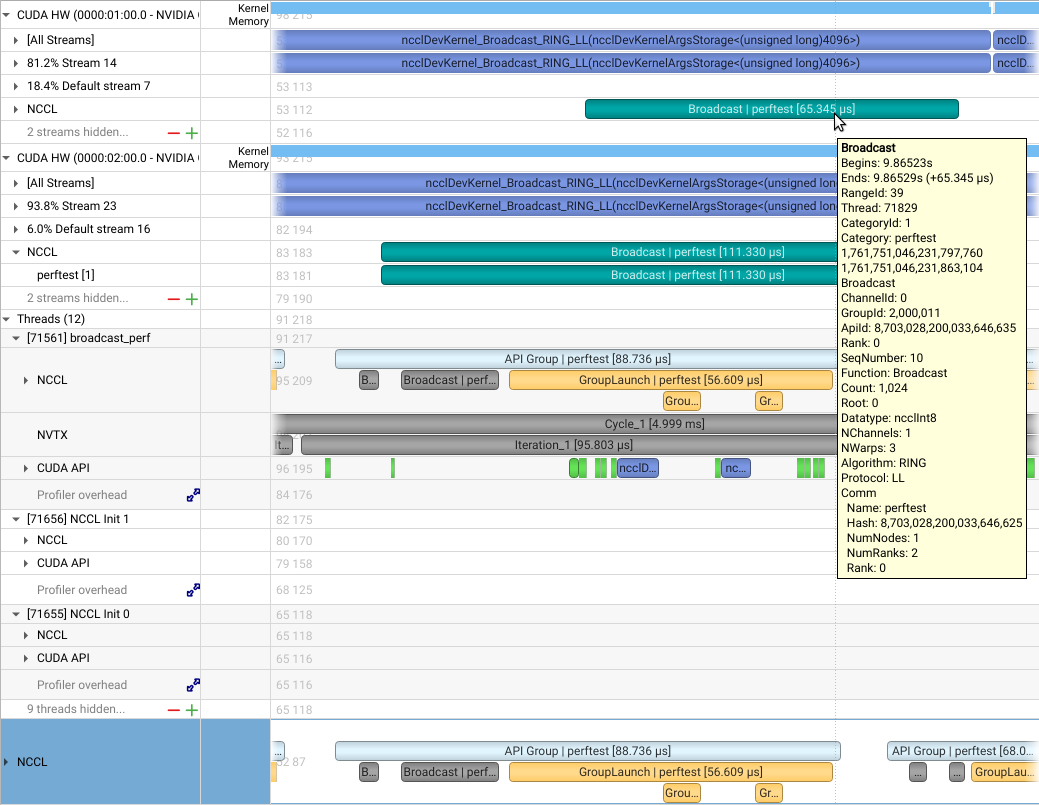
Exporting#
The data from advanced NCCL tracing can be exported as SQLite database for further processing. See SQLite Schema Reference for more details.
NCCL events are available as NVTX ranges in the exported database.
While legacy NCCL tracing also uses NVTX, the exported events differ.
Add --include-json true to include the metadata as JSON in the exported tables.
The specific schema of the exported tables may be subject to change in the future.
Limitations#
The advanced NCCL tracing has the following limitations (as of NCCL v2.28):
Communicator creation API functions are not collected directly. However, the creation is indicated in the initialization thread via
CommInitmarkers.Single-rank communications, which are usually only buffer copies, are not shown at all. Their events are not captured.
Symmetric memory based collectives (new low latency implementations of AllReduce, AllGather and ReduceScatter) are not fully supported. Only the API calls are collected.
AllToAll, Gather, Scatter operations will be shown as their underlying grouped point-to-point operations rather than the high-level API call.
Usage#
To use advanced NCCL tracing:
Enable NCCL tracing using the
-t nccloption withnsys profileor enable the “NCCL” section in the Network profiling options of the GUI:nsys profile -t nccl <application>
Note
By default, only the legacy NCCL tracing (API calls) is active.
Normally, both NCCL and CUDA tracing are enabled.
nsys profile -t nccl,cuda <application>
When advanced NCCL tracing is enabled, the legacy NCCL tracing is automatically disabled.
Configuration Options#
Configure advanced NCCL tracing using the --nccl-trace option with nsys profile. The following values are available and can be combined using commas (e.g., --nccl-trace=api,rt):
api-group: TheAPI Grouprangeapi-coll: Collective API calls (e.g.,AllReduce)api-p2p: Point-to-point API calls (SendandRecv)api: All of the three API ranges above (api-group,api-coll,api-p2p)group:GroupRuntimeranges for operation scheduling on the CPUcoll: Runtime scheduling of individual collective operationsp2p: Runtime scheduling of individual point-to-point operationskernel-launch: Ranges around CUDA kernel launchesce-coll: Launch of memory operations for Copy Engine (CE) -based collectivesce-sync: Synchronization of CE collectives (within ce-coll)ce-batch: Batch operations of CE collectives (within ce-coll)rt: All runtime ranges (group,coll,p2p,kernel-launch)gpu: Individual operations on the GPUproxy-op: Proxy operation ranges (experimental)proxy-step: Proxy step ranges including state changes (experimental, high overhead)proxy-counters: Proxy counters (experimental)default: The default set of events (api,group,gpu,ce-coll)all: All possible events (exceptproxy-op,proxy-step)
The interaction between --nccl-trace and --trace works as follows:
If
--nccl-traceis explicitly set, it takes priority over any NCCL-related settings from--trace. Any value other thannoneimplicitly includesncclin--trace.If
--nccl-traceis not set, the default behavior depends on--trace: ifncclis included in--trace,defaultis used for--nccl-trace; otherwise,noneis used.
More Examples#
Enable advanced NCCL tracing with all events as well as CUDA tracing:
nsys profile -t nccl,cuda --nccl-trace=all <application>
Disable advanced NCCL tracing to fall back to legacy NCCL tracing:
nsys profile -t cuda,nvtx <application>
Disable the NCCL NVTX domain, neither advanced NCCL tracing nor legacy NCCL tracing will be enabled:
nsys profile -t cuda,nvtx --nvtx-domain-exclude=NCCL <application>
Disable NVTX tracing completely, neither advanced NCCL tracing nor legacy NCCL tracing will be enabled:
nsys profile -t cuda <application>
NVIDIA NVSHMEM Trace#
The NVIDIA network communication library NVSHMEM has been instrumented using NVTX annotations. To enable tracing this library in Nsight Systems, turn on NVTX tracing in the GUI or CLI. To enable the NVTX instrumentation of the NVSHMEM library, make sure that the environment variable NVSHMEM_NVTX is set properly; e.g., NVSHMEM_NVTX=common.
Network Hardware Profiling#
Nsight Systems can be used to profile several popular network communication protocols and many network hardware components.
Note
Network hardware profiling uses statistical sampling of counters on the various appliances. Network communication API profiling uses direct trace of relevant function calls. Nsight Systems correlates the data as well as we can, however the inherent profiling differences make correlation somewhat inexact.
InfiniBand Network Information#
Overview
By default, Nsight Systems displays low-level identifiers like LIDs (Local Identifiers) and GUIDs (Globally Unique Identifiers). Instead, Nsight Systems can leverage InfiniBand network information to display the actual names of nodes and switches. This makes the Nsight Systems reports much more intuitive and easier to understand at a glance.
InfiniBand network information discovery is done using the ibdiagnet utility. Either:
Run ibdiagnet and store the generated network information files to be later used by Nsight Systems.
- This method is useful for large networks, where
ibdiagnet’s network discovery time may be long, and for networks where only administrators have permissions to query the network information.
A user can ask Nsight Systems to run ibdiagnet to collect the network information during the profiling session.
This method is useful for small networks.
Limitations/Requirements
The user needs to have permission to send MADs (management datagrams). To check
if you have permission to send MADs, check if you can access the
/dev/infiniband/umad* files. To give user permissions to send MADs on RedHat
systems, follow the directions at RedHat Solutions.
Relevant Switches
The following Nsight Systems command line switches enable collecting InfiniBand network information:
ib-net-info-devicesThis should be followed by a comma separated list of NIC names, from which ibdiagnet will run network discovery. The results of the network discovery will be automatically loaded into Nsight Systems.
ib-net-info-filesThis should be followed by a comma separated list of pre-generated ibdiagnet db_csv file paths, which Nsight Systems will read.
ib-net-info-outputThis should be followed by a path of a directory into which Nsight Systems will store the ibdiagnet network discovery data. These files will be used by the
ib-net-info-devicescommand line switch. This command line switch can only be used together with theib-net-info-devicescommand line switch.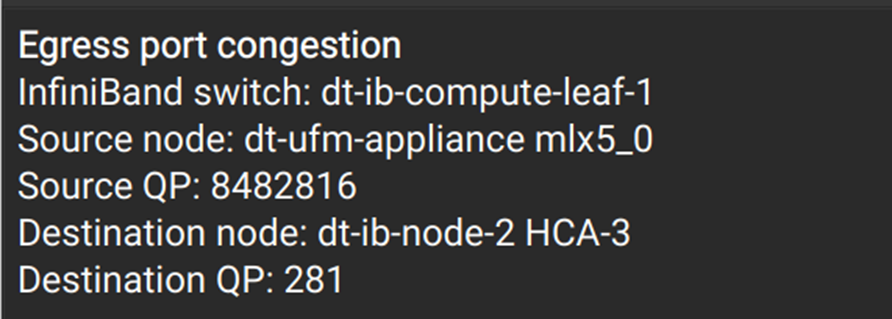
The above image displays a congestion event. InfiniBand network information is used for displaying node and switch names instead of LIDs.
Network Interface Controller (NIC) Profiling#
NVIDIA NIC Metric Sampling#
Overview
NVIDIA ConnectX smart network interface cards (smart NICs) offer advanced hardware offloads and accelerations for network operations. Viewing smart NICs metrics, on Nsight Systems timeline, enables developers to better understand their application’s network usage. Developers can use this information to optimize the application’s performance.
Limitations/Requirements
NIC metric sampling supports NVIDIA ConnectX boards starting with ConnectX 5
NIC metric sampling is supported on Linux x86_64 and Arm Server (SBSA) machines only, having minimum Linux kernel 4.12 and minimum MLNX_OFED 4.1. You can download the latest OFED driver through the DOCA-Host package as doca-ofed at NVIDIA DOCA Downloads. For archived versions of the OFED driver you can visit MLNX_OFED Download Center. If collecting NIC metrics within a container, make sure that the container has access to the driver on the host machine. To check manually if OFED is installed and get its version you can run:
/usr/bin/ofed_infocat /sys/module/"$(cat /proc/modules | grep -o -E "^mlx._core")"/version
For the high frequency metrics, the following requirements must be met:
The NICs must be ConnectX-7, BlueField 3 or newer.
The NICs must have firmware XY.43.1000 or newer.
The mlx5_fwctl module must be loaded.
The DOCA telemetry (libdoca_telemetry.so.2) and common (libdoca_common.so.2) libraries must be installed.
The user must have elevated privileges.
All NICs on the target machine must have the same type of clock, Real Time Clock (RTC) or Free Running Clock (FRC). The clock can be set through the NIC’s firmware.
To check if the target system meets the requirements for NIC metrics collection you can run nsys status --network.
Collecting NIC Metrics Using the Command Line
To collect NIC performance metrics, using Nsight Systems CLI, add the --nic-metrics command line switch:
nsys profile --nic-metrics=lf my_app
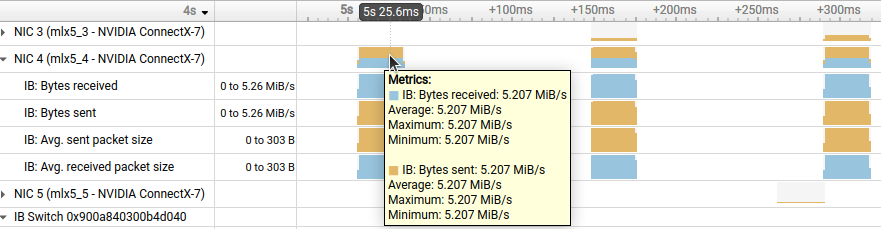
Note
The high frequency option, hf, collects samples at a higher frequency compared to the lf
option. --nic-metrics=hf will not collect counters for RoCE, IPoIB traffic and the Send
waits metric.
Available Metrics
Bytes sent - Number of bytes sent through the NIC port.
Bytes received - Number of bytes received by the NIC port.
Average sent packet size - Average byte size of packets sent through the NIC port.
Average received packet size - Average byte size of packets received by the NIC port.
CNPs sent - Number of congestion notification packets sent by the NIC.
CNPs received - Number of congestion notification packets received and handled by the NIC.
Send waits - The number of ticks during which the port had data to transmit but no data was sent during the entire tick (either because of insufficient credits or because of lack of arbitration)
Note
The counters for RoCE traffic reflect the sum of unicast and multicast traffic.
Usage Examples
The
Bytes sent/secand theBytes received/secmetrics enables identifying idle and busy NIC times.Developers may shift network operations from busy to idle times to reduce network congestion and latency.
Developers can use idle NIC times to send additional data without reducing application performance.
CNPs (congestion notification packets) received/sent and Send waits metrics may explain network latencies. A developer seeing the time periods when the network was congested may rewrite his algorithm to avoid the observed congestions.
Amazon AWS EFA NIC Metrics#
Nsight Systems can now periodically sample performance counters for AWS Elastic Fabric Adapters (EFAs) and plot it on the timeline in the GUI. This enables developers to analyze how network communications may be involved with the critical path of their multi-node application. Created in collaboration with AWS, this plugin will work on AWS EC2 NVIDIA GPU accelerated compute instances .
To enable the AWS EFA metrics add the following option to the nsys
profile or start commands:
--enable efa_metrics[,arg1[=value1],arg2[=value2], ...]
There are no spaces following efa_metrics plugin name. It is followed by a
comma separated list of arguments or argument=value pairs. Arguments with spaces
should be enclosed in double quotes.
Supported arguments are:
Name |
Possible Parameters |
Default |
Switch Description |
|---|---|---|---|
|
true, false |
false |
Sample Infiniband non-RDMA counters |
|
<path> |
/sys/class/infiniband |
Root directory for EFA counters sysfs |
|
true, false |
false |
Sample Infiniband WorkRequest counters |
|
true, false |
false |
Sample error counters |
|
integer, a negative value means 1/F frequency |
10 |
Target sample frequency in hertz |
|
throughput, delta, total |
throughput |
Report sampled counters as a value per second, delta since previous sample, or an accumulated sum. |
|
true, false |
false |
Sample packet counters |
Usage Examples
nsys profile --enable efa_metrics ...Sample all EFA adapters, display as bytes per second.
nsys profile --enable efa_metrics,-packets,-errors,-efa-non-rdma ...Sample all available EFA adapter counters.
nsys profile --enable efa_metrics,-mode=total ...Sample all EFA adapters, display as total value sum since profiling start.
nsys profile --enable efa_metrics,-efa-counters-sysfs="/mnt/nv/sys", ...Look for EFA counters in a different sysfs directory. Useful in some k8s environments.
This collector is the first use case for the Nsight Systems Plugins system.
Network Switch Profiling#
InfiniBand Switch Metric Sampling#
NVIDIA Quantum InfiniBand switches offer high-bandwidth, low-latency communication. Viewing switch metrics, on Nsight Systems timeline, enables developers to better understand their application’s network usage. Developers can use this information to optimize the application’s performance.
Limitations/Requirements
IB switch metric sampling supports all NVIDIA Quantum switches. The user needs to have permission to query the InfiniBand switch metrics.
To check if the current user has permissions to query the InfiniBand switch
metrics, check that the user have permission to access /dev/infiniband/umad*
To give user permissions to query InfiniBand switch metrics on RedHat systems, follow the directions at RedHat Solutions.
To collect InfiniBand switch performance metric, using Nsight Systems CLI, add
the --ib-switch-metrics-devices command line switch, followed by a comma
separated list of InfiniBand switch GUIDs. For example:
nsys profile --ib-switch-metrics-devices=<IB switch GUID> my_app
To get a list of InfiniBand switches, reachable by a given NIC, use:
sudo ibswitches -C <nic name>
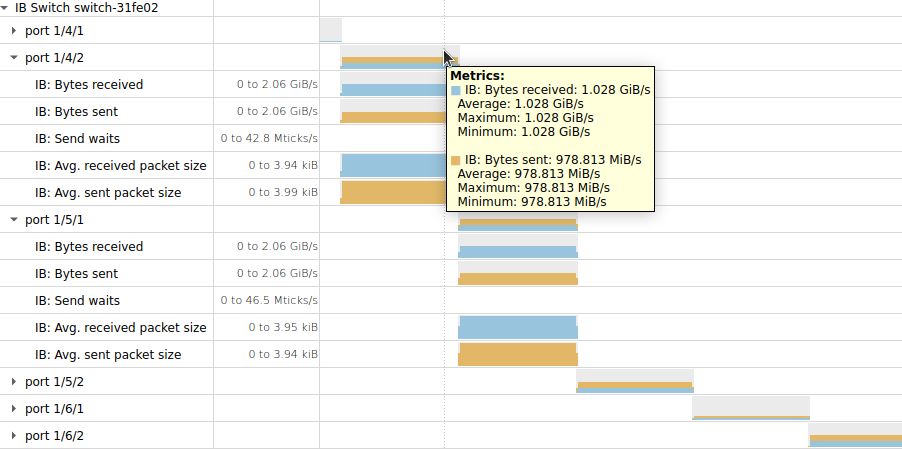
Available Metrics
Bytes sent - Number of bytes sent through all switch ports
Bytes received - Number of bytes received by all switch ports
- Send waits - The number of ticks during which switch ports, selected by
PortSelect, had data to transmit but no data was sent during the entire tick (either because of insufficient credits or of lack of arbitration)
Average sent packet size - Average sent InfiniBand packet size
Average received packet size - Average received InfiniBand packet size
InfiniBand Switch Congestion Events#
Overview#
NVIDIA Quantum InfiniBand switches offer high-bandwidth, low-latency communication.
When a switch egress port is congested, packets wait in the egress port queue before being sent out of the switch. This increases the latency of these packets.
Nsight Systems Workstation Edition gives you the ability to view when switch egress ports are congested on the Nsight Systems timeline. This enables developers to better understand latencies that are caused by the application’s network usage. Developers can use this information to optimize the application’s performance.
Limitations/Requirements#
IB switch congestion events support requires:
Quantum 2 switch or newer
Having firmware version 31.2012.1068 or higher
User need to have permission to send management datagrams
To get a list of InfiniBand switches, reachable by a given NIC, use:
sudo ibswitches -C <nic name>
To check if the current user has permissions to send management datagrams,
check that the user have permission to access /dev/infiniband/umad*
To give user permissions to query InfiniBand switch congestion events on RedHat systems, follow the directions at RedHat Solutions.
Using the Command Line#
To collect InfiniBand switch congestion events, using Nsight Systems CLI, add the following command line switches:
ib-switch-congestion-devicesThis should be followed by a comma separated list of InfiniBand switch GUIDs, from which congestion events will be collected.ib-switch-congestion-nic-deviceThis should be followed by the name of the NIC (HCA) through which InfiniBand switches will be accessed. The profiled InfiniBand switches should be reachable by this NIC.ib-switch-congestion-percentThis defines the percent of InfiniBand switch congestion events to be collected. This option enables reducing the network bandwidth consumed by reporting congestion events. Values are in the [1,100] range.ib-switch-congestion-threshold-highThis defines the high threshold for InfiniBand switch egress port queue size. When a packet enters an InfiniBand switch, its data is stored at an ingress port buffer. A pointer to the packet’s data is inserted into the egress port’s queue, from which the packet will be exiting the switch. At that point, the threshold given by this command switch is compared to the egress queue data size. If the queue data size exceeds the threshold, a congestion event is reported. The threshold is given in percent of the ingress port size. An egress port queue can point to data coming from multiple ingress port buffers, therefore the threshold can be bigger than 100%. Values are in the (1,1023] range
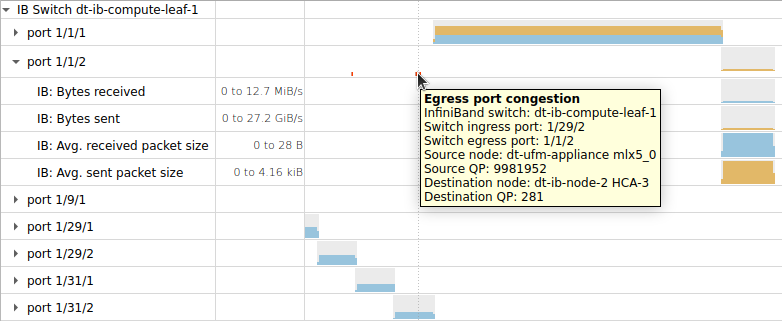
Network Interface Device Profiling#
Network Interface Devices (NIDs) are devices (usually ISP-owned) separating public and private networks. Nsight Systems can now periodically sample performance counters for network interface devices and plot them on the timeline in the GUI.
To enable the network devices metrics add the following option to the nsys
profile or start commands:
--enable network_interface[,arg1[=value1],arg2[=value2], ...]
There are no spaces following network_interface plugin name. It is followed by a
comma separated list of arguments or argument=value pairs. Arguments with spaces
should be enclosed in double quotes.
Supported arguments are:
Short name |
Long name |
Possible Parameters |
Default |
Switch Description |
|---|---|---|---|---|
|
|
integer |
100000 |
Sampling interval in microseconds |
|
|
regular expression |
“.+” (and filtering for physical devices) |
Device(s) to sample |
|
|
regular expression |
“.*_bytes” |
Metric(s) to sample |
|
|
Print help message |
Usage Examples
nsys profile --enable network_interface ...Sample bytes metrics for all physical network devices every 100ms.
nsys profile --enable network_interface,-dall ...Sample bytes metrics for all network devices every 100ms.
nsys profile --enable network_interface,-i10000,-dall,-m".+"Sample all metrics, for all network devices, every 10ms.
For general information on Nsight Systems plugins please refer to Nsight Systems Plugins system.
Network Storage Profiling#
Nsight Systems can profile several major storage / remote storage protocols. It
also ships with the storage_util_map and file_access_sum recipes for
post-collection analysis. See
Post-Collection Analysis Guide
Note
Storage metrics profiling requires additional kernel support and is tailored for HPC systems. This feature is not relevant to Nsight Systems Embedded Platforms Edition.
To activate this feature, use the Nsight Systems CLI --storage-metrics
option, followed by a comma-separated list of the desired arguments.
Available arguments:
--nfs-volumes={all | volume1[,volume2][,volume3..]}: enable NFS storage profiling for the specified volume(s) (specifyallto profile all volumes).--lustre-volumes={all | volume1[,volume2][,volume3..]}: enable Lustre storage profiling for the specified volume(s) (specifyallto profile all volumes).--lustre-llite-dir=<path>: specifies the path of the llite directory mount. This is the/sys/kernel/debug/lustre/llitedirectory mount point (mandatory if Lustre profiling is enabled).--storage-devices={all | device1[,device2][,device3..]}: enable storage profiling of the specified local storage or NVMe-oF device(s) (specifyallto profile all devices).--interval=<value>: sampling interval in milliseconds. Valid range is 1-60000 (default: 1).--cache-samples=<value>: number of samples to cache before submitting the events. Valid range is 1-1000 (default: 100).
Usage Examples
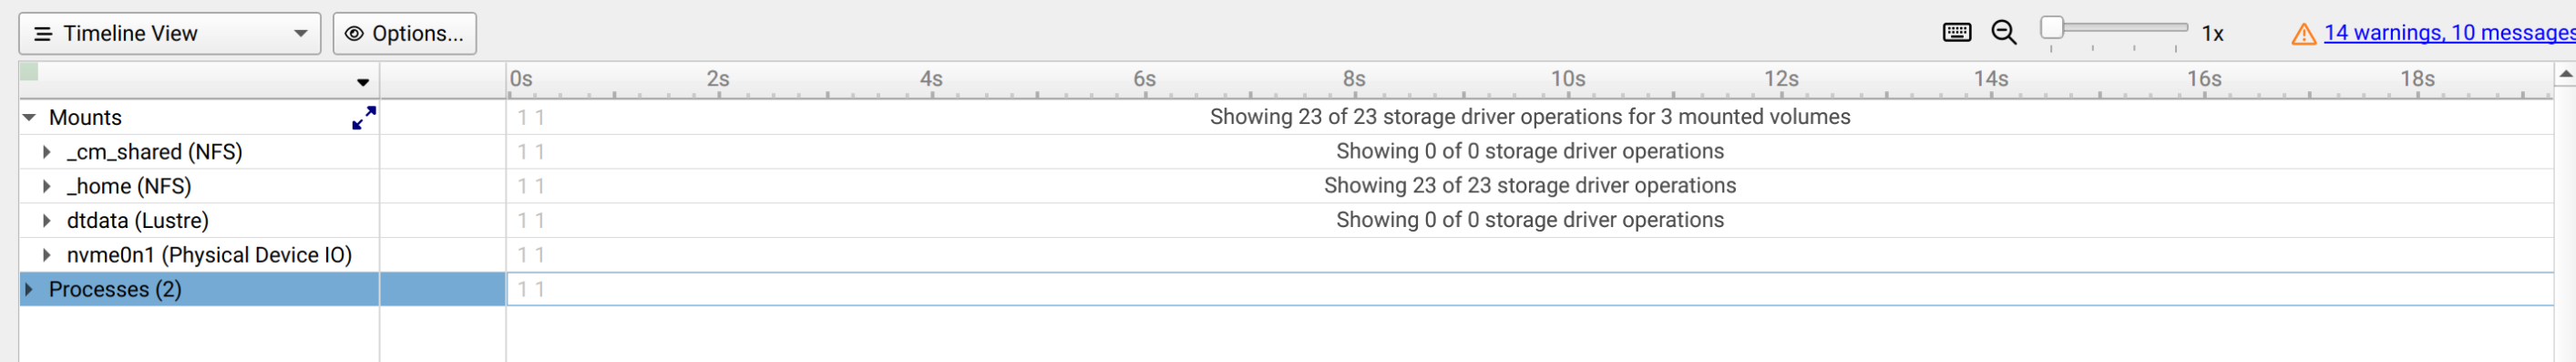
In the report file, under ‘Timeline view’, the storage metrics can be viewed in the Mounts section. Each row contains metrics for one volume or device, with the storage type next to the volume / device name. Expanding each row will show the collected metrics for that volume / device.

The stdout and stderr log files for the storage metrics collection
process can be viewed under the ‘Files’ section, which may assist in debugging.
It is also possible to use combinations of these arguments to profile multiple storage protocols at once. For example:
./nsys profile --storage-metrics --nfs-volumes=all,--lustre-volumes=all,--storage-devices=<device_name1>,<device_name2>,--lustre-llite-dir=<path_to_llite_directory> <target-application>
Note
There are two types of Read/Write metrics:
Application-level Read/Write - Displays quantities of data read/written to the storage device by applications (in Bytes).
Driver-level Read/Write - Displays throughput of data read/written to the storage device by the driver (in bytes/s).
For example, when an application uses the “write” POSIX function to write 10 MB of data into a file, the entire 10 MB will appear, in a single sampling point, at the Application-level Write counter. The same 10 MB of data may be spread across multiple Driver-level Write counter sampling points, since it may take a bit of time for the NFS driver to write 10 MB of data into the NFS storage server.
NFS volumes counters#
Example Nsight Systems command line for NFS storage profiling:
./nsys profile --storage-metrics --nfs-volumes=all <target-application>
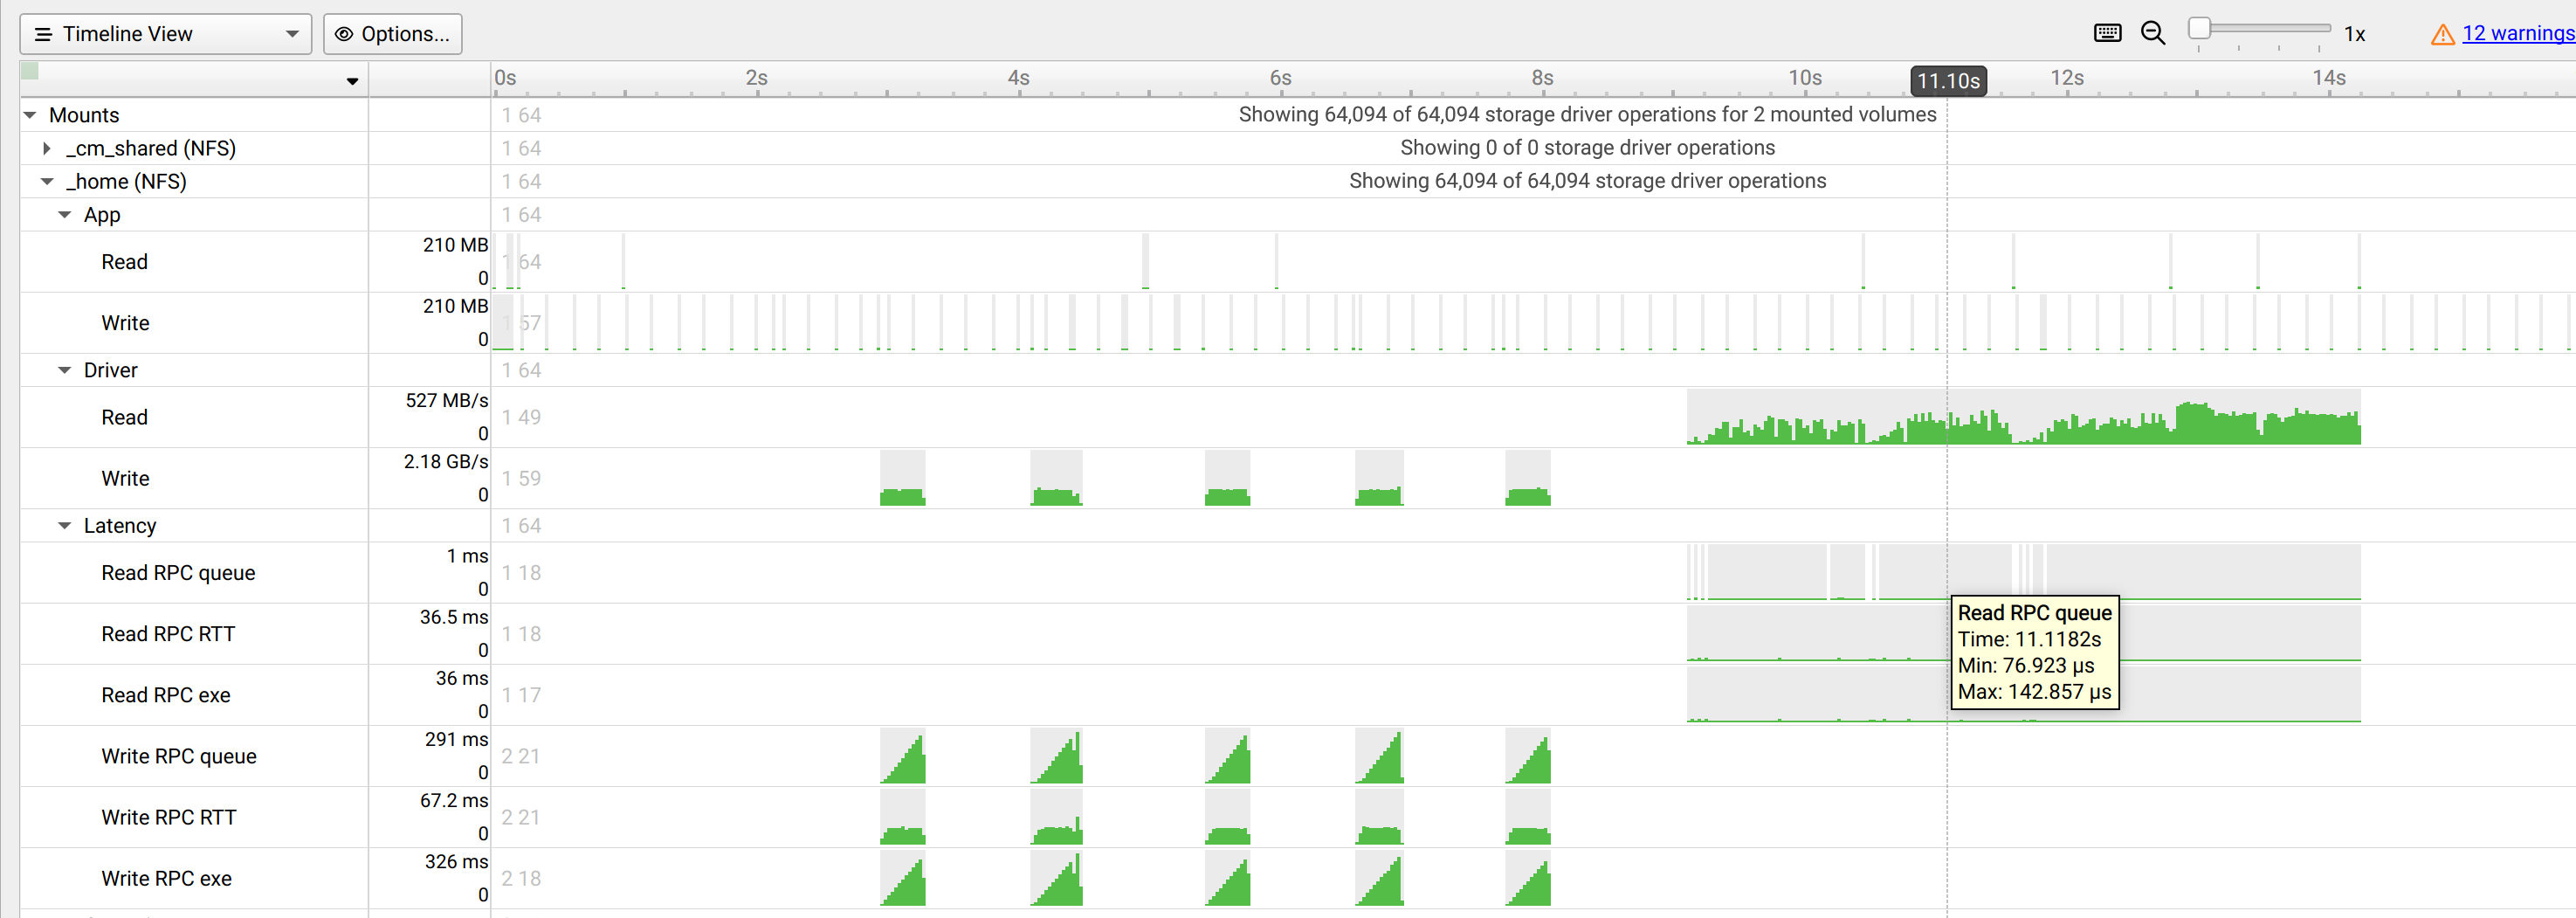
Lustre volumes counters#
Example Nsight Systems command line for Lustre storage profiling:
./nsys profile --storage-metrics --lustre-volumes=dtdata_test,--lustre-llite-dir=/mnt/lustre-stats/llite <target-application>
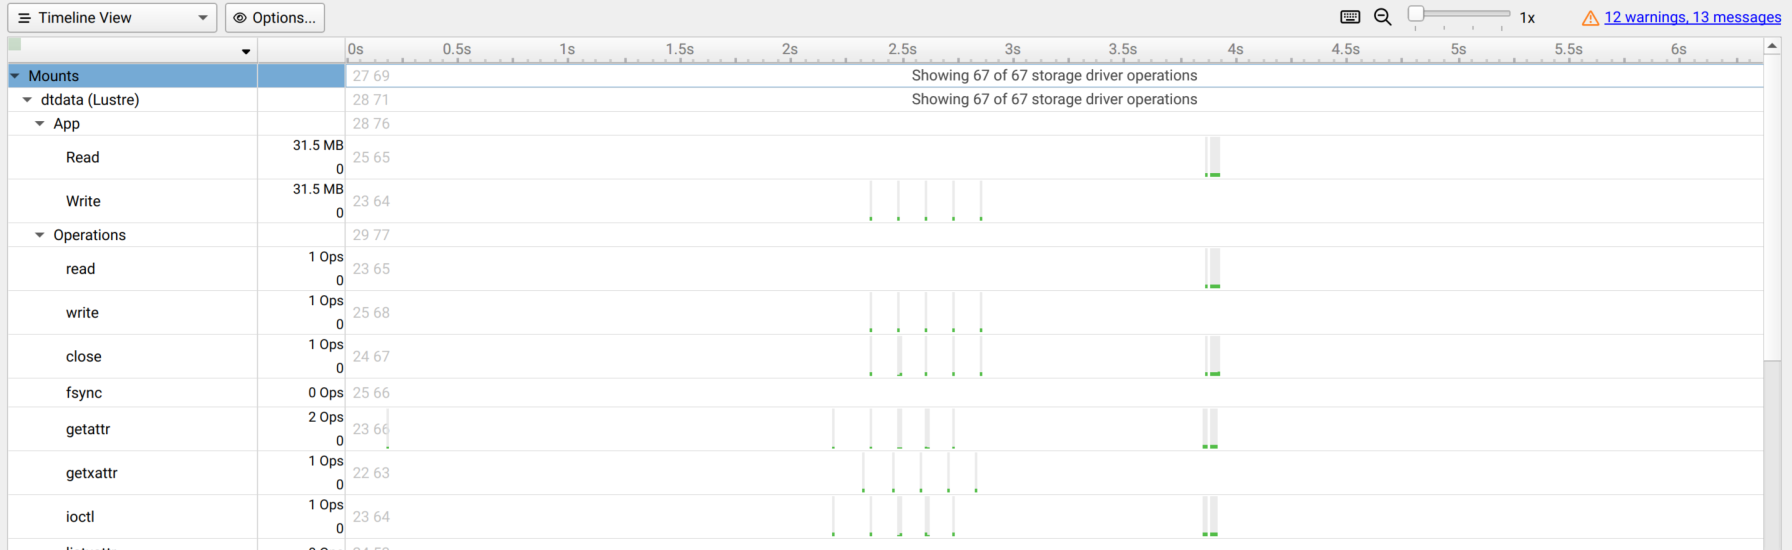
Exposing Lustre driver counters to non-privileged users
The Lustre driver exposes performance counters via virtual files residing under
/sys/kernel/debug/lustre. However, this path is not accessible to
non-privileged users.
To expose the Lustre counters to non-privileged users, a superuser should create
a mount point to /sys/kernel/debug/lustre. For example:
su - root
mkdir /mnt/lustre-stats
mount --bind /sys/kernel/debug/lustre /mnt/lustre-stats
The --lustre-llite-dir= command line argument should point to the llite
directory under this mount point; this will enable Nsight Systems to read the
Lustre counters.
For example: --lustre-llite-dir=/mnt/lustre-stats/llite
Local and NVMe-oF volumes counters#
Example Nsight Systems command line for local storage and NVMe-oF device profiling:
./nsys profile --storage-metrics --storage-devices=all <target-application>
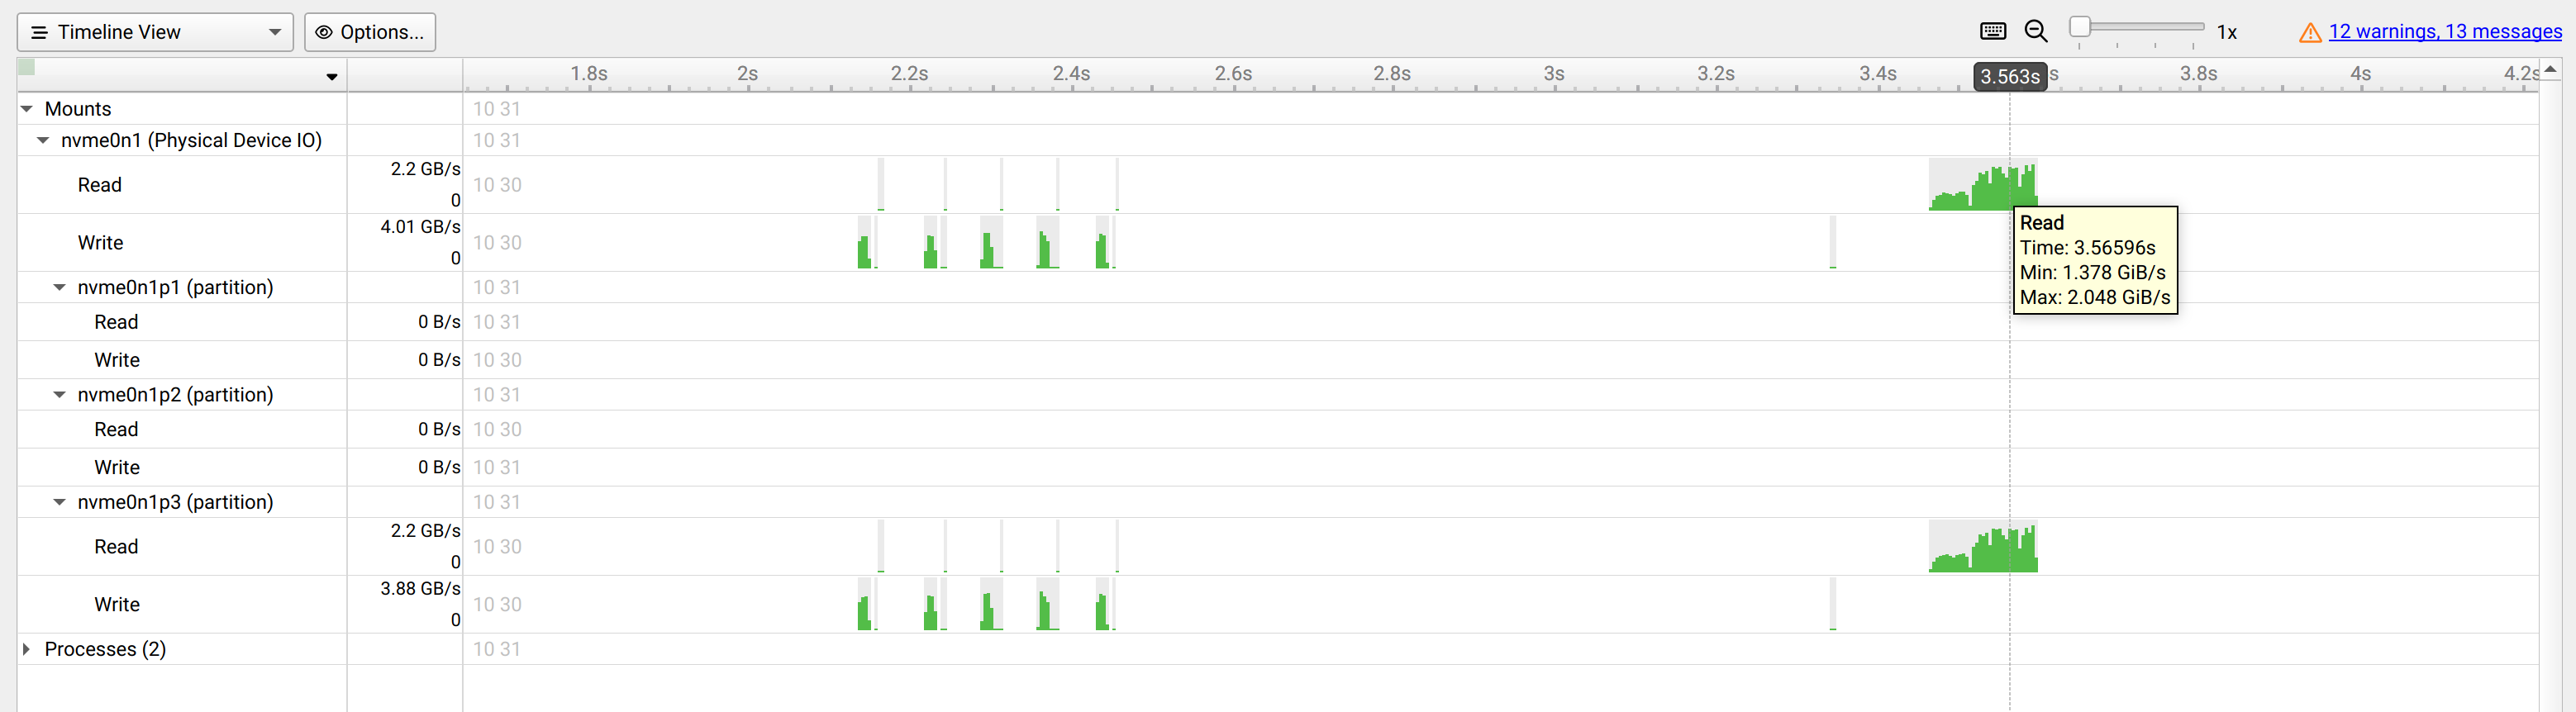
S3 Trace#
Nsight Systems can capture information about Amazon S3 storage operations performed by the profiled process. When S3 tracing is enabled, upload and download activity is recorded on the timeline, along with metadata such as bucket name, object key, bytes transferred, and operation result.
In addition, Nsight Systems aggregates S3 trace events to produce per-process statistics including upload and download throughput and average transfer sizes.
S3 trace is available on Linux targets only.
The following S3 client libraries are supported:
AWS CRT — Native C/C++ applications (or higher-level SDKs) that use the AWS Common Runtime S3 client (
aws-c-s3). Nsight Systems traces S3 upload and download request operations, and the individual HTTP transactions within each request.Note
Requires aws-c-s3 version 0.9.3 or newer for tracing S3 operations. HTTP transaction tracing requires aws-c-s3 version 0.10.0 or newer. The profiled process must also dynamically link with the CRT library.
AWS CPP SDK — C++ applications that use the AWS C++ SDK (
aws-cpp-sdk) for S3 operations can be traced. Nsight Systems traces both the S3 Client and the S3Crt Client.Note
Tracing S3Client requires aws-cpp-sdk version 1.11.0 or newer. Tracing S3CrtClient also requires aws-c-s3 version 0.9.3 or newer (bundled in aws-cpp-sdk version 1.11.715 or newer).
The profiled process must dynamically link with the CPP SDK library.
Boto3 — Python applications that use the
boto3library for S3 operations can be traced. The following operations are traced across Client, Bucket, and Object S3 resource types:upload_file download_file upload_fileobj download_fileobj put_object get_object head_object upload_part create_multipart_upload abort_multipart_upload generate_presigned_url generate_presigned_post
S3TorchConnector — Python applications that use the
s3torchconnectorlibrary for PyTorch dataset access over S3 (e.g.,S3IterableDataset,S3MapDataset, Checkpoint and direct reader/writer operations).Tensorflow-io — Python applications that use the
tensorflow-iolibrary to access S3 objects viatf.io.gfile.GFilewiths3://paths.
Usage Example#
Example trace with Boto3:
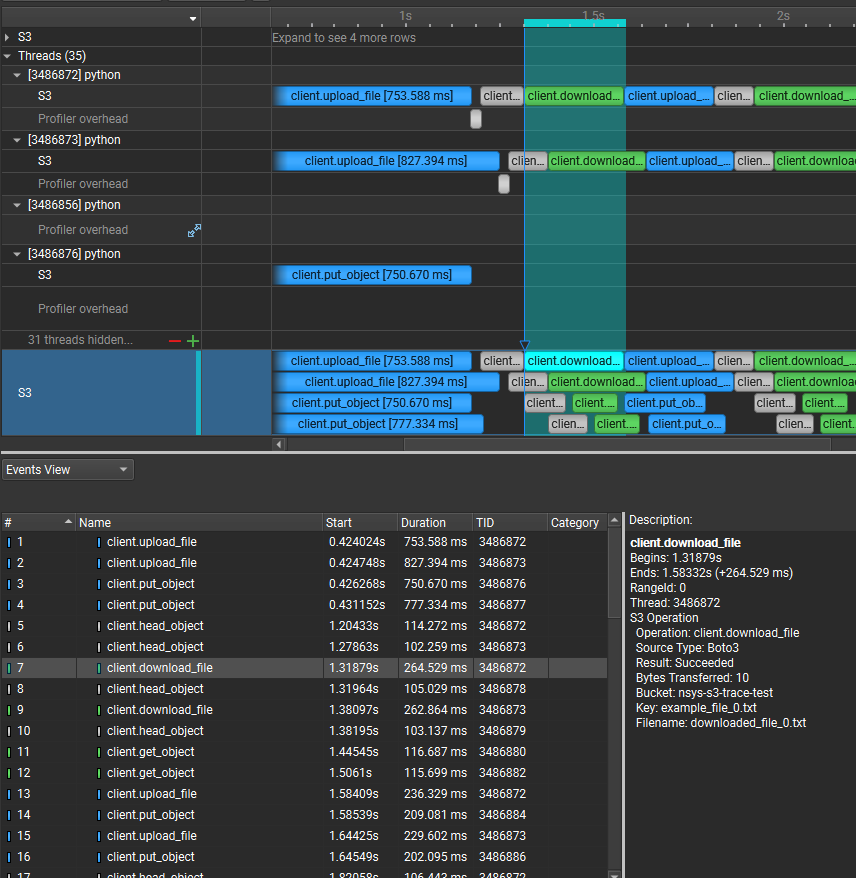
To enable S3 tracing from Nsight Systems:
CLI — Use the -t, --trace option with the s3 or s3-verbose parameter. See Command Line Options for more information.
nsys profile --trace=s3 <application> [application-arguments]
Two levels of detail are available:
--trace=s3— Collects S3 operation ranges, with core attributes, including bytes transferred, bucket name, key name, file path, and result status.--trace=s3-verbose— In addition to everything collected bys3, Nsight Systems will collect additional per-request metadata and breakdown of individual HTTP transactions. This additional data is intended for in-depth low-level analysis of transfer behavior, but may increase trace volume and processing overhead. This mode only affects tracing of AWS CRT, AWS CPP SDK, and Boto3 applications.
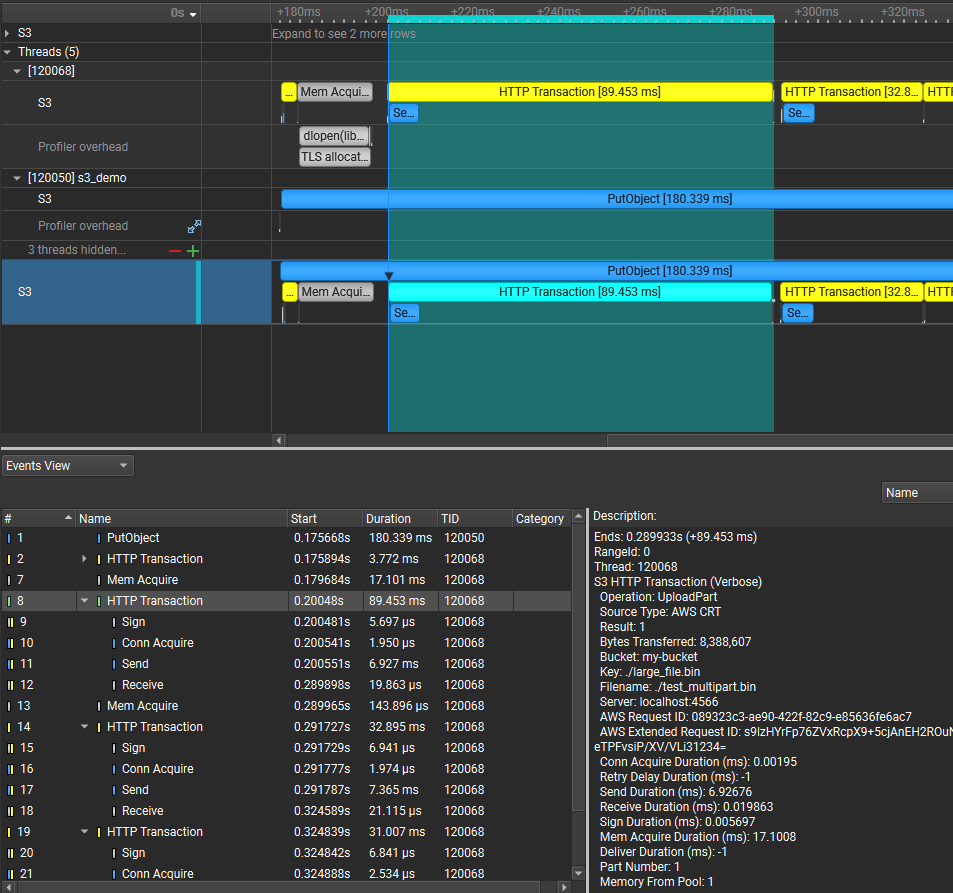
Process Statistics#
When S3 trace data is collected, Nsight Systems aggregates the events from the profiled process to display the following statistics in the timeline:
Download Throughput — Aggregate download throughput over time (bytes/s).
Upload Throughput — Aggregate upload throughput over time (bytes/s).
Avg Download Size — Average file/object size of currently active download operations (bytes).
Avg Upload Size — Average file/object size of currently active upload operations (bytes).
These statistics can help identify periods of high or low S3 activity and reveal bottlenecks in data transfer patterns.
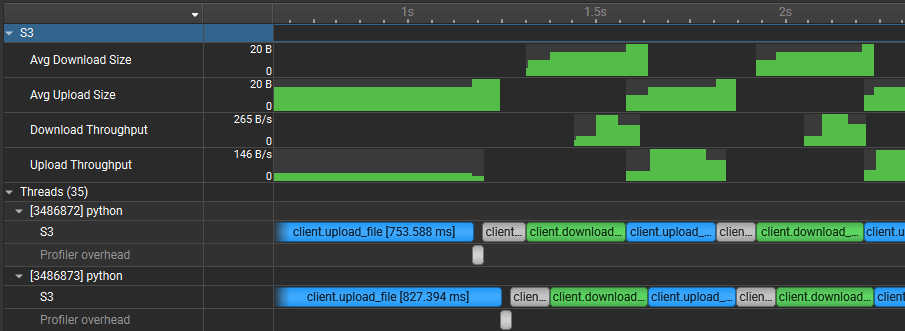
GDS (GPUDirect Storage) Trace#
NVIDIA GPUDirect Storage (GDS) enables direct memory access (DMA) between storage and GPU memory. This avoids a bounce buffer through the CPU, increasing storage access bandwidth and decreasing latency and utilization load on the CPU. Information about GDS can be found at NVIDIA Magnum IO GPUDirect Storage.
Nsight Systems can capture information about GDS, specifically the various cuFile API calls made by the profiled process. GDS profiling is supported on Linux x64 and SBSA operating systems.
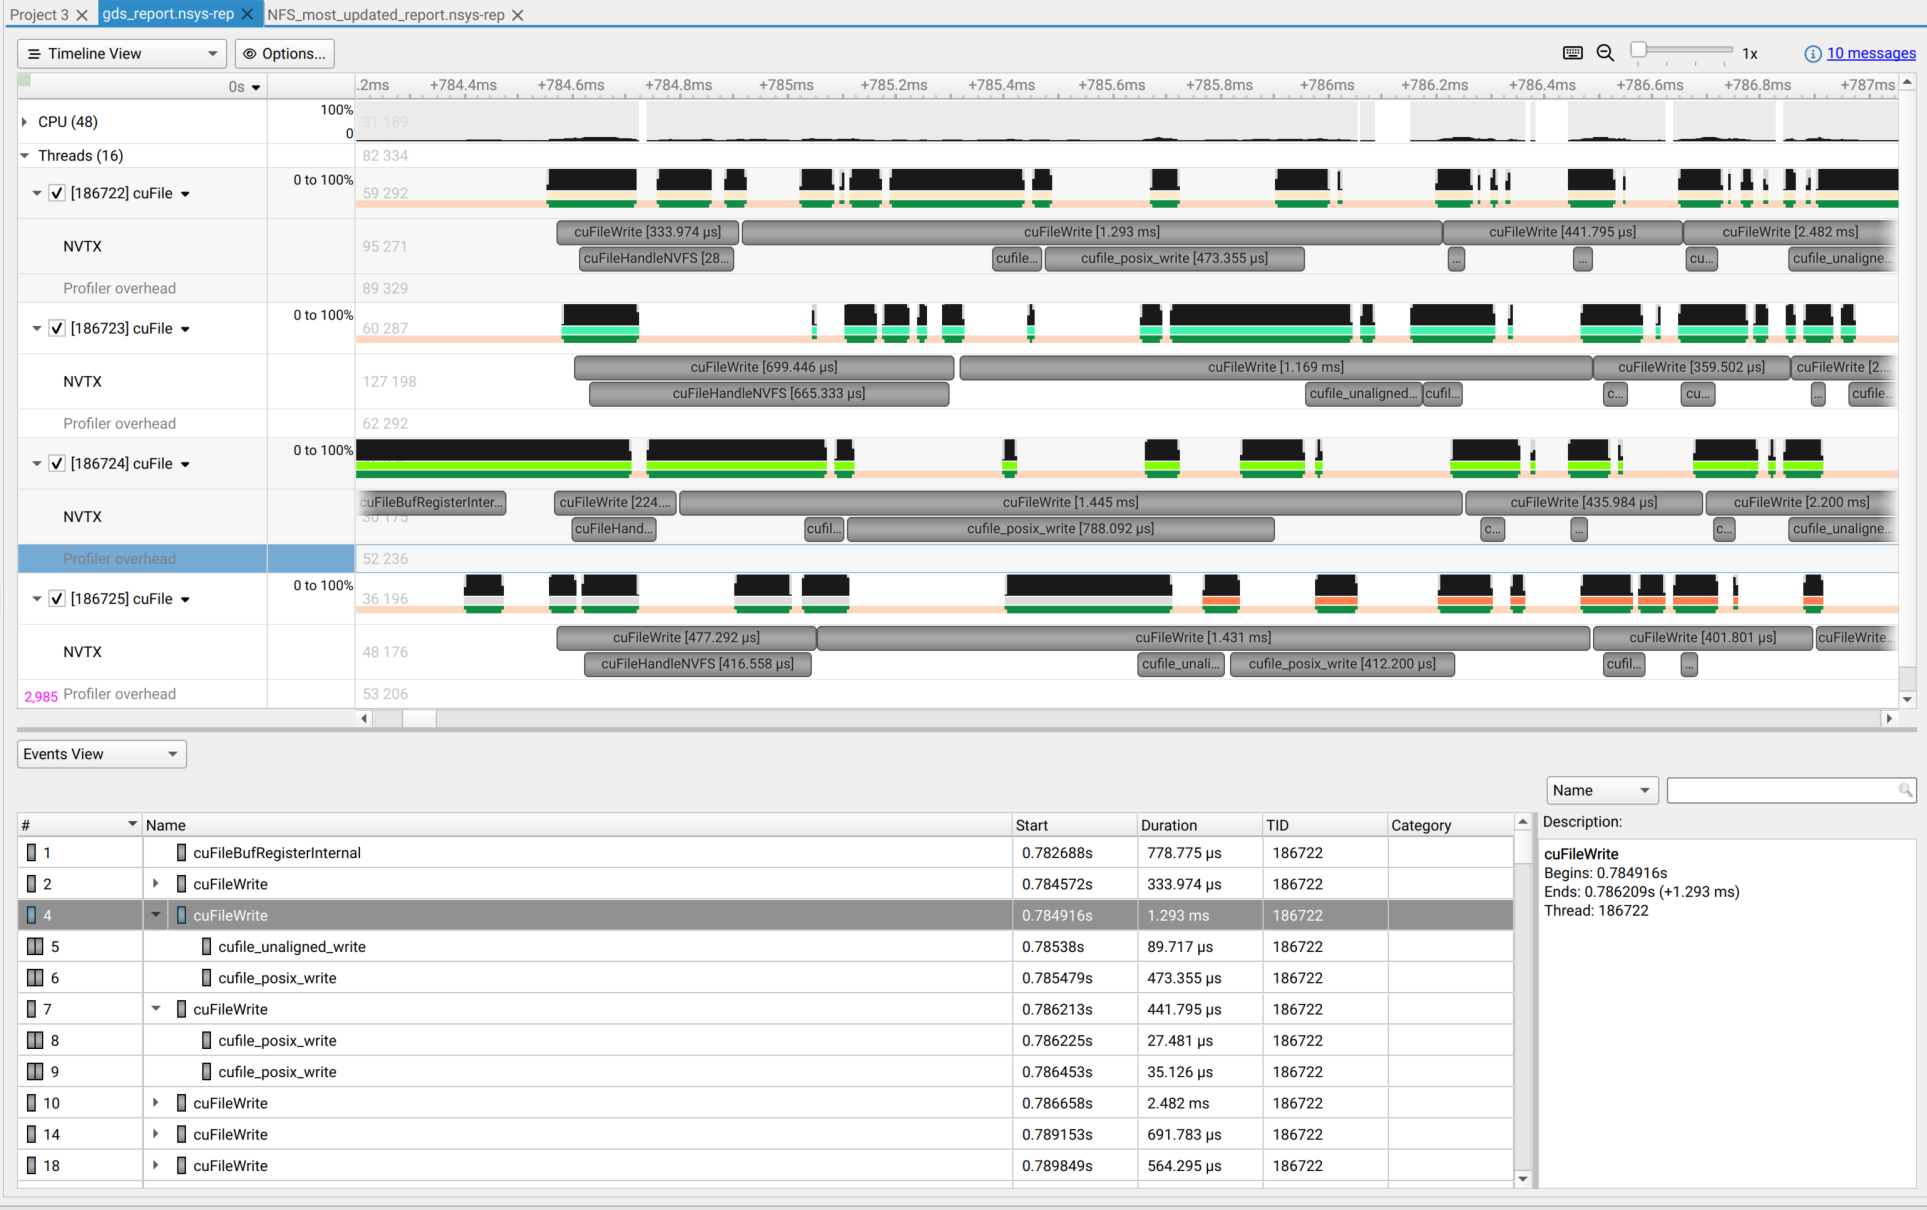
Note
Before collecting GDS metrics, ensure that NVIDIA GPUDirect Storage is installed correctly on your system. For installation instructions, refer to the NVIDIA GPUDirect Storage Installation and Troubleshooting Guide.
You can validate that GDS is installed correctly by running the gdscheck.py tool:
/usr/local/cuda/gds/tools/gdscheck.py -p
The tool should confirm that the intended filesystem type is supported, and that platform verification has passed successfully.
GDS (GPUDirect Storage) Counters#
Nsight Systems can collect GDS user-space metrics from profiled processes. GDS metrics collection is supported on Linux x64 and SBSA operating systems.
Note
This is only supported with GPUDirect Storage v1.16.0 or newer, which is available from CUDA Toolkit v13.1.
Available arguments:
--gds-metrics: Enable GDS (GPUDirect Storage) user-space performance metrics collection.--gds-libs-path=<path>: Specify a directory containing GPUDirect Storage libraries (must contain libcufile.so). Use this argument if the GDS libraries are located in a different path than the default. Default is/usr/local/cuda/lib64. This argument is used together with--gds-metrics.
Usage Example
To profile a process with GDS metrics:
./nsys profile --gds-metrics <target-application>
If your GDS libraries are installed in a custom location:
./nsys profile --gds-metrics --gds-libs-path=/custom/path/to/gds/libs <target-application>
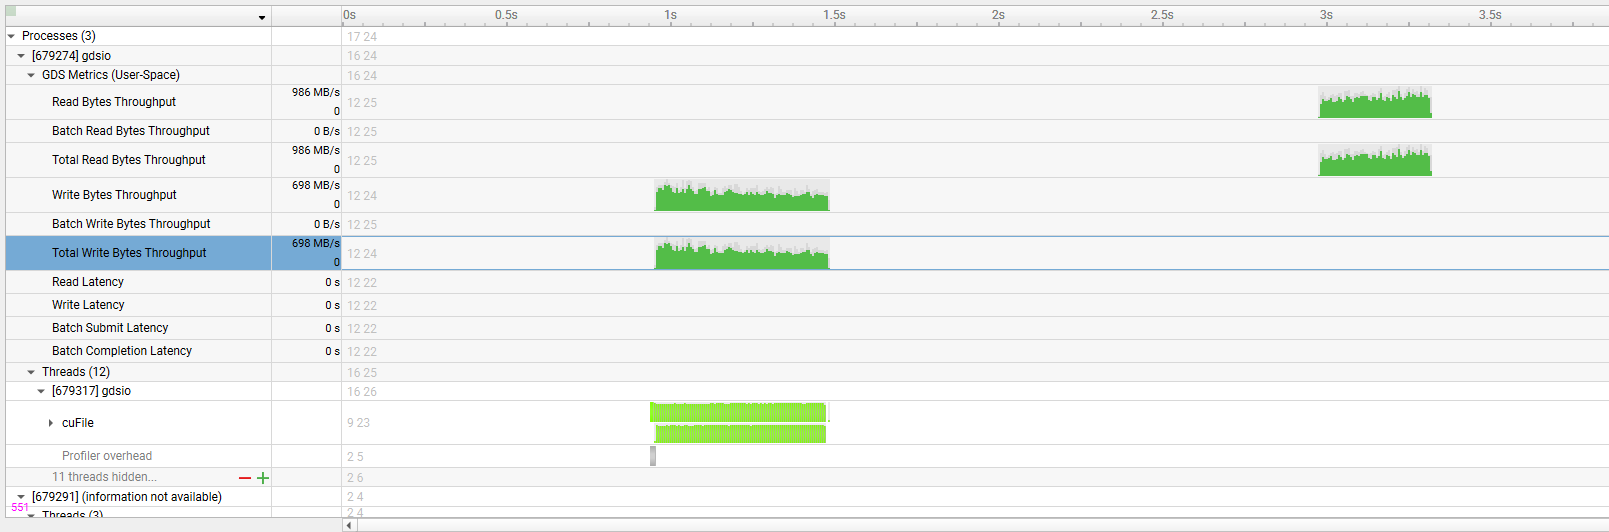
SCADA Metrics Profiling#
NVIDIA SCADA (SCaled Accelerated Data Access) is a storage I/O architecture where GPUs directly initiate and control storage operations, removing CPU involvement from both the control path and the data path. It is optimized for AI workloads that require high-throughput, fine-grained accesses (< 4 KB) from thousands of parallel GPU threads to NVMe storage. A SCADA deployment consists of a client library on the GPU side and a server daemon that manages the NVMe drives.
Nsight Systems can periodically sample performance counters and histograms from a running SCADA server and display them on the timeline in the GUI. This enables developers to monitor SCADA server activity and correlate it with GPU and CPU events.
SCADA metrics profiling is supported on Linux x64 and SBSA operating systems.
Enabling SCADA Metrics Collection#
To enable SCADA metrics collection, add the following option to the
nsys profile or start commands:
--enable scada_metrics[,--sampling-frequency=<value>]
There are no spaces following the scada_metrics plugin name. It is
followed by a comma-separated list of arguments or argument=value pairs.
Note
A SCADA server must be running on the target system before starting
the profiling session. The plugin communicates with the server through
a Unix Domain Socket at /tmp/scada_profiler_socket. If the server
is not running, the plugin will report an error and exit.
Supported arguments are:
Name |
Possible Values |
Default |
Description |
|---|---|---|---|
|
1 – 1000 |
1000 |
Sampling frequency in Hz. Controls how often the plugin requests a new metrics sample from the SCADA server. |
Usage Examples
nsys profile --enable scada_metrics <target-application>Collect SCADA metrics at the default sampling frequency of 1000 Hz.
nsys profile --enable scada_metrics,-s,100 <target-application>Collect SCADA metrics at 100 Hz.
nsys profile --enable scada_metrics,--sampling-frequency=10 <target-application>Collect SCADA metrics at 10 Hz (one sample every 100 ms).
For general information on Nsight Systems plugins please refer to Nsight Systems Plugins system.
Viewing SCADA Metrics in the Report#
In the report file, under Timeline view, SCADA metrics appear in the SCADA Metrics section. Each counter is plotted as a time-series graph and each histogram is displayed with its bucketed distribution over time.
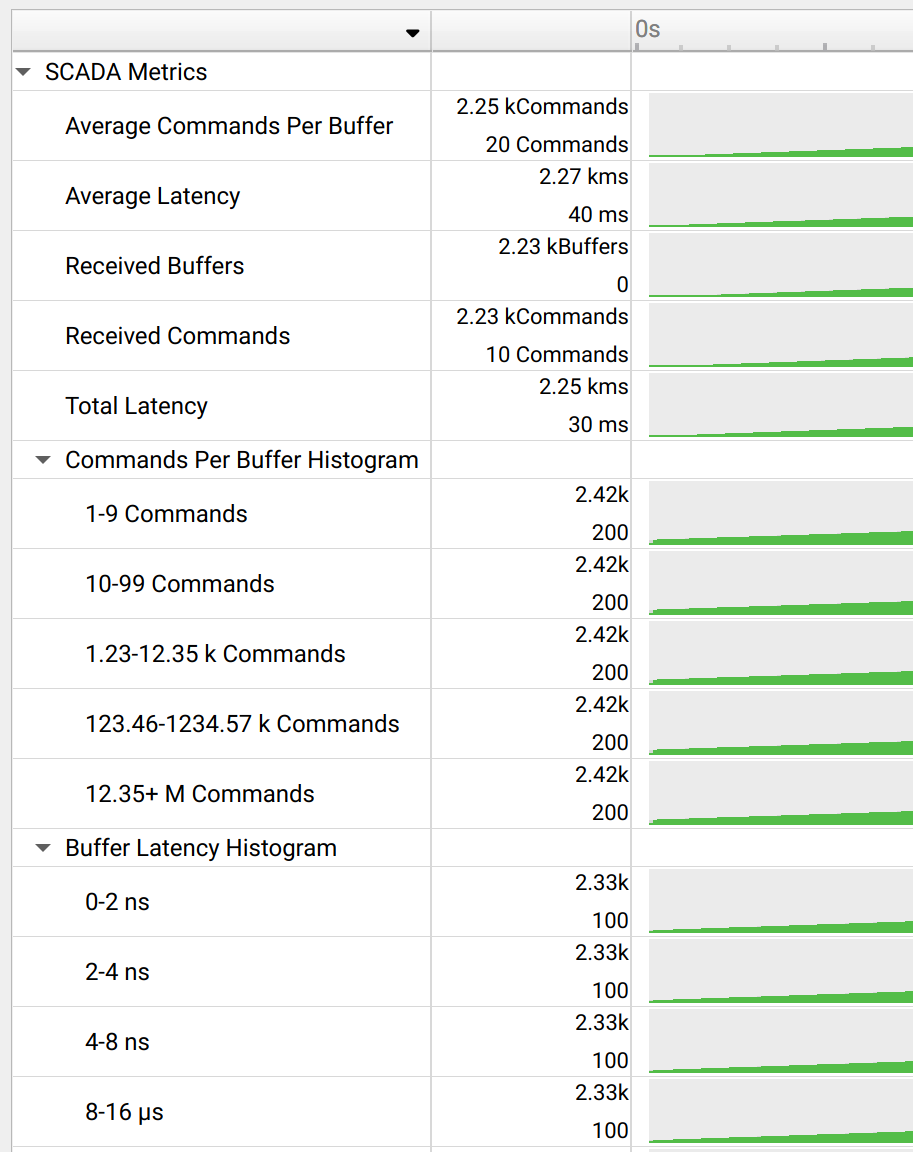
The stdout and stderr log files for the SCADA metrics collection
process can be viewed under the Files section, which may assist in
debugging connectivity or sampling issues.
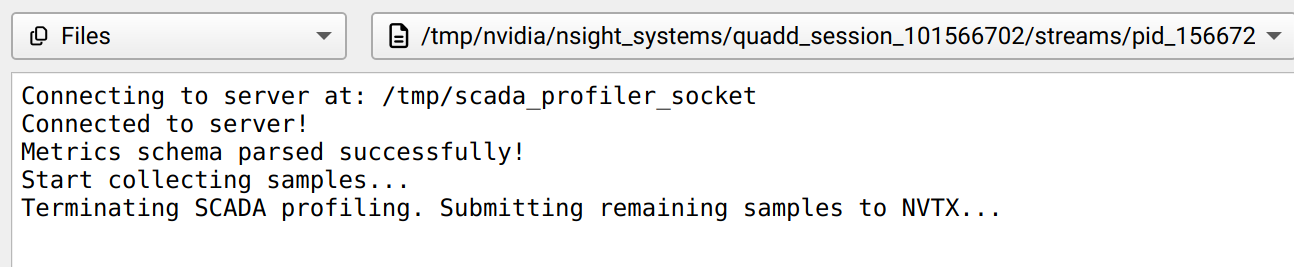
Available Metrics#
The specific metrics collected by the plugin are determined entirely by the SCADA server. At the start of each profiling session, the plugin fetches a metrics schema from the server that describes the available metrics — their names, units, and histogram bin definitions. Different SCADA server configurations may expose different sets of metrics.
There are two types of metrics:
Counters — Scalar values sampled at each collection interval (e.g. total received buffers, average latency). Each counter is plotted as a time-series graph on the timeline.
Histograms — Distribution metrics with predefined bins (e.g. latency distribution, commands-per-buffer distribution). Each histogram is displayed with its bucketed distribution over time.
The following screenshots show example metrics from a particular server configuration:
Counters
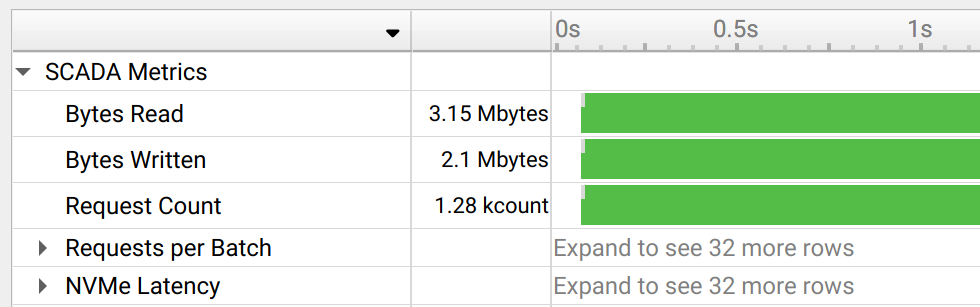
Histograms
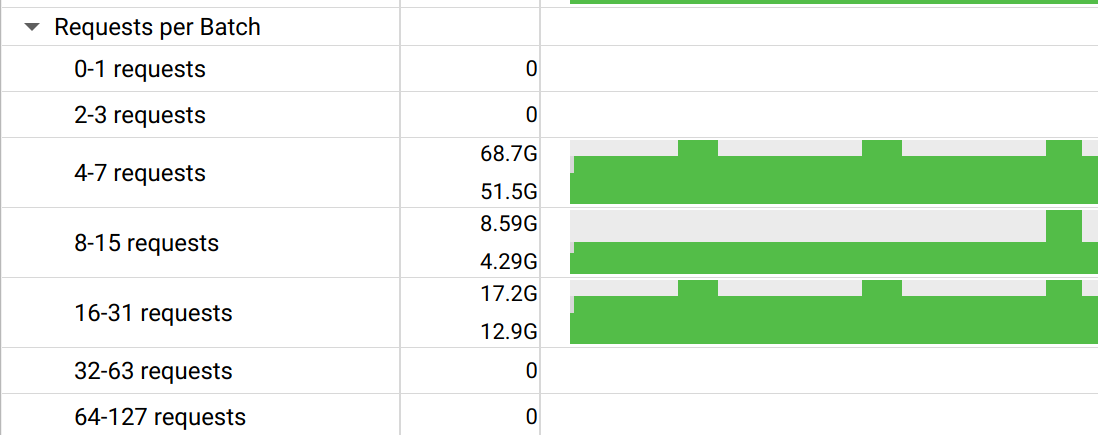
Python Profiling#
Nsight Systems has several features that have been added in the last few years to enhance users optimizing their python code.
Note
You may find that all of your python application output comes at the end of the run instead of as events happen.
Python will change the buffering of stdout depending on whether it points to
a tty or something else. Nsight Systems redirects the application stdout to
a pipe to demultiplex stdout to both a file and the terminal. As a side
effect, it makes Python change stdout buffering from line-buffered to
page-buffered. You can use python -u option or the PYTHONUNBUFFERED
environment variable to override this behavior.
Python Backtrace Sampling#
Nsight Systems for Arm server (SBSA) platforms, x86 Linux and Windows targets, is capable of periodically capturing Python backtrace information. This functionality is available when tracing Python interpreters of version 3.9 or later. Capturing Python backtrace is done in periodic samples, in a selected frequency ranging from 1Hz - 2KHz with a default value of 1KHz. Note that this feature provides meaningful backtraces for Python processes, when profiling Python-only workflows, consider disabling the CPU sampling option to reduce overhead.
In Nsight Systems GUI, Python backtrace sampling is visualized similar to CPU backtrace sampling. See also Visualizing CPU Profiling Results.
To enable Python backtrace sampling from Nsight Systems:
CLI — Set --python-sampling=true and use the --python-sampling-frequency option to set the sampling rate.
GUI — Select the Collect Python backtrace samples checkbox.
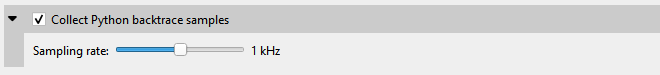
Example screenshot:
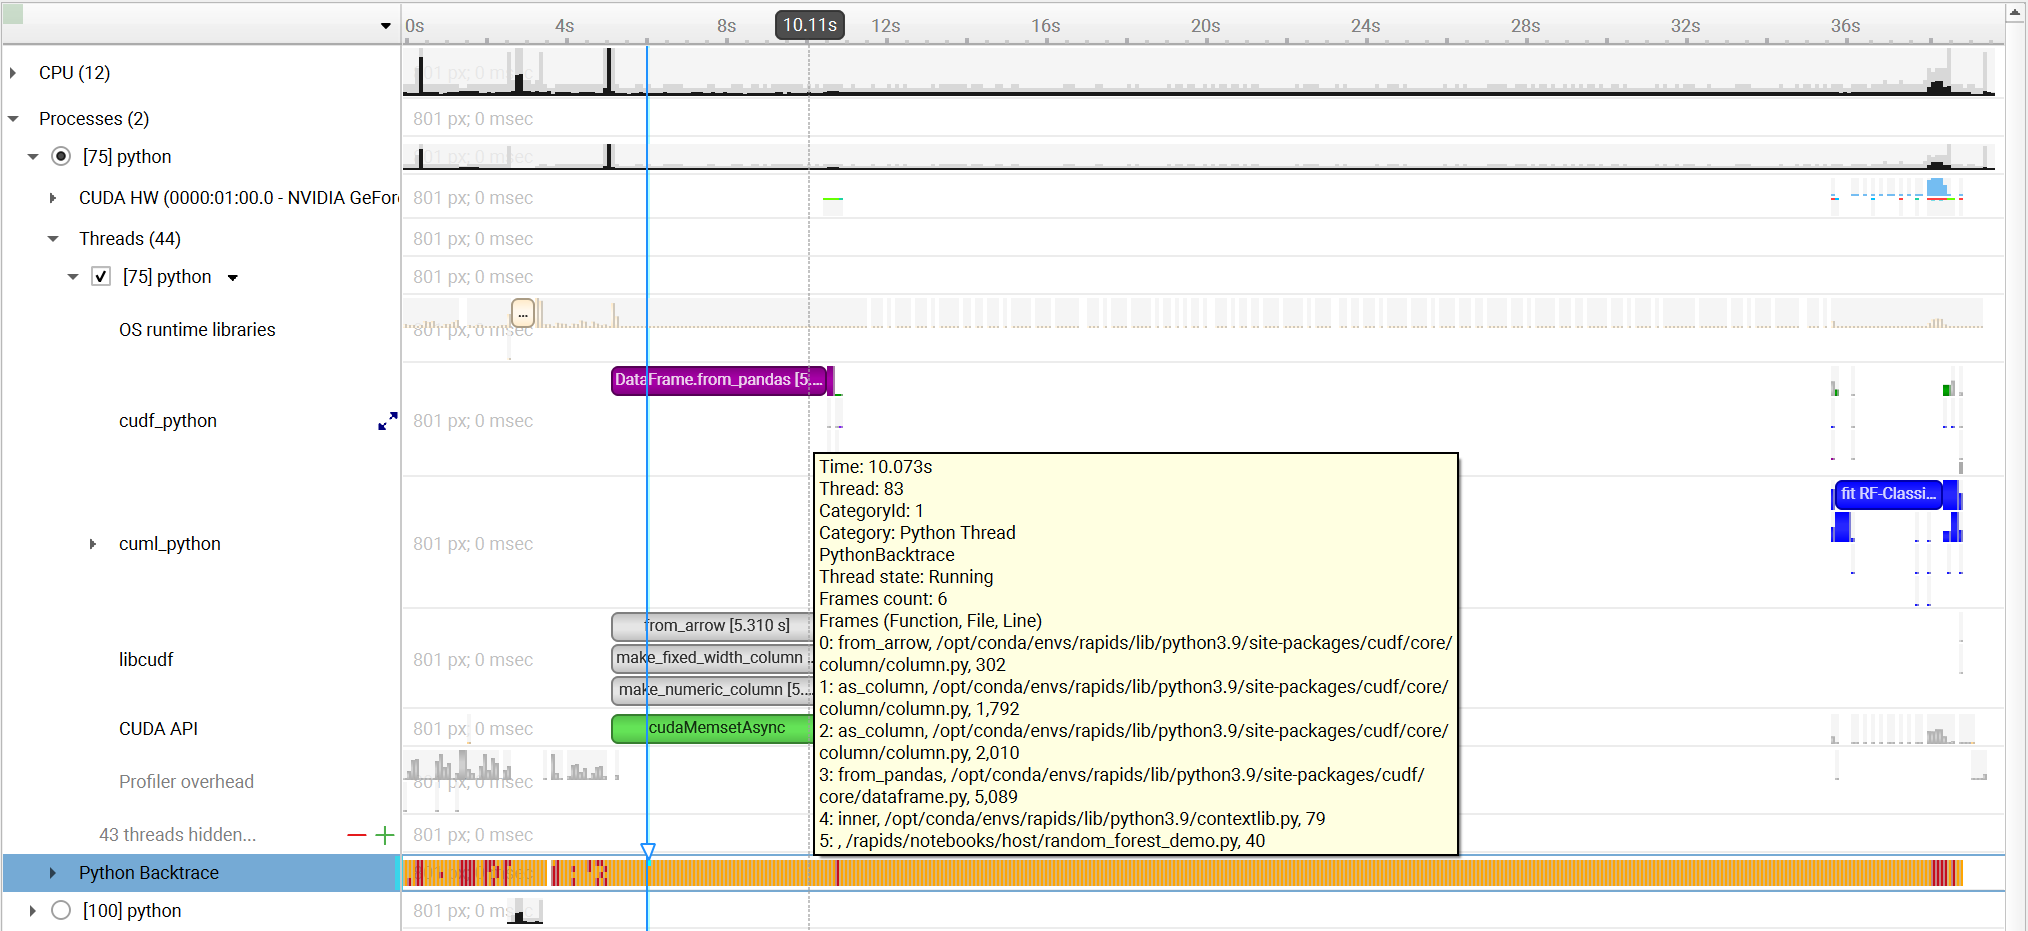
Python Functions Trace#
Nsight Systems for Arm server (SBSA) platforms, x86 Linux and Windows targets, is capable of using NVTX to annotate Python functions.
The Python source code does not require any changes. This feature requires CPython interpreter, release 3.8 or later.
The annotations are configured in a JSON file. An example file is located in Nsight Systems installation folder in <target-platform-folder>/PythonFunctionsTrace/annotations.json.
For PyTorch applications, Nsight Systems provides a predefined annotations file located in <target-platform-folder>/PythonFunctionsTrace/pytorch.json.
For Dask applications, Nsight Systems provides a predefined annotations file located in <target-platform-folder>/PythonFunctionsTrace/dask.json.
Note
Annotating a function from the module __main__ is not supported.
To enable Python functions trace from Nsight Systems:
CLI — Set --python-functions-trace=<json_file>.
GUI — Select the Python Functions trace checkbox and specify the JSON file.
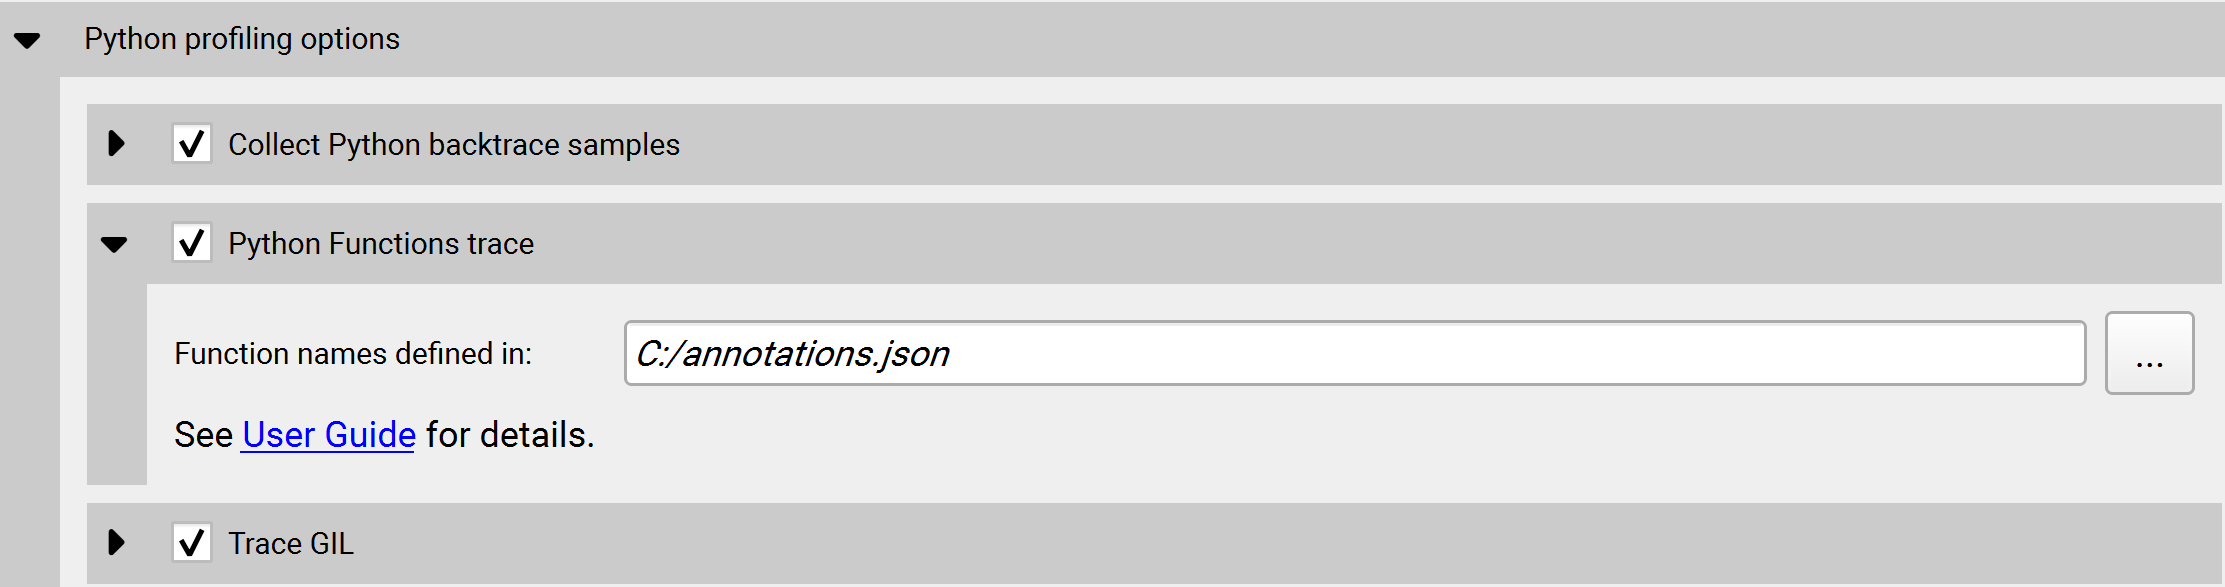
Example screenshot:
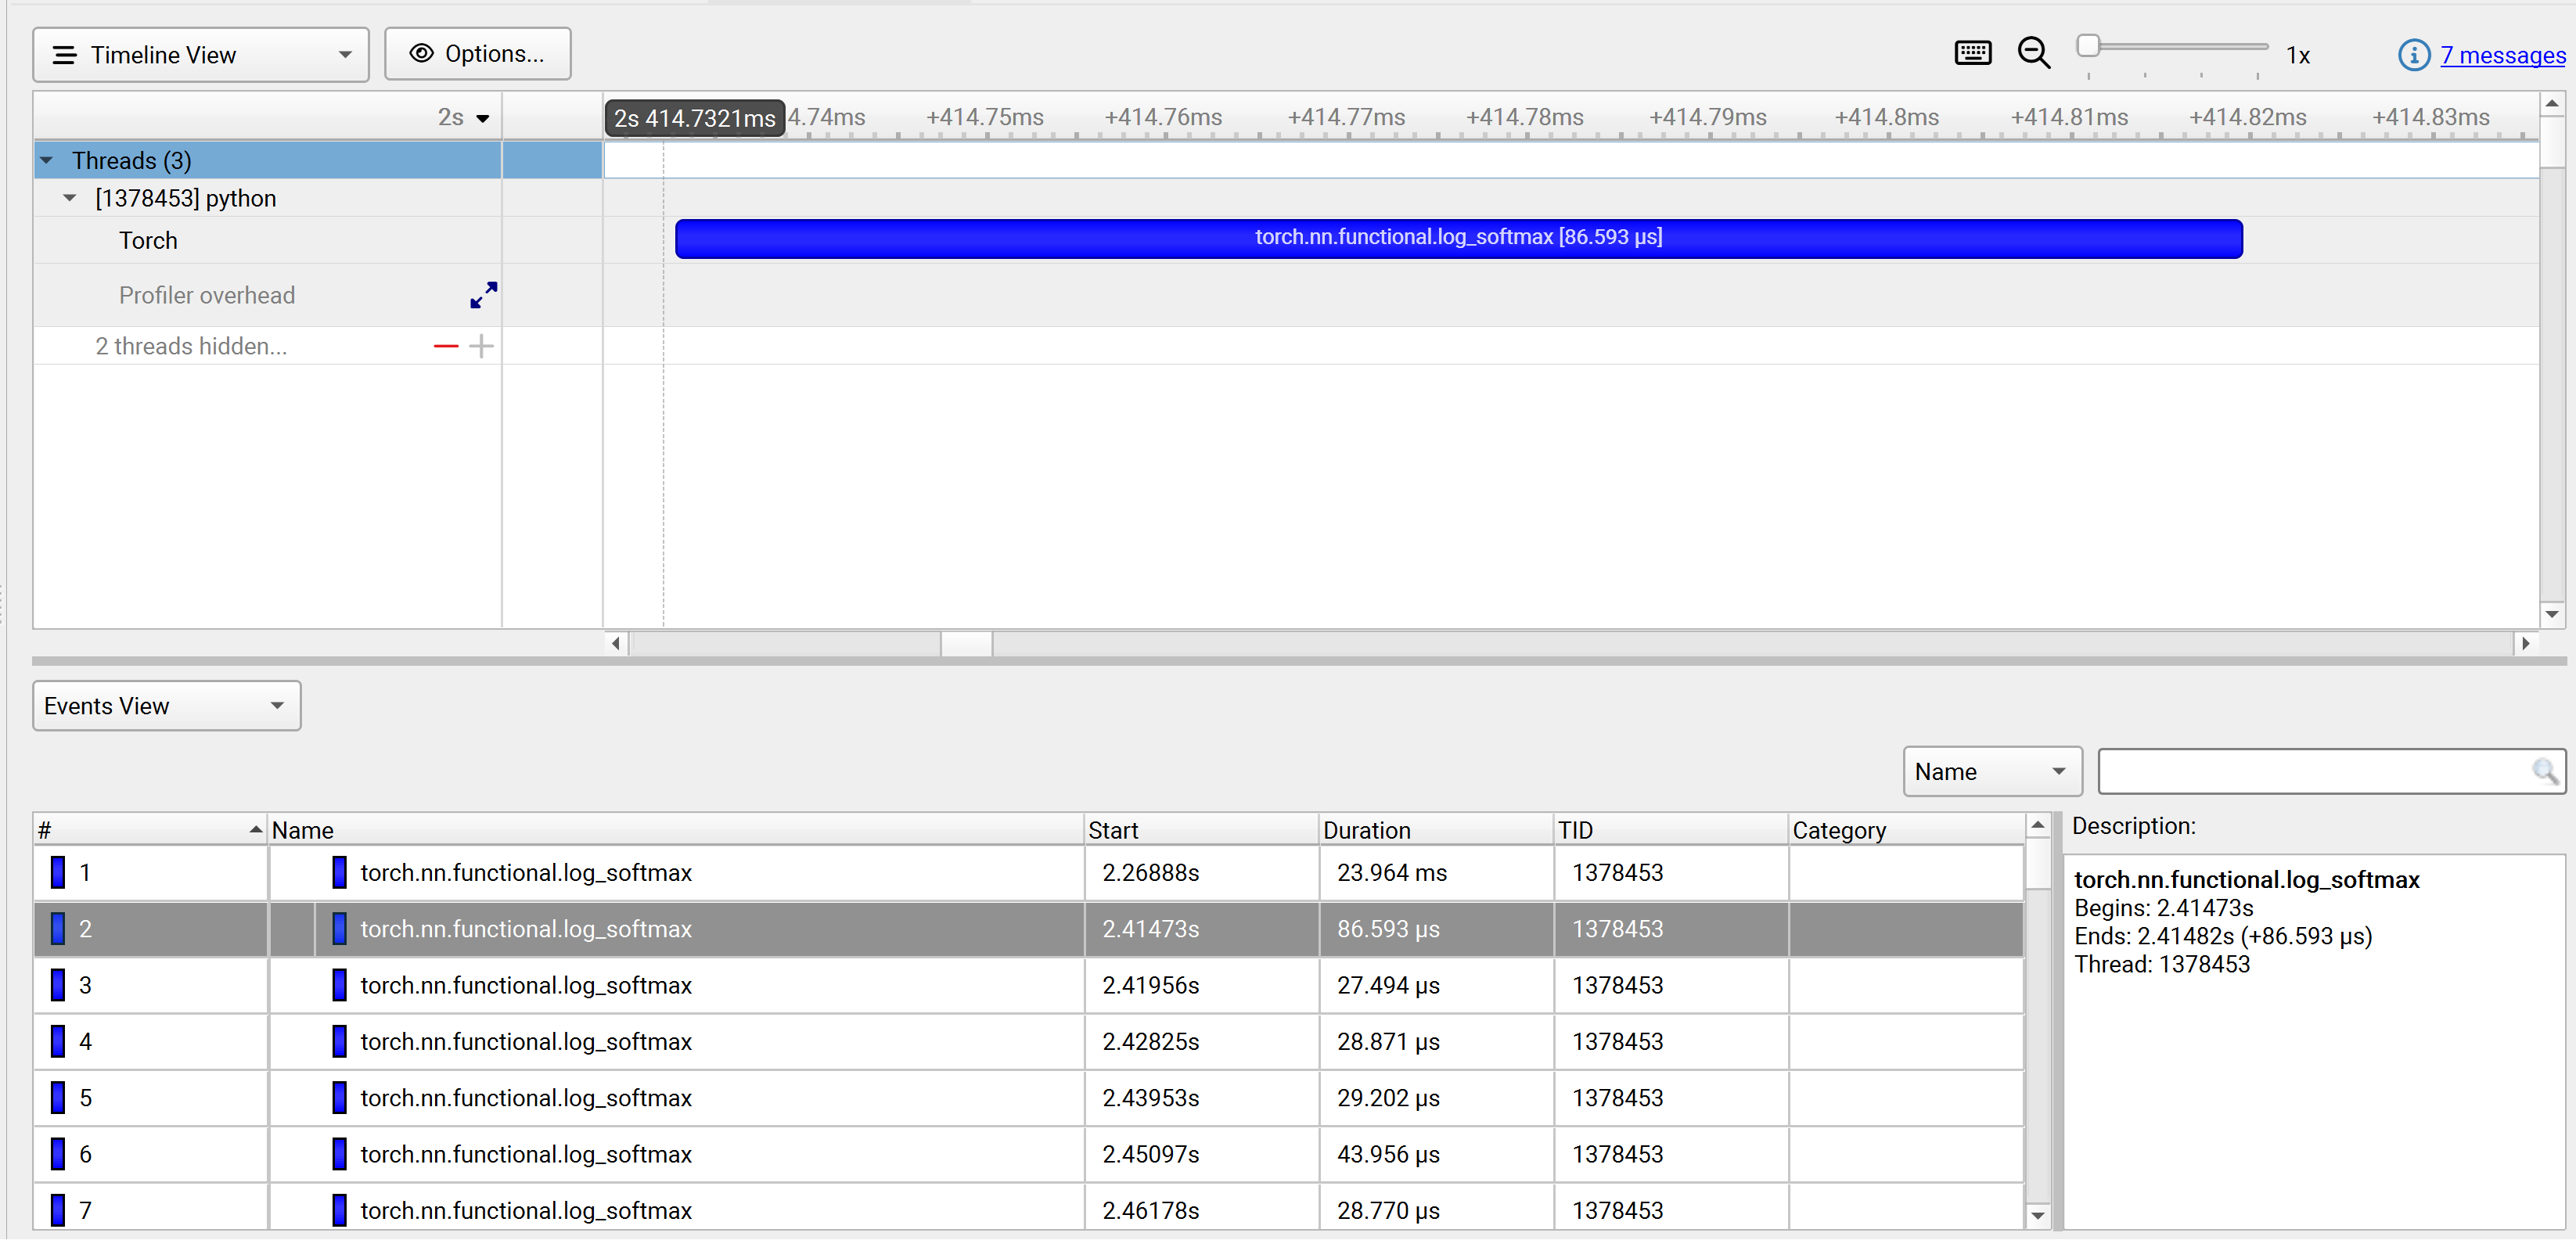
Python GIL Tracing#
Nsight Systems for Arm server (SBSA) platforms, x86 Linux and Windows targets, is capable of tracing when Python threads are waiting to hold and holding the GIL (Global Interpreter Lock).
The Python source code does not require any changes. This feature requires CPython interpreter, release 3.9 or later.
This feature is not supported on Python that was compiled with Py_GIL_DISABLED=1 (See Python documentation for details).
CLI — Set --trace=python-gil.
GUI — Select the Trace GIL checkbox under Python profiling options.
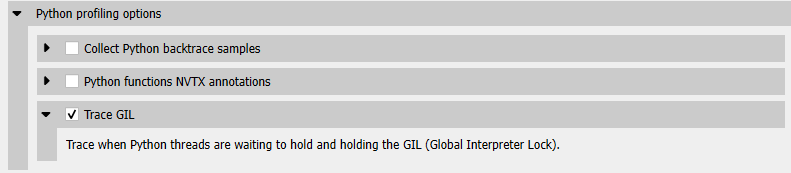
Example screenshot:
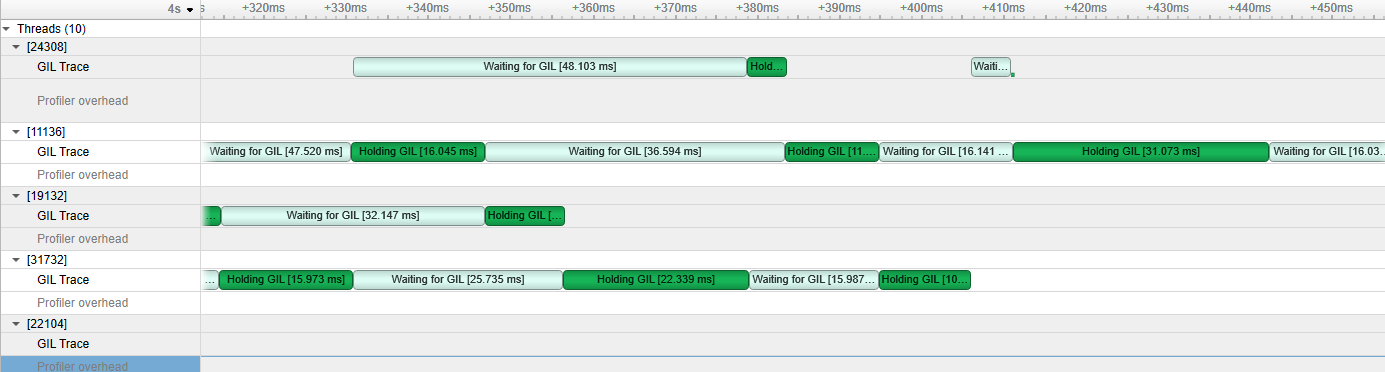
PyTorch Profiling#
Nsight Systems for Arm server (SBSA) platforms, x86 Linux and Windows targets, is capable of automatically annotating common PyTorch operations with execution time ranges.
The Python source code does not require any changes. This feature requires CPython interpreter, release 3.8 or later.
To enable PyTorch autograd nvtx, run Nsight Systems from the CLI using the --pytorch option:
Set --pytorch=autograd-nvtx for enabling torch.autograd.profiler.emit_nvtx(record_shapes=False) or --pytorch=autograd-shapes-nvtx for enabling torch.autograd.profiler.emit_nvtx(record_shapes=True) (implies --trace=nvtx).
Set --pytorch=functions-trace for automatically annotating
PyTorch operations like forward operations,
backward operations,
step operations, etc.
with execution time ranges.
Set --pytorch=functions-trace-shapes to attach additional data to each annotated range,
such as tensor shapes, training parameters, etc.
functions-trace and functions-trace-shapes are mutually exclusive.
Both --pytorch=functions-trace and --pytorch=functions-trace-shapes imply --python-functions-trace=<nsys_install_dir>/<target-arch>/PythonFunctionsTrace/pytorch.json.
autograd-nvtx and autograd-shapes-nvtx options can be combined with functions-trace or functions-trace-shapes by adding them separated by a comma.
When profiling a vLLM application,
the functions-trace option also automatically annotates vLLM-specific methods
such as AsyncLLM.generate(), Worker.execute_model(), and Worker.sample_tokens()
under a dedicated vLLM NVTX domain. These annotations include correlated request IDs
for tracking individual requests across the inference pipeline.
Example screenshots:
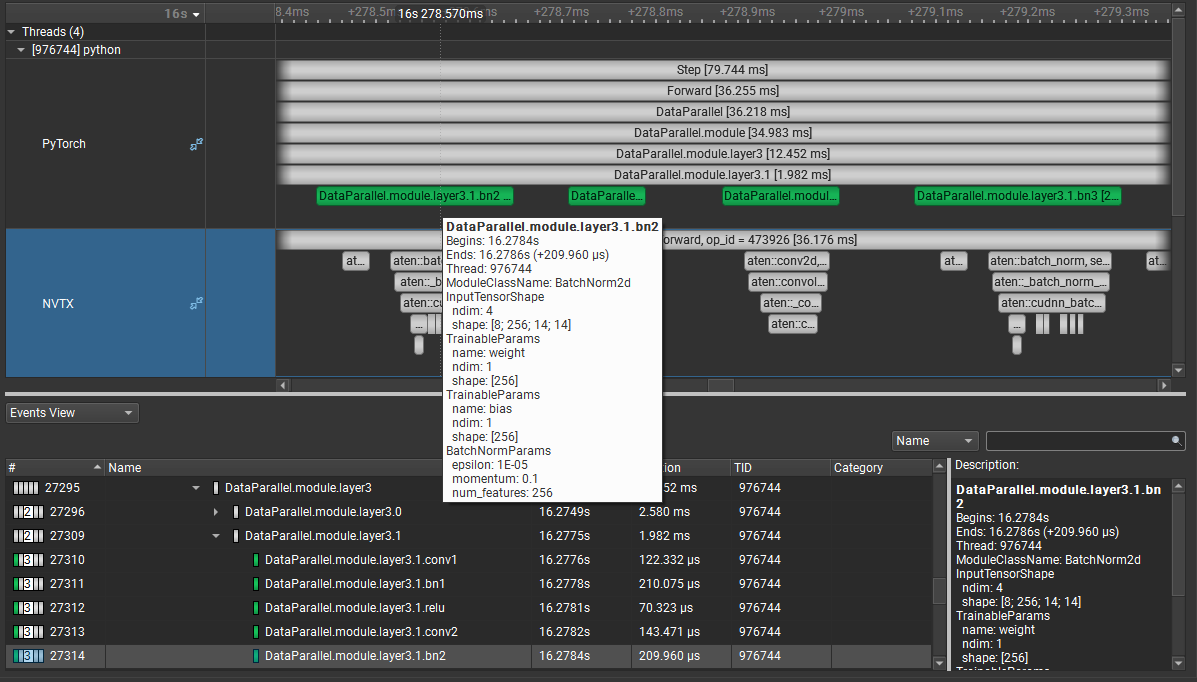
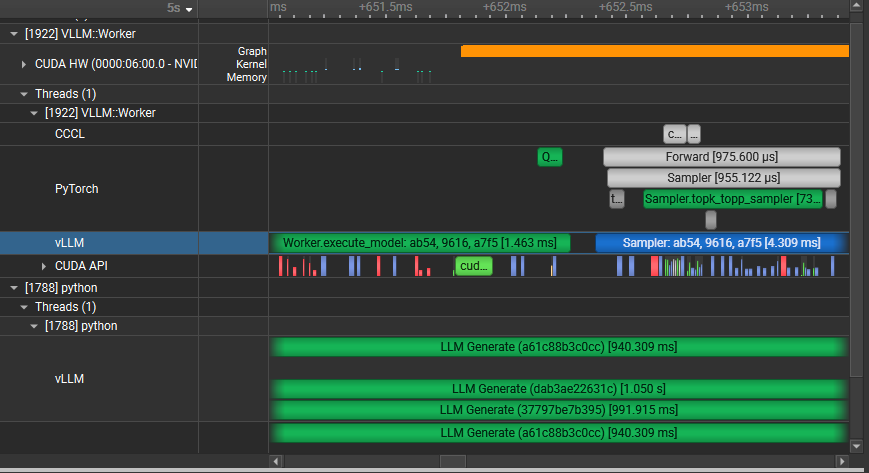
Dask Profiling#
Nsight Systems for Arm server (SBSA) platforms, x86 Linux and Windows targets, is capable of automatically annotating common Dask functions with execution time ranges.
The Python source code does not require any changes. This feature requires CPython interpreter, release 3.8 or later.
Set --dask=functions-trace for enabling Dask functions trace. This option sets --python-functions-trace=<nsys_install_dir>/<target-arch>/PythonFunctionsTrace/dask.json and will rename relevant threads to ‘Dask Worker’ and ‘Dask Scheduler’.
dask.json can be modified to include additional functions to be traced from any Python module.
Example screenshot:
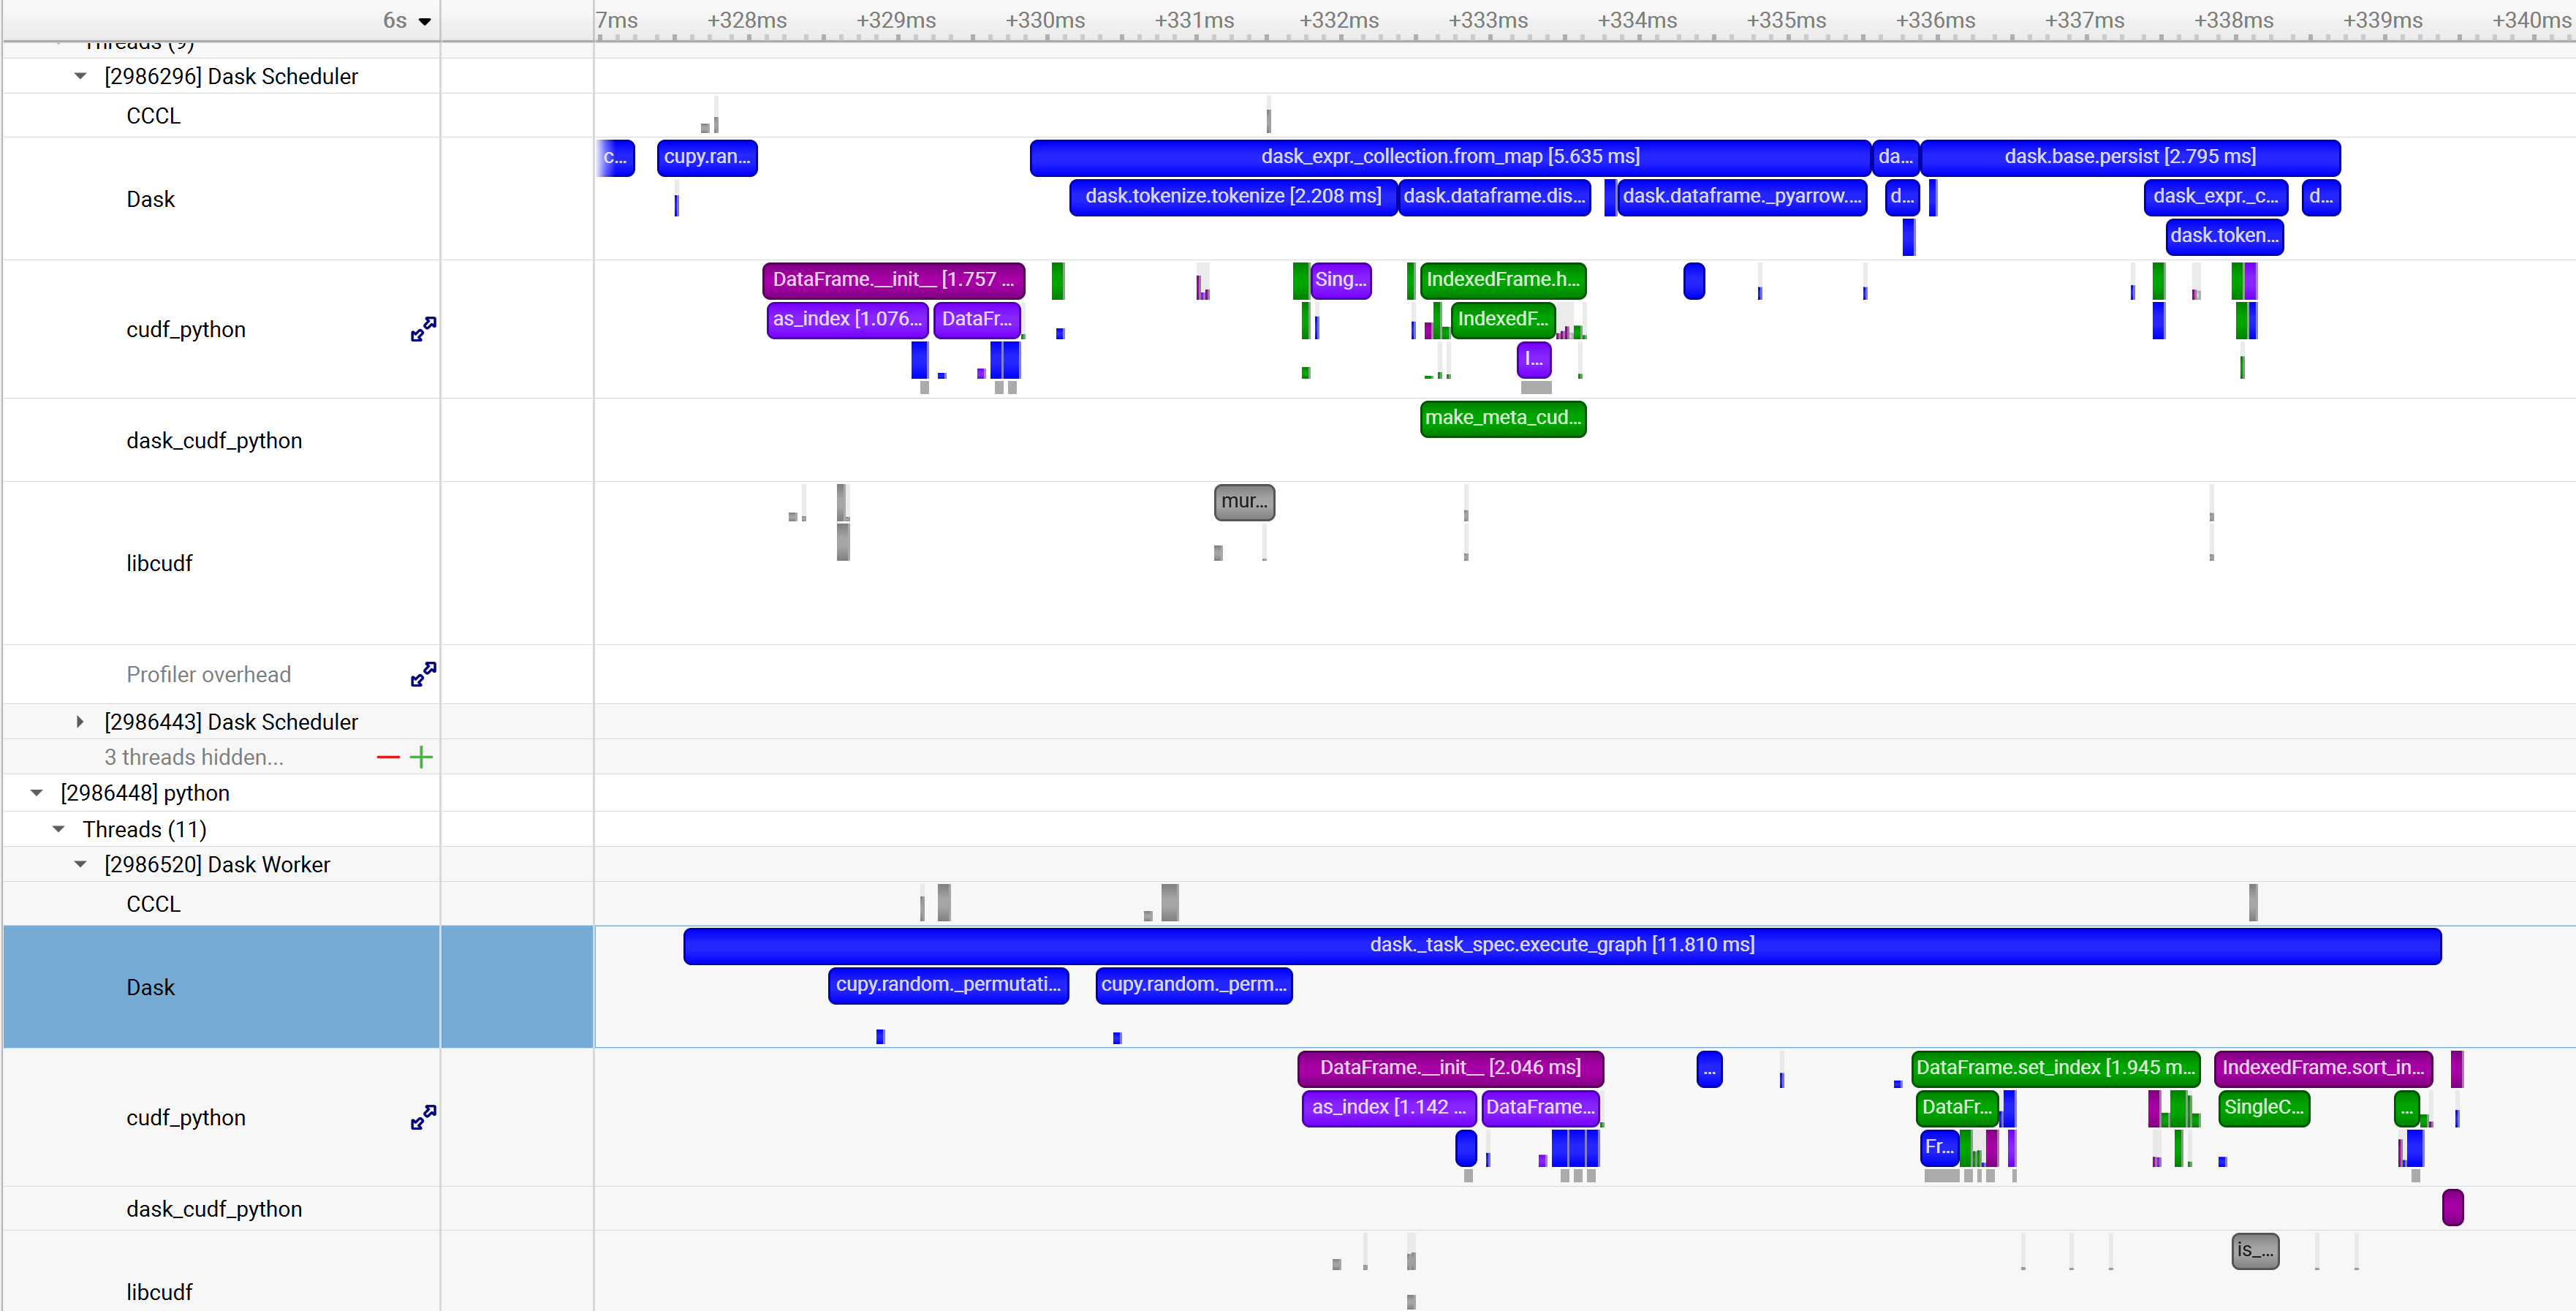
Profiling with DRIVE Hypervisor#
Nsight Systems and DRIVE Hypervisor support periodic CPU sampling with call stacks. It works both on DRIVE Linux and QNX.
The call stacks are collected using frame pointers. The Linux kernel, QNX kernel, and user space libraries provided by NVIDIA are compiled with frame pointers. To ensure correct call stacks, we recommend compiling all application code with frame pointer support, using -fno-omit-frame-pointer with GCC, Clang, and QCC.
This is an experimental feature and is expected to change in the future.
The symbols can be resolved both for user space code, and for kernel space code:
In the user space, the Cross-Hypervisor (XHV) sampling events are matched with the CPU thread state trace coming from Linux Perf and QNX Tracelogger. After that, Nsight Systems can know the module filename, and can resolve symbols directly from these files if they are unstripped, or by looking up additional files with symbols. See more details below.
In the kernel space (Linux kernel, QNX kernel, and additional service VMs), the symbols are resolved using the ELF file with symbols specified.
kernel_symbols.jsoninput file specifies the location of this ELF file.
Please follow the steps below to learn how to:
Flash the devkit (these steps are given just as an example, the exact steps might differ in your case).
Copy the necessary files: pct.json, eventlib schema files, and kernel_symbols.json.
Compose kernel_symbols.json to allow resolving symbols in the Linux kernel, QNX kernel, and additional service VMs.
See example CLI commands to collect data.
Known issues:
At the moment, this feature is not compatible with standard CPU sampling on Linux and QNX.
When enabled together, hypervisor trace plus XHV sampling can write too much data into the same eventlib buffers, and the Nsight Systems agent might not be able to keep up with the rate, losing events. If that happens, please disable hypervisor trace events with
--xhv-trace-events=none.
Flashing DRIVE OS QNX/Linux
Log into the NVIDIA GPU Cloud (NGC):
sudo docker login nvcr.io

Username: ``$oauthtoken``
Password: <NGC API key>
Docker command:
sudo docker run --rm --privileged --net host \
    -v /dev/bus/usb:/dev/bus/usb \
    -v /tmp:/drive_flashing \
    -it <docker image>
<docker image> - docker image link.
Examples:
6.0.8.0 QNX:
sudo docker run --rm --privileged --net host \
    -v /dev/bus/usb:/dev/bus/usb \
    -v /tmp:/drive_flashing \
    -it nvcr.io/{MY_NGC_ORG}/driveos-pdk/drive-agx-orin-qnx-aarch64-pdk-build-x86:6.0.8.0-0003
6.0.9.1 QNX:
sudo docker run --rm --privileged --net host \
    -v /dev/bus/usb:/dev/bus/usb \
    -v /tmp:/drive_flashing \
    -it nvcr.io/{MY_NGC_ORG}/driveos-pdk/drive-agx-orin-qnx-aarch64-pdk-build-x86:6.0.9.1-latest
6.0.8.0 Linux:
sudo docker run --rm --privileged --net host \
    -v /dev/bus/usb:/dev/bus/usb \
    -v /tmp:/drive_flashing \
    -it nvcr.io/{MY_NGC_ORG}/driveos-pdk/drive-agx-orin-linux-aarch64-pdk-build-x86:6.0.8.0-0003
Inside of container, flash with flash.py:
cd /drive
./flash.py <aurix> <board>
<board>- target board base name: ‘p3710’ or ‘p3663’.<aurix>- Aurix serial port, for example: /dev/ttyACM1, /dev/ttyUSB1.
Examples:
Firespray p3710:
./flash.py /dev/ttyACM1 p3710
Drive Orin p3663:
./flash.py /dev/ttyUSB1 p3663
List the available EMMC and UFS partitions:
df -h
Format a power-safe file system partition, and mount it, example for vblk_ufs40:
mkqnx6fs /dev/vblk_ufs40 -q
mount -o rw /dev/vblk_ufs40 /
# df -h
/dev/vblk_ufs40             116G      7.5G      108G       7%  /
ifs                          16M       16M         0     100%  /
ifs                          52M       52M         0     100%  /
...
Note
For more information about DRIVE OS installation, see the following link: NVIDIA DRIVE OS Documentation (useful pages: DRIVE OS Linux Installation Guide, DRIVE OS QNX Installation Guide).
Create XHV Directory
Inside of container, examples for p3710, QNX/Linux:
QNX:
cd /drive_flashing
mkdir -p xhv/hypervisor/configs/t234ref-release/pct/qnx xhv/schemas
cp -rv /drive/drive-foundation/virtualization/hypervisor/t23x/configs/t234ref-release/pct/p3710-10-a03/qnx/pct.json ./xhv/hypervisor/configs/t234ref-release/pct/qnx/
cp -rv /drive/drive-foundation/schemas/event ./xhv/schemas/
Linux:
cd /drive_flashing
mkdir -p xhv/hypervisor/configs/t234ref-release/pct/linux xhv/schemas
cp -rv /drive/drive-foundation/virtualization/hypervisor/t23x/configs/t234ref-release/pct/p3710-10-a03/linux/pct.json ./xhv/hypervisor/configs/t234ref-release/pct/linux/
cp -rv /drive/drive-foundation/schemas/event ./xhv/schemas/
Example of XHV directory (Linux):
xhv/
├── hypervisor
│             └── configs
│                 └── t234ref-release
│                     └── pct
│                         └── linux
│                             └── pct.json
└── schemas
    └── event
        ├── audioserver_events.json
        ├── bpmp_events.json
        ├── cem_events.json
        ├── hv_events.json
        ├── i2c_events.json
        ├── Makefile.gen-event-headers.tmk
        ├── monitor_events.json
        ├── se_events.json
        ├── sysmgr_events.json
        └── vsc_events.json
Copy XHV directory to target:
scp -r xhv <user>@<target-IP>
eventlib_dump tool (QNX/Linux):
cp -rv /drive/drive-qnx/nvidia-bsp/aarch64le/sbin/eventlib_dump /drive_flashing/
cp -rv /drive/drive-linux/filesystem/contents/bin/eventlib_dump /drive_flashing/
Specific Command Line Options
Option |
Possible Parameters |
Default |
Switch Description |
|---|---|---|---|
|
process-tree, system-wide, xhv, xhv-system-wide, none |
process-tree |
Select ‘xhv’ or ‘xhv-system-wide’ to enable Cross-Hypervisor (XHV) sampling, requires root privileges. |
|
< filepath kernel_symbols.json > |
none |
XHV sampling config (optional, for kernel symbols). |
|
< filepath pct.json > |
none |
Collect hypervisor trace. |
|
all, none, core, sched, irq, trap |
all |
HV trace events. |
Examples:
nsys profile --sample=xhv --trace=nvtx,osrt,cuda --xhv-vm-symbols=/root/kernel_symbols.json --xhv-trace=/root/xhv/hypervisor/configs/p3710-10-a01/pct/qnx/pct.json --xhv-trace-events=none sleep 5
nsys profile --sample=xhv-system-wide --xhv-vm-symbols=/root/kernel_symbols.json --xhv-trace=/root/xhv/hypervisor/configs/p3710-10-a01/pct/qnx/pct.json --xhv-trace-events=none sleep 5
Example screenshot:
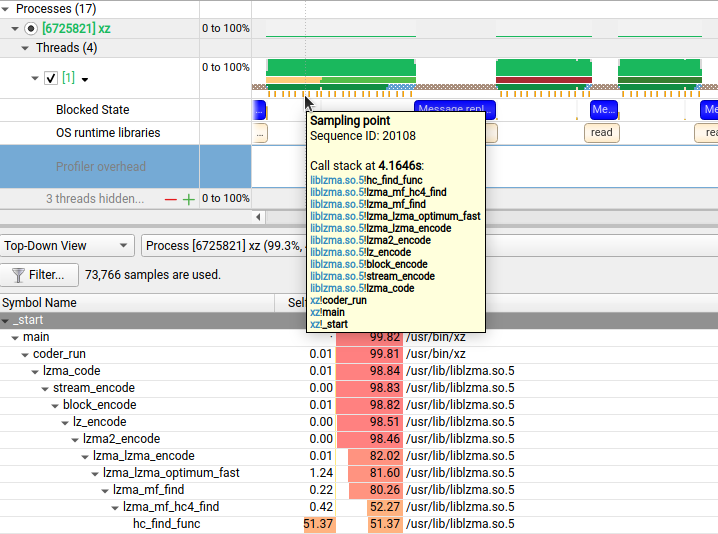
Config File (for kernel symbols)
Examples:
QNX, kernel_symbols.json file:
{
    "guest_cfg": [
        {
            "guest_id": 0,
            "guest_name": "Guest VM 0",
            "symbols": "/root/symbols/procnto-smp-instr-safety.guest_vm.bin.sym"
        },
        {
            "guest_id": 1,
            "guest_name": "Update service",
            "symbols": "/root/symbols/procnto-smp-instr-safety.update_vm.bin.sym"
        },
        {
            "guest_id": 2,
            "guest_name": "Resource Manager Server"
        },
        {
            "guest_id": 3,
            "guest_name": "Storage Server"
        },
        {
            "guest_id": 4,
            "guest_name": "Ethernet Server"
        },
        {
            "guest_id": 5,
            "guest_name": "Debug Server"
        }
    ],
    "symbol_files": {
        "Sidekick": "/root/symbols/sidekick.unstripped"
    }
}
Linux, kernel_symbols.json file:
{
    "guest_cfg": [
        {
            "guest_id": 0,
            "guest_name": "Guest VM 0",
            "symbols": "/home/nvidia/vmlinux"
        },
        {
            "guest_id": 1,
            "guest_name": "Update service"
        }
    ],
    "symbol_files": {
    }
}
Symbol Files
The list of directories with symbol files:
CLI:
DbgFileSearchPathconfig option, for example:DbgFileSearchPath="/lib:/root/symbols"- list of directories with symbol/debug files. On Linux, the default path is/usr/lib/debug. On QNX, there is no default path.Example:
NSYS_CONFIG_DIRECTIVES='DbgFileSearchPath="/lib:/root/symbols"' nsys profile --sample=xhv --xhv-vm-symbols=/root/kernel_symbols.json --xhv-trace=/root/xhv/hypervisor/configs/p3710-10-a01/pct/qnx/pct.json --xhv-trace-events=none sleep 5
GUI:
Symbol locationbutton.
The search is non-recursive.
There are several ways of searching for symbol files - Nsight Systems tries them sequentially for each target file:
Build-id debug files (CLI only)
<symbol directory>/.build-id/… - directories with debug files (or links to debug files).
Example:
.build-id/
├── 00
     └── 6627b119cc2aee77e10e0535fc243fce8fe66e.debug
├── 01
     ├── 3e4007e3cb24359203fc02b63bb90f16db5b23.debug
     └── fb938bc0f029c41a8e1e88f01f88f75cf3a0d3.debug
...
Debuglink files (CLI only)
<symbol directory>/<symbol file> - both filename and CRC from debuglink section must be matched for the symbol file.
File name and build-id (CLI/GUI)
<symbol directory>/<symbol file> - by filename and build-id.
XHV profiling from the GUI
XHV options:
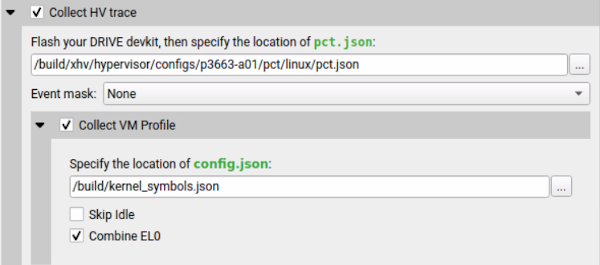
Use this dialog to specify XHV parameters:
Collect HV Trace- Enable XHV tracing.The location of
pct.jsonfile on the host. There is predefined hierarchy of XHV JSON files, for example:
xhv/
├── hypervisor
│             └── configs
│                 └── t234ref-release
│                     └── pct
│                         └── linux
│                             └── pct.json
└── schemas
    └── event
        ...
        ├── hv_events.json
        ...
Collect VM Profile- Enable XHV sampling, depends onCollect HV Trace.Event mask- Select XHV trace events, this option can be specified asNone.The location of
kernel_symbols.jsonfile on the host. Note that this file contains target paths to the kernel symbol files (see examples above).Skip idleandCombine EL0checkboxes are deprecated.
Adding Your Own Collection to a Report#
Nsight Systems allows the user to add additional information to a report file for display with other Nsight Systems options.
Nsight Systems Plugins#
Nsight Systems plugins are tools that extend its data collection capabilities, available
via CLI with --enable command option and via GUI.
There are multiple locations where the Nsight Systems searches for available plugins
described in the Plugin discovery section.
The bundled plugins are created, documented and maintained by the Nsight Systems team.
In addition to the plugins created by the Nsight Systems team, we also have a GitHub repository of plugins created and supported by third parties. See Third Party Plugins List or GitHub repository.
Warning
Third party plugins are not tested or validated in any way by the Nsight Systems team. NVIDIA is not responsible for the content or behavior of those plugins.
How to launch a plugin#
In CLI plugins are enabled with the --enable command option that also allows
passing arguments to the plugin. It’s possible to launch multiple instances
of the same plugin by using multiple --enable options.
Depending on the plugin type it may be available in nsys profile, nsys start
or nsys launch commands. For example, a minimal plugin that only sets some
environment variables will be applicable to the nsys launch and nsys profile
commands if the latter launches a profiled application because otherwise there is
little sense in modifying the environment. Refer to a plugin documentation to
find out its supported usage pattern.
Nsight Systems plugins can be configuration-only, standalone processes, shared libraries injected into target processes, or any combination of these features. When enabled, standalone plugin processes are launched just before the data collection starts and are terminated right before the collection stops. This default behavior can be amended, see the Developing an Nsight Systems Plugin section. Configuration and in-process shared libraries plugins are tied to the lifetime of a target process and are not unloaded after data collection stops.
Standalone plugin processes are launched with the same privileges as the running instance of Nsight Systems. If a plugin needs elevated privileges then Nsight Systems may need to run elevated.
How to pass arguments to a plugin#
To pass arguments to a plugin, specify them as a part of --enable option
after plugin name when launching the target application. The arguments should
be separated by commas only (no spaces). On non-Windows platforms, commas can
be escaped with a backslash \\, and the backslash itself can be escaped by
another backslash \\\\. On Windows, use the caret ^ as the escape character
(e.g., ^, for a literal comma), and ^^ for a literal caret. To include
spaces in an argument, enclose the argument in double quotes ".
See the section on the Amazon AWS Elastic Fabric Adapter (EFA) Network Counters for an example.
Supported platforms#
Nsight Systems plugins are supported on x86_64, arm64 Linux and x86_64 Windows.
Plugin discovery#
Nsight Systems will search for plugins in the following locations:
User-specified locations via environment variable.
Plugins bundled with this version of the profiler.
Third-party unversioned system-wide plugins.
The bundled and third-party plugins are placed in locations that should require elevated privileges for modification. This allows Nsight Systems to assume that all files in those locations are trusted and perform no additional verification.
Warning
Security notice: The user is responsible for ensuring security of the locations specified via environment variable. Nsight Systems cannot perform security checks and will trust and may execute any plugin that was discovered via user-provided location.
Third-party unversioned system-wide plugins
The paths for these plugins are platform-dependent.
Linux:/opt/nvidia/nsight-systems-pluginsWindows:C:\\Program Files\\NVIDIA Corporation\\Nsight Systems Plugins
User-specified locations via environment variable
User may specify multiple lookup locations via environment variable: NSYS_PLUGIN_SEARCH_DIRS
The location must be separated by a platform-dependent separator:
Linux::Windows:;
Listing available plugins
To list all available plugins use the nsys plugins list command.
It will collect all search locations and enumerate plugins in alphabetical
order. Plugins that have failed manifest validation will have an (error)
prefix. Note that it’s not possible to enable any plugins as long as there’s
at least one that fails validation.
Developing an Nsight Systems Plugin#
Plugin manifest file#
Plugin manifest is a file in the YAML format. It describes a plugin, its features and requirements. Nsight Systems validates all discovered manifests when at least one plugin has been enabled and will refuse to run the given command if any manifest fails the validation.
Supported top-level manifest keys
Name |
Required |
Value type |
Description |
|---|---|---|---|
PluginName |
Yes |
String |
A globally unique name for selecting the plugin via
|
Description |
Yes |
String |
A short description printed when listing plugins. |
ExtendedDescription |
No |
String |
Full description of a plugin. |
ExtendedDescriptionForGui |
No |
String |
Full description of a plugin shown in the GUI. |
TargetEnvironment |
No |
Dictionary |
Amend and possibly override the environment when launching a profiled application. Empty and duplicate keys are not allowed. |
ExecutablePath |
No |
String |
A path to a standalone plugin executable file. Both absolute and relative paths are supported. The manifest path is used as a base for relative executable paths. The given path must exist for a manifest to pass validation. |
LibraryPath |
No |
String |
A path to a shared library that will be injected into profiled processes. Both absolute and relative paths are supported. The manifest path is used a as base for relative executable paths. The given path must exist for a manifest to pass validation. |
At least one of the ExecutablePath, LibraryPath, or TargetEnvironment entries is required but all can be
used simultaneously in any combination.
Example manifest file
PluginName: unique_name
ExecutablePath: bin/plugin
LibraryPath: libPlugin.so
TargetEnvironment: {KEY: VALUE}
Description: This is an example plugin manifest.
Plugin types#
A plugin manifest may specify one or more actionable entries: ExecutablePath, LibraryPath,
TargetEnvironment. They are named as “standalone”, “in-process”, and “configuration” plugin types. When selected
with --enable option Nsight Systems will perform all applicable actionable entries.
The “in-process” and “configuration” plugin types are only executed when starting a profiled application.
The “standalone” plugin type is executed every time the report collection is started.
NsysDK Collector#
The NsysDK Collector is an API for plugins to communicate with the profiler. It’s a header-only library
that allows fetching current profiler state and extend data collection scope through the finalization stage.
Documentation is embedded into source files and additionally covered in this section.
The library sources are deployed with Nsight Systems installation, for example
/opt/nvidia/nsight-systems/2026.2.1/target-linux-x64/nsysdk.
Deploying plugins#
During plugin development it’s more convenient for Nsight Systems to pick it up directly
from a build output location rather than copy the binary each time to the pre-defined search
path. The easiest way to do this is to export the NSYS_PLUGIN_SEARCH_DIRS environment variable
with the location of a folder that contains the plugin manifest.
Minimal standalone plugin#
Simple standalone plugins are expected to initialize and shutdown near instantly.
Nsight Systems uses SIGTERM for indicating that a plugin needs to stop producing data and exit,
so it expects plugins to gracefully handle the signal and exit cleanly.
The data collected from plugins is in the form of NVTX events,
stdout and stderr streams.
The source code for the network_interface plugin is deployed as an example in
<profiler installation dir>/target-linux-x64/samples/NetworkPlugin.cpp.
Deferred events standalone plugin#
In some cases plugins may need to perform post-processing of the collected data or are obtaining their data from another source that only becomes available after a delay. In such cases if plugins were to immediately shutdown following a signal from the profiler some data would be lost. To avoid this, a plugin may acquire finalization tokens through the NsysDK Collector API. Once successfully obtained, these tokens will prevent profiler from stopping data collection until all tokens have been released allowing plugins to finish emitting their events. A plugin process may release finalization tokens explicitly or simply exit to have the tokens it held automatically released.
Note, that this feature is not designed for facilitating a lengthy de-initialization as the profiling data collection is still running in this state. If a plugin needs significant time to shutdown then it should release finalization tokens explicitly and handle SIGTERM signal.
The sample code below is a skeleton implementation of a plugin that utilizes finalization tokens.
Compile the example with g++ -I ./nvtx/include -I ./nsysdk/include -ldl plugin.cpp.
On POSIX platforms the NVTX library requires adding the -ldl linker option. Refer to the
NVTX documentation to learn how to use the deferred events feature.
#include <nvtx3/nvToolsExt.h>
#include <nsysdk/collector.h>

#include <chrono>
#include <thread>

int main(int argc, char* argv[])
{
    // <Additional initialization>

    if (!nsysdkCollectorAcquireFinalizationToken())
        return 1; // Not launched as a plugin.

    if (nsysdkCollectorWaitForState(NSYSDK_COLLECTOR_STATE_COLLECTING, 0) != NSYSDK_SUCCESS)
        return 1; // Profiling didn't start.

    while (nsysdkCollectorGetState() == NSYSDK_COLLECTOR_STATE_COLLECTING)
    {
        // Profiling data collection is active at this point.
        // A real plugin would be collecting and emitting data here.
        nvtxRangePushA("Workload imitation");
        std::this_thread::sleep_for(std::chrono::seconds(1));
        nvtxRangePop();
    }

    if (nsysdkCollectorGetState() != NSYSDK_COLLECTOR_STATE_FINALIZING)
        return 1; // Profiling might have been cancelled.

    // The data collection scope has been extended, emit NVTX deferred events here.
    nvtxRangePushA("Deferred events imitation");
    std::this_thread::sleep_for(std::chrono::seconds(1));
    nvtxRangePop();

    return 0;
}
Import NVTXT#
ImportNvtxt is an utility which allows conversion of a NVTXT file to a Nsight Systems report file (*.nsys-rep) or to merge it with an existing report file.
Note
NvtxtImport supports custom TimeBase values. Only the following values are supported:
Manual — timestamps are set using absolute values.
Relative — timestamps are set using relative values with regards to report file which is being merged with the NVTXT file.
ClockMonotonicRaw — timestamps values in the NVTXT file are considered to be gathered on the same target as the report file which is to be merged with NVTXT using
clock_gettime(CLOCK_MONOTONIC_RAW, ...)call.- CNTVCT — timestamps values in the NVTXT file are considered to be gathered
on the same target as the report file which is to be merged with NVTXT using CNTVCT values.
You can get usage info via the help message.
Print the help message:
-h [ --help ]
Show information about the report file:
--cmd info -i [--input] arg
Create the report file from an existing NVTXT file:
--cmd create -n [--nvtxt] arg -o [--output] arg [-m [--mode] mode_name mode_args] [--target <Hw:Vm>] [--update_report_time]
Merge the NVTXT file to an existing report file:
--cmd merge -i [--input] arg -n [--nvtxt] arg -o [--output] arg [-m [--mode] mode_name mode_args] [--target <Hw:Vm>] [--update_report_time]
Modes’ descriptions:
lerp - Insert with linear interpolation
--mode lerp --ns_a arg --ns_b arg [--nvtxt_a arg --nvtxt_b arg]
lin - insert with linear equation
--mode lin --ns_a arg --freq arg [--nvtxt_a arg]
Modes’ parameters:
ns_a- a nanoseconds valuens_b- a nanoseconds value (greater thanns_a)nvtxt_a- an nvtxt file’s time unit value corresponding tons_ananosecondsnvtxt_b- an nvtxt file’s time unit value corresponding tons_bnanosecondsfreq- the nvtxt file’s timer frequency--target <Hw:Vm>- specify target id, e.g.--target 0:1--update_report_time- prolong report’s profiling session time whilemerging if needed. Without this option all events outside the profiling session time window will be skipped during merging.
Commands#
Info
To find out report’s start and end time use info command.
Usage:
ImportNvtxt --cmd info -i [--input] arg
Example:
ImportNvtxt info Report.nsys-rep
Analysis start (ns) 83501026500000
Analysis end (ns)   83506375000000
Create
You can create a report file using existing NVTXT with create command.
Usage:
ImportNvtxt --cmd create -n [--nvtxt] arg -o [--output] arg [-m [--mode] mode_name mode_args]
Available modes are:
lerp — insert with linear interpolation.
lin — insert with linear equation.
Usage for lerp mode is:
--mode lerp --ns_a arg --ns_b arg [--nvtxt_a arg --nvtxt_b arg]
with:
ns_a— a nanoseconds value.ns_b— a nanoseconds value (greater thanns_a).nvtxt_a— an nvtxt file’s time unit value corresponding tons_ananoseconds.nvtxt_b— an nvtxt file’s time unit value corresponding tons_bnanoseconds.
If nvtxt_a and nvtxt_b are not specified, they are respectively set to nvtxt file’s minimum and maximum time value.
Usage for lin mode is:
--mode lin --ns_a arg --freq arg [--nvtxt_a arg]
with:
ns_a— a nanoseconds value.freq— the nvtxt file’s timer frequency.nvtxt_a— an nvtxt file’s time unit value corresponding tons_ananoseconds.
If nvtxt_a is not specified, it is set to nvtxt file’s minimum time value.
Examples:
ImportNvtxt --cmd create -n Sample.nvtxt -o Report.nsys-rep
The output will be a new generated report file which can be opened and viewed by Nsight Systems.
Merge
To merge NVTXT file with an existing report file use merge command.
Usage:
ImportNvtxt --cmd merge -i [--input] arg -n [--nvtxt] arg -o [--output] arg [-m [--mode] mode_name mode_args]
Available modes are:
lerp — insert with linear interpolation.
lin — insert with linear equation.
Usage for lerp mode is:
--mode lerp --ns_a arg --ns_b arg [--nvtxt_a arg --nvtxt_b arg]
with:
ns_a— a nanoseconds value.ns_b— a nanoseconds value (greater thanns_a).nvtxt_a— an nvtxt file’s time unit value corresponding tons_ananoseconds.nvtxt_b— an nvtxt file’s time unit value corresponding tons_bnanoseconds.
If nvtxt_a and nvtxt_b are not specified, they are respectively set to nvtxt file’s minimum and maximum time value.
Usage for lin mode is:
--mode lin --ns_a arg --freq arg [--nvtxt_a arg]
with:
ns_a— a nanoseconds value.freq— the nvtxt file’s timer frequency.nvtxt_a— an nvtxt file’s time unit value corresponding tons_ananoseconds.
If nvtxt_a is not specified, it is set to nvtxt file’s minimum time value.
Time values in <filename.nvtxt> are assumed to be nanoseconds if no mode specified.
Example
ImportNvtxt --cmd merge -i Report.nsys-rep -n Sample.nvtxt -o NewReport.nsys-rep
Reading Your Report in GUI#
Generating a New Report#
Users can generate a new report by stopping a profiling session. If a profiling session has been canceled, a report will not be generated, and all collected data will be discarded.
A new .nsys-rep file will be created and put into the same directory as the project file (.qdproj).
Opening an Existing Report#
An existing .nsys-rep file can be opened using File > Open….
Report Tab#
While generating a new report or loading an existing one, a new tab will be created. The most important parts of the report tab are:
View selector — Allows switching between Multi-report view (absent for single reports), Analysis Summary, Timeline View, Diagnostics Summary, and Symbol Resolution Logs views.
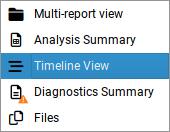
Timeline — This is where all charts are displayed.
Function table — Located below the timeline, it displays statistical information about functions in the target application in multiple ways.
Additionally, the following controls are available:
Zoom slider — Allows you to vertically zoom the charts on the timeline.
Analysis Summary View#
This view shows a summary of the profiling session. It can be used to review the various configurations used to generate this report. Depending on the features used, different subsections may be shown, but they may include
Profiling session information - including information about the capture time, duration, report file, and host information.
Target information - including OS and driver versions.
Process summary - processes run during analysis, arguments, and CPU utilization.
Module summary - modules used including name and CPU time (overall and per-process). Note - Module percentage in Analysis Summary page is calculated based on the cpu cycles logged in an IP sample for that module. When cpu cycles is inaccurate or absent (as is the case on x86_64 target), the module percentage is inaccurate.
Thread summary - including process ID, name, and CPU utilization
CPU information - information about all CPUs on the system
GPU information - information about all GPUs on the system
Network hardware info - information about NICs/Switches/Storage devices analyzed in the run.
Analysis options - information about which Nsight Systems options were used when generating this report.
Nsight Systems - information about the version used to collect and display the results.
Information from this view can be selected and copied using the mouse cursor.
Diagnostics Summary View#
This view shows important messages. Some of them were generated during the profiling session, while some were added while processing and analyzing data in the report. Messages can be one of the following types:
Informational messages
Warnings
Errors
To draw attention to important diagnostics messages, a summary line is displayed on the timeline view in the top right corner:
Information from this view can be selected and copied using the mouse cursor.
Symbol Resolution Logs View#
This view shows all messages related to the process of resolving symbols. It might be useful to debug issues when some of the symbol names in the symbols table of the timeline view are unresolved.
Timeline View#
The timeline view consists of two main controls: the timeline at the top, and a bottom pane that contains the events view and the function table. In some cases, when sampling of a process has not been enabled, the function table might be empty and hidden.
The bottom view selector sets the view that is displayed in the bottom pane.
Timeline#
Timeline is a versatile control that contains a tree-like hierarchy on the left, a line labels column in the center, and the corresponding charts on the right. The line labels column can be hidden by using the timeline options.
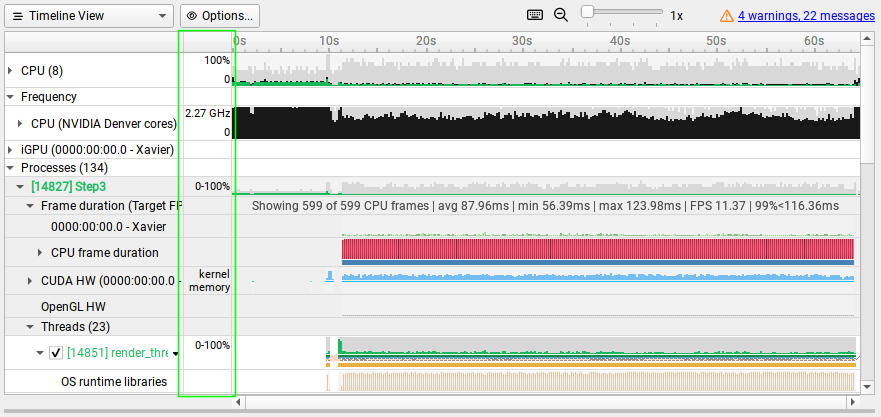
Contents of the hierarchy depend on the project settings used to collect the report. For example, if a certain feature has not been enabled, corresponding rows will not be shown on the timeline.
Process Coloring
The CPU utilization timelines are colored based on the CPU operating mode:
User mode - Green
Kernel mode - Red
Other (for example system-wide processes) - Black
CPU Activity Computation Notes
CPU usage and thread-state ranges in Timeline are computed from the best available source:
If CPU scheduling events are available, they are used as the primary source.
If scheduling events are not available (for example,
--cpuctxsw=none), and OS Runtime trace data is present, thread states are estimated from OSRT events.
Exporting from Timeline
To generate a timeline screenshot without opening the full GUI, use the command:
nsys-ui.exe --screenshot filename.nsys-rep
Hovering over elements in the GUI will cause a tooltip to pop open as appropriate
to give additional information, such as the parameters of that function call or
or the call stack. Tooltips can be copied by hovering and right clicking to bring
up the Copy Tooltip option in the context menu:
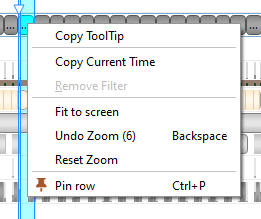
Zoom and Scroll#
At the upper right portion of your Nsight Systems GUI, you will see this section:

The slider sets the vertical size of screen rows, and the magnifying glass resets it to the original settings.
There are many ways to zoom and scroll horizontally through the timeline. Clicking on the keyboard icon seen above, opens the below dialog that explains them.
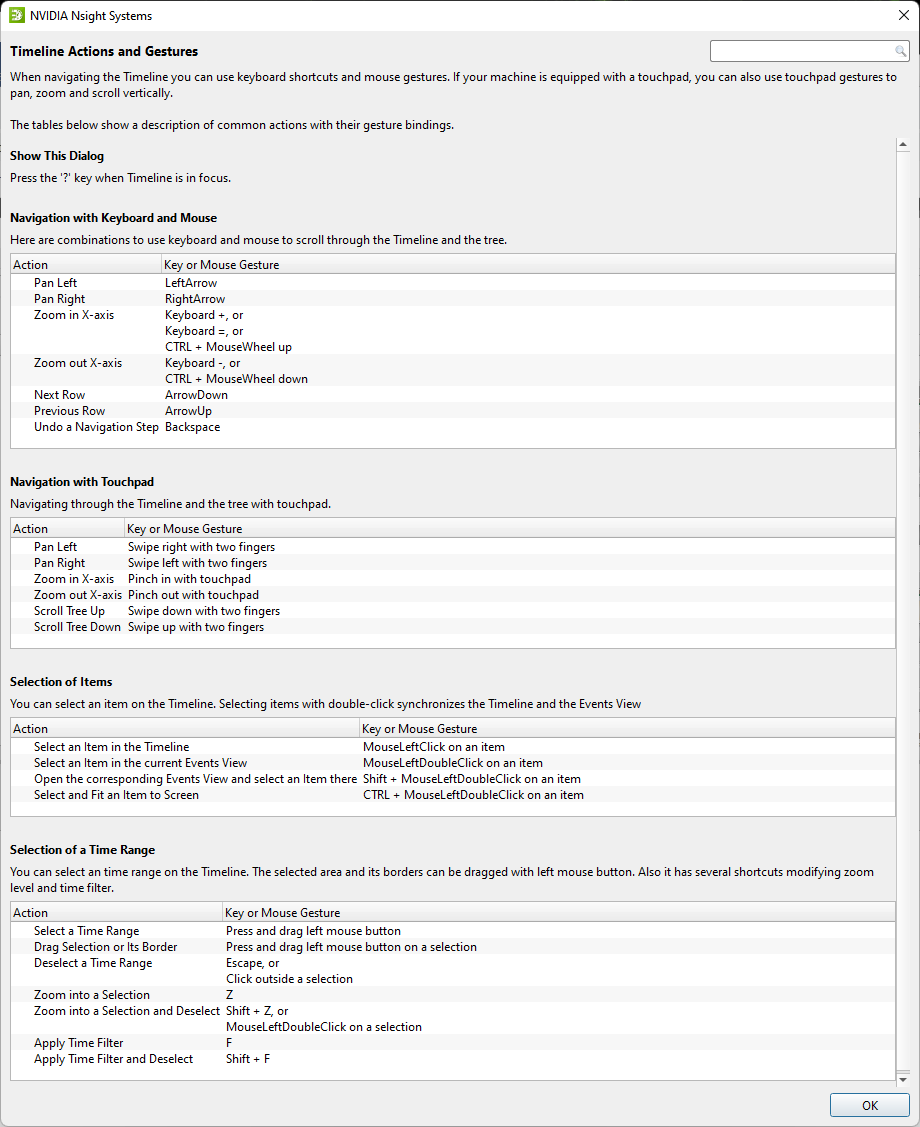
Pinning Rows#
In order to better allow users to compare rows from different sections of the
timeline, Nsight Systems gives the user the ability to select rows and “pin”
them in the visual range. To select a row to pin, use Ctrl+P or Pin row
from the right click menu.
Once a row has been pinned, it remain at the top or bottow of the window, rather than scrolling off.
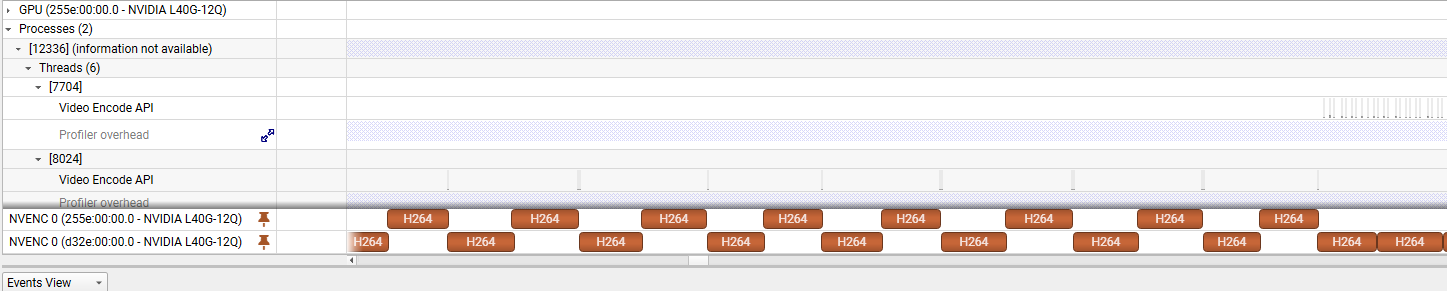
Timeline Correlation#
The Nsight Systems GUI can correlate between calls on the CPU and GPU to help you understand the workflow.
Selecting an item will highlight that item in teal as well as:
Any copy of that same item in other rows. This means that if there is a summary row that includes this item it will also have the appropriate section highlighted.
All correlated items. For example, if a CUDA kernel was launched by a CPU function both are highlighted.
All things in that thread or stream that falls into the time range since they are of part of that larger range. For example, if you clicked an NVTX range it would select all NVTX ranges and CUDA launches inside and then extend to its correlations.
The highlighting also includes lines to each event to better distinguish when highlighted events or ranges are overlapping.
In addition, Nsight Systems also provides indicators to help you find correlated items not currently on your screen, including:
Highlights in the row headers when there is something highlighted in that row.
Diagonal arrows in row headers if something is in a child row.
Highlights in the timeline rule.
Arrows in corners when something highlighted is off-screen. You can click those and the timeline will pan or zoom to get them into view.
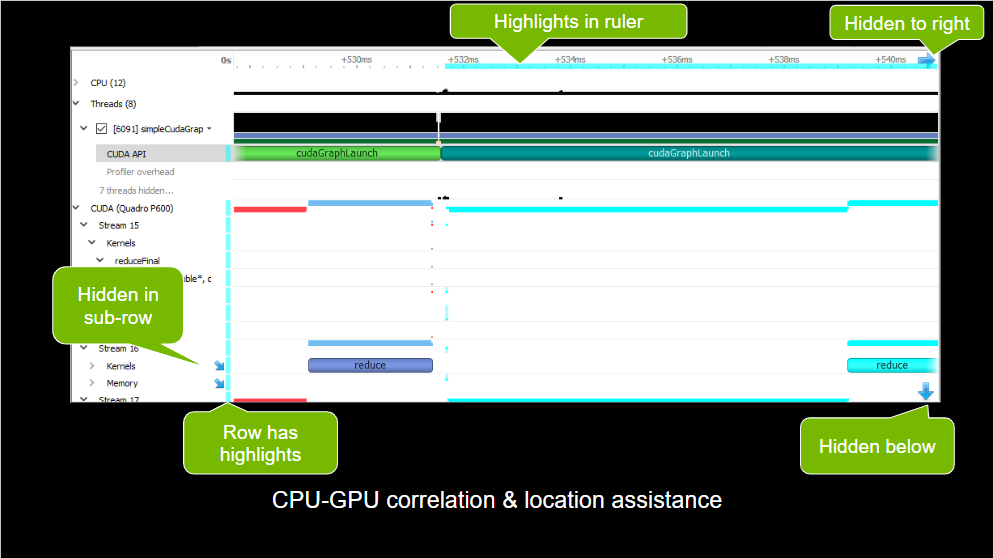
Correlation exists bidirectionally for:
CUDA kernels, CUDA graphs, GPU memcopies, and OptiX.
GPU memsets.
Vulkan QueueSubmits API and CommandBuffers on GPU.
D3D and GL just like Vulkan.
Timeline/Events Correlation#
To display trace events in the Events View right-click a timeline row and select
the Show in Events View command. The events of the selected row and all of
its sub-rows will be displayed in the Events View. Note that the events
displayed will correspond to the current zoom in the timeline, zooming in or out
will reset the event pane filter.
If a timeline row has been selected for display in the Events View, then double-clicking a timeline item on that row will automatically scroll the content of the Events View to make the corresponding events view item visible and select it. If that event has tool tip information, it will be displayed in the right hand pane.
Likewise, double-clicking on a particular instance in the Events View will highlight the corresponding event in the timeline.
Row Height#
Several of the rows in the timeline use height as a way to model the percent utilization of resources. This gives the user insight into what is going on even when the timeline is zoomed all the way out.
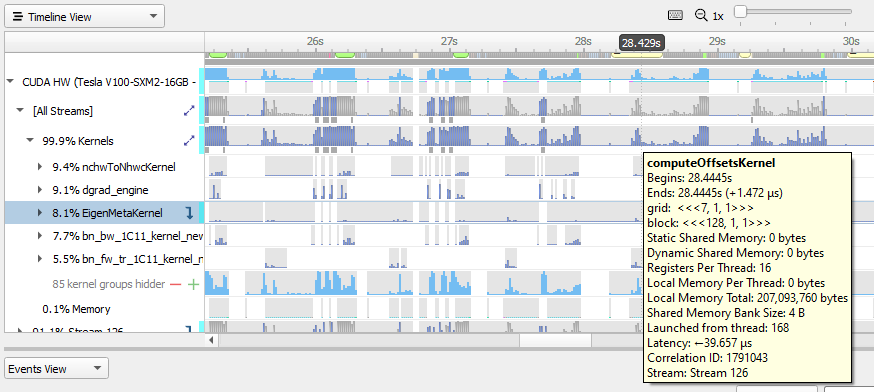
In this picture, you see that for kernel occupation there is a colored bar of variable height.
Nsight Systems calculates the average occupancy for the period of time represented by particular pixel width of screen. It then uses that average to set the top of the colored section. So, for instance, if 25% of that timeslice the kernel is active, the bar goes 25% of the distance to the top of the row.
In order to make the difference clear, if the percentage of the row height is non-zero, but would be represented by less than one vertical pixel, Nsight Systems displays it as one pixel high. The gray height represents the maximum usage in that time range.
This row height coding is used in the CPU utilization, thread and process occupancy, kernel occupancy, and memory transfer activity rows.
Row Percentage#
In the previous image, you also see that there are percentages prefixing the stream rows in the GPU.
The percentage shown in front of the stream indicates the proportion of context running time this particular stream takes.
% stream = 100.0 X streamUsage / contextUsage
streamUsage = total amount of time this stream is active on GPU
contextUsage = total amount of time all streams for this context are active on GPU
So “26% Stream 1” means that Stream 1 takes 26% of its context’s total running time.
Total running time = sum of durations of all kernels and memory ops that
run in this context
Timeline Options#
We strongly recommend using the OS/Desktop defaults for size and color, but if you would like to set them for yourself, they are available using the Tools > Options dialog.
The above will change the options globally for this GUI. It’s also possible to change some options for a particular open report. There is an “Options…” button near the View Selector:
This button will show a dialog that allows showing/hiding the following:
correlation arrows;
line labels;
CPU occupancy chart.
By default, the timeline will be based on session time. If you would like to switch to global time, click on the small arrow at the top of the leftmost column to reveal the dropdown shown below:
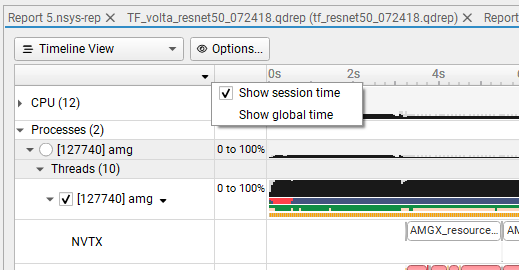
Events View#
The Events View provides a tabular display of the trace events. The view contents can be searched and sorted.
Double-clicking an item in the Events View automatically focuses the Timeline View on the corresponding timeline item.
API calls, GPU executions, and debug markers that occurred within the boundaries of a debug marker are displayed nested to that debug marker. Multiple levels of nesting are supported.
Events view recognizes these types of debug markers:
NVTX
Vulkan VK_EXT_debug_marker markers, VK_EXT_debug_utils labels
PIX events and markers
OpenGL KHR_debug markers
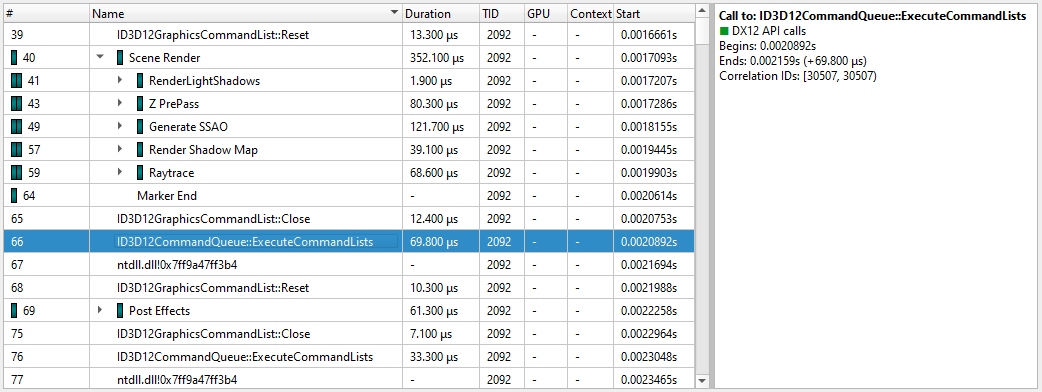
You can copy and paste from the events view by highlighting rows, using Shift or Ctrl to enable multi-select. Right clicking on the selection will give you a copy option.
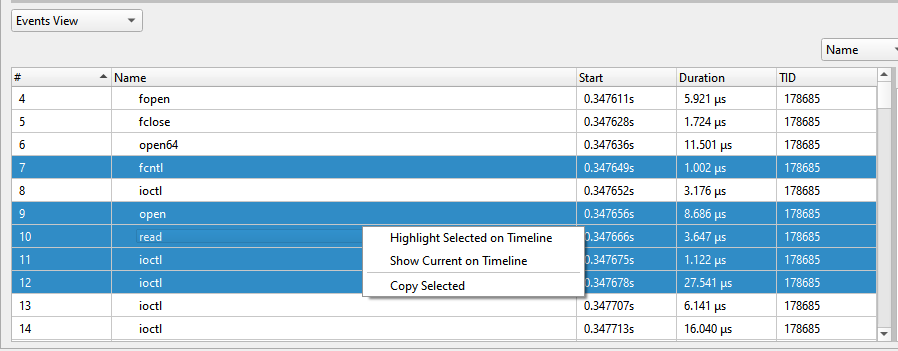
Pasting into text gives you a tab separated view:
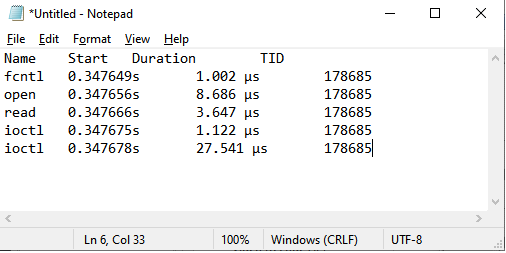
Pasting into spreadsheet properly copies into rows and columns:
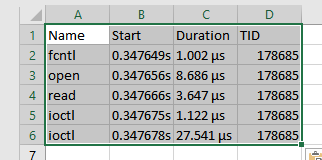
Function Table Modes#
The function table can work in three modes:
Top-Down View — In this mode, expanding top-level functions provides information about the callee functions. One of the top-level functions is typically the main function of your application, or another entry point defined by the runtime libraries.
Bottom-Up View — This is a reverse of the Top-Down view. On the top level, there are functions directly hit by the sampling profiler. To explore all possible call chains leading to these functions, you need to expand the subtrees of the top-level functions.
Flat View — This view enumerates all functions ever observed by the profiler, even if they have never been directly hit, but just appeared somewhere on the call stack. This view typically provides a high-level overview of which parts of the code are CPU-intensive.
Each of the views helps understand particular performance issues of the application being profiled. For example:
When trying to find specific bottleneck functions that can be optimized, the Bottom-Up view should be used. Typically, the top few functions should be examined. Expand them to understand in which contexts they are being used.
To navigate the call tree of the application and while generally searching for algorithms and parts of the code that consume unexpectedly large amount of CPU time, the Top-Down view should be used.
To quickly assess which parts of the application, or high level parts of an algorithm, consume significant amount of CPU time, use the Flat view.
The Top-Down and Bottom-Up views have Self and Total columns, while the Flat view has a Flat column. It is important to understand the meaning of each of the columns:
Top-Down view
Self column denotes the relative amount of time spent executing instructions of this particular function.
Total column shows how much time has been spent executing this function, including all other functions called from this one. Total values of sibling rows sum up to the Total value of the parent row, or 100% for the top-level rows.
Bottom-Up view
Self column for top-level rows, as in the Top-Down view, shows how much time has been spent directly in this function. Self times of all top-level rows add up to 100%.
Self column for children rows breaks down the value of the parent row based on the various call chains leading to that function. Self times of sibling rows add up to the value of the parent row.
Flat view
Flat column shows how much time this function has been anywhere on the call stack. Values in this column do not add up or have other significant relationships.
Note
If low-impact functions have been filtered out, values may not add up correctly to 100%, or to the value of the parent row. This filtering can be disabled.
Contents of the symbols table is tightly related to the timeline. Users can apply and modify filters on the timeline, and they will affect which information is displayed in the symbols table:
Per-thread filtering — Each thread that has sampling information associated with it has a checkbox next to it on the timeline. Only threads with selected checkboxes are represented in the symbols table.
Time filtering — A time filter can be setup on the timeline by pressing the left mouse button, dragging over a region of interest on the timeline, and then choosing Filter by selection in the dropdown menu. In this case, only sampling information collected during the selected time range will be used to build the symbols table.
Note
If too little sampling data is being used to build the symbols table (for example, when the sampling rate is configured to be low, and a short period of time is used for time-based filtering), the numbers in the symbols table might not be representative or accurate in some cases.
Function Table Notes#
Last Branch Records vs. Frame Pointers
Two of the mechanisms available for collecting backtraces are Intel Last Branch Records (LBRs) and frame pointers. LBRs are used to trace every branch instruction via a limited set of hardware registers. They can be configured to generate backtraces but have finite depth based on the CPU’s microarchitecture. LBRs are effectively free to collect but may not be as deep as you need in order to fully understand how the workload arrived a specific Instruction Pointer (IP).
Frame pointers only work when a binary is compiled with the -fno-omit-frame-pointer compiler switch. To determine if frame pointers are enabled on an x86_64 binary running on Linux, dump a binary’s assembly code using the objdump -d [binary_file] command and look for this pattern at the beginning of all functions;
push   %rbp
mov    %rsp,%rbp
When frame pointers are available in a binary, full stack traces will be captured. Note that libraries that are frequently used by applications and ship with the operating system, such as libc, are generated in release mode and therefore do not include frame pointers. Frequently, when a backtrace includes an address from a system library, the backtrace will fail to resolve further as the frame pointer trail goes cold due to a missing frame pointer.
A simple application was developed to show the difference. The application calls function a(), which calls b(), which calls c(), etc. Function z() calls a heavy compute function called matrix_multiply(). Almost all of the IP samples are collected while matrix_multiple is executing. The next two screen shots show one of the main differences between frame pointers and LBRs.
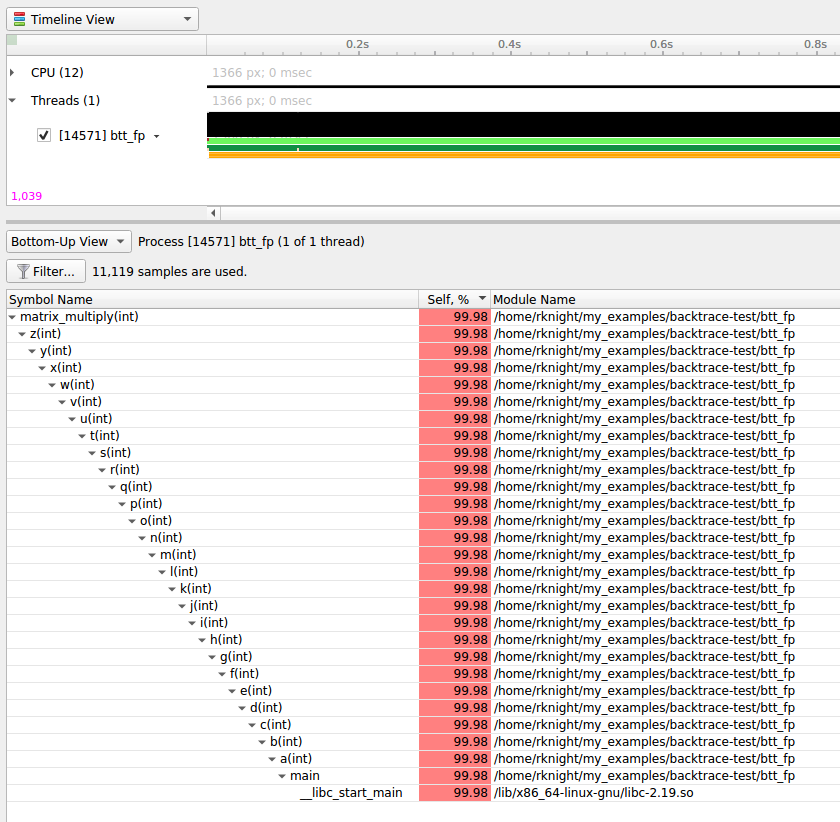
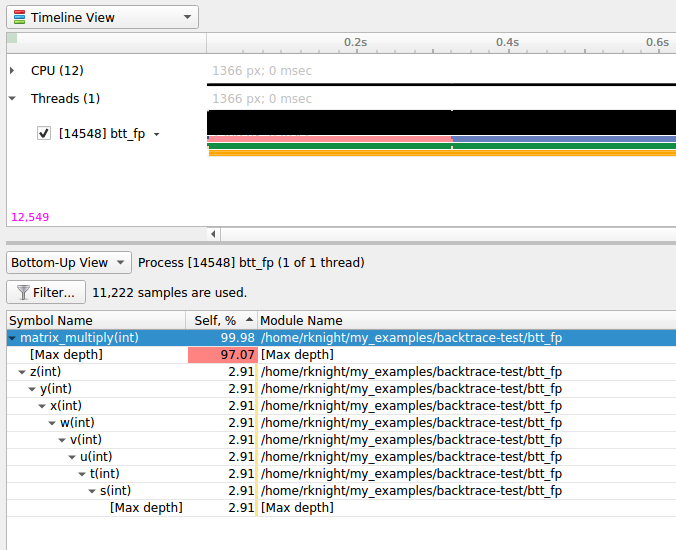
Note that the frame pointer example shows the full stack trace, while the LBR example only shows part of the stack due to the limited number of LBR registers in the CPU.
Kernel Samples
When an IP sample is captured while a kernel mode (i.e. operating system) function is executing, the sample will be shown with an address that starts with 0xffffffff and map to the [kernel.kallsyms] module.
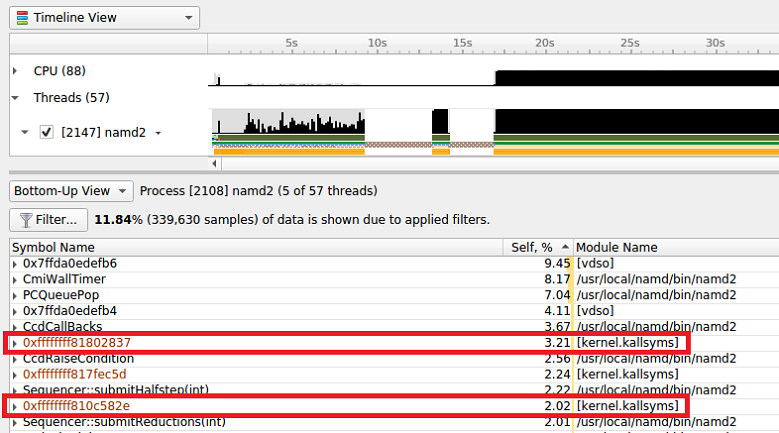
[vdso]
Samples may be collected while a CPU is executing functions in the Virtual Dynamic Shared Object. In this case, the sample will be resolved (i.e., mapped) to the [vdso] module. The vdso man page provides the following description of the vdso:
The “vDSO“ (virtual dynamic shared object) is a small shared library
that the kernel automatically maps into the address space of all
user-space applications.  Applications usually do not need to concern
themselves with these details as the vDSO is most commonly called by
the C library.  This way you can code in the normal way using
standard functions and the C library will take care of using any
functionality that is available via the vDSO.

Why does the vDSO exist at all?  There are some system calls the
kernel provides that user-space code ends up using frequently, to the
point that such calls can dominate overall performance. This is due
both to the frequency of the call as well as the context-switch
overhead that results from exiting user space and entering the
kernel.
[Unknown]
When an address can not be resolved (i.e., mapped to a module), its address within the process’ address space will be shown and its module will be marked as [Unknown].
Filter Dialog#
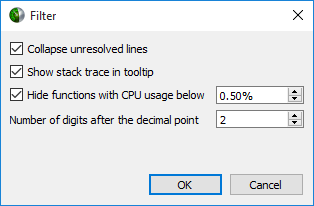
Collapse unresolved lines is useful if some of the binary code does not have symbols. In this case, subtrees that consist of only unresolved symbols get collapsed in the Top-Down view, since they provide very little useful information.
Hide functions with CPU usage below X% is useful for large applications, where the sampling profiler hits lots of function just a few times. To filter out the “long tail,” which is typically not important for CPU performance bottleneck analysis, this checkbox should be selected.
Example of Using Timeline with Function Table#
Here is an example walkthrough of using the timeline and function table with Instruction Pointer (IP)/backtrace Sampling Data
Timeline
When a collection result is opened in the Nsight Systems GUI, there are multiple ways to view the CPU profiling data - especially the CPU IP / backtrace data.
In the timeline, yellow-orange marks can be found under each thread’s timeline that indicate the moment an IP / backtrace sample was collected on that thread (e.g., see the yellow-orange marks in the Specific Samples box above). Hovering the cursor over a mark will cause a tooltip to display the backtrace for that sample.
Below the Timeline is a drop-down list with multiple options including Events View, Top-Down View, Bottom-Up View, and Flat View. All four of these views can be used to view CPU IP / backtrace sampling data.
If the Bottom-Up View is selected, here is the sampling summary shown in the bottom half of the Timeline View screen. Notice that the summary includes the phrase “65,022 samples are used,” indicating how many samples are summarized. By default, functions that were found in less less than 0.5% of the samples are not show. Use the filter button to modify that setting.
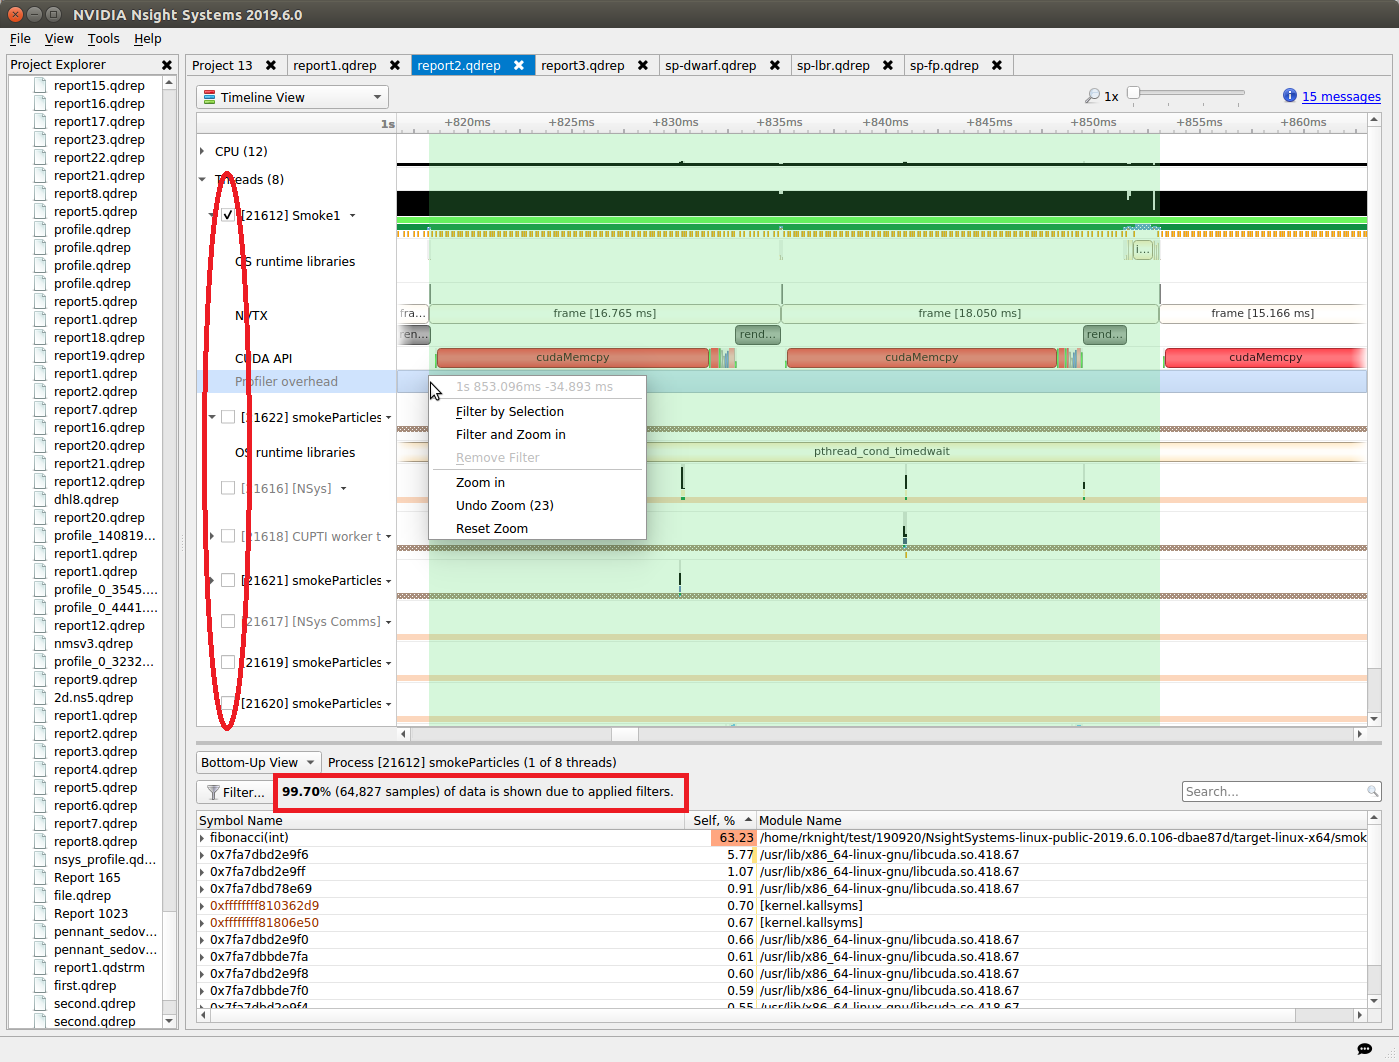
When sampling data is filtered, the Sampling Summary will summarize the selected samples. Samples can be filtered on an OS thread basis, on a time basis, or both. Above, deselecting a checkbox next to a thread removes its samples from the sampling summary. Dragging the cursor over the timeline and selecting “Filter and Zoom In” chooses the samples during the time selected, as seen below. The sample summary includes the phrase “0.35% (225 samples) of data is shown due to applied filters” indicating that only 225 samples are included in the summary results.
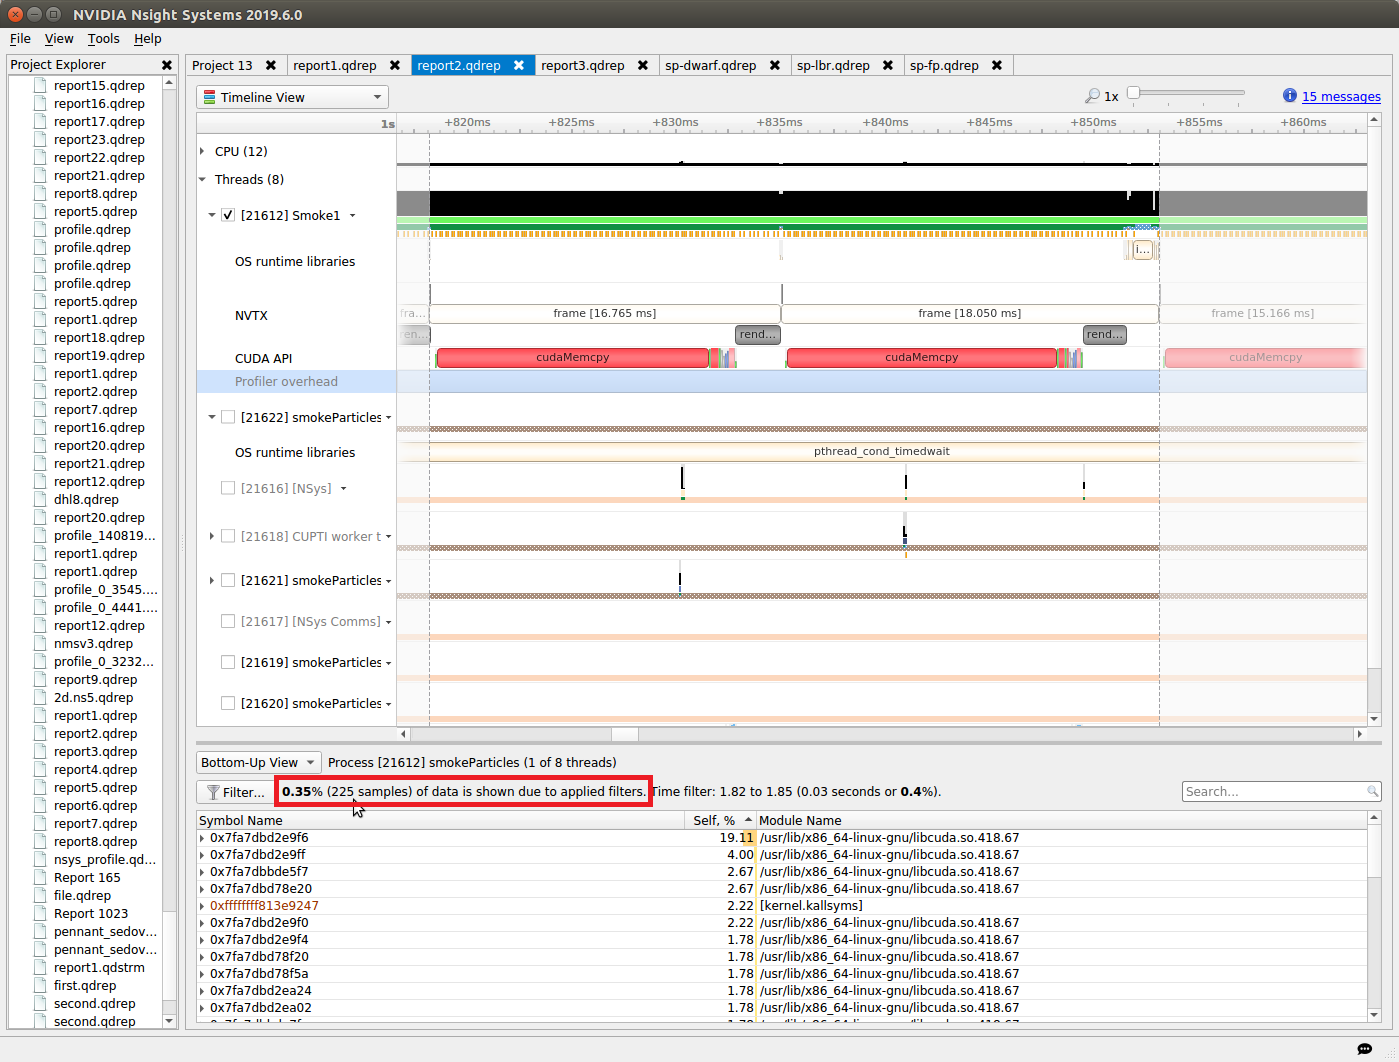
Deselecting threads one at a time by deselecting their checkbox can be tedious. Click on the down arrow next to a thread and choose Show Only This Thread to deselect all threads except that thread.
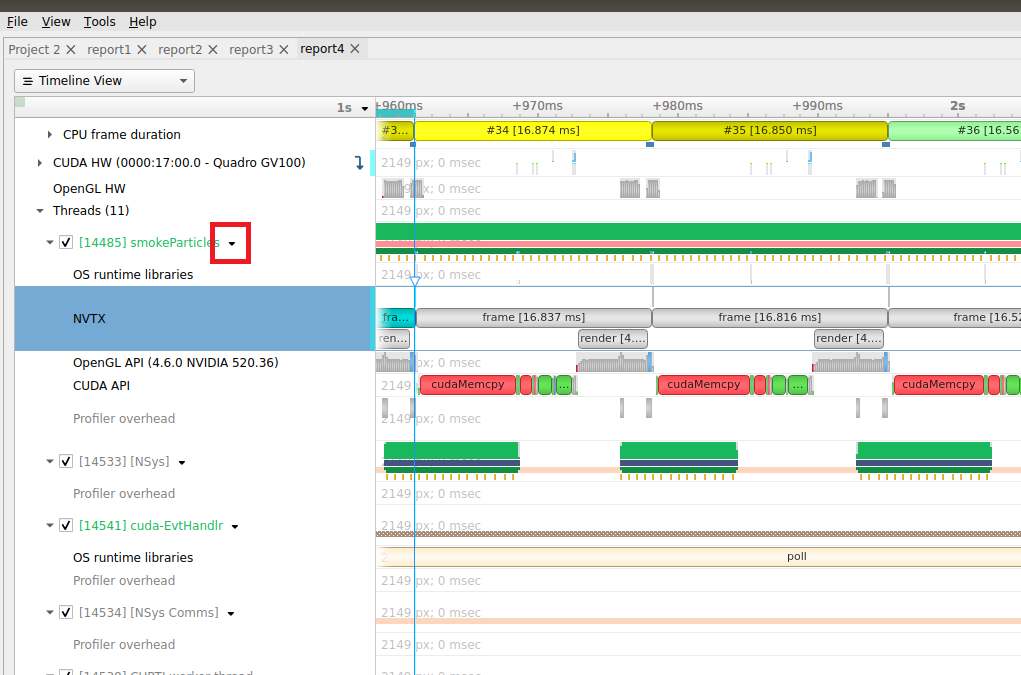
If the Events View is selected in the Timeline View’s drop-down list, right click on a specific thread and choose Show in Events View. The samples collected while that thread executed will be shown in the Events View. Double-clicking on a specific sample in the Events view causes the timeline to show when that sample was collected; see the green boxes below. The backtrace for that sample is also shown in the Events View.
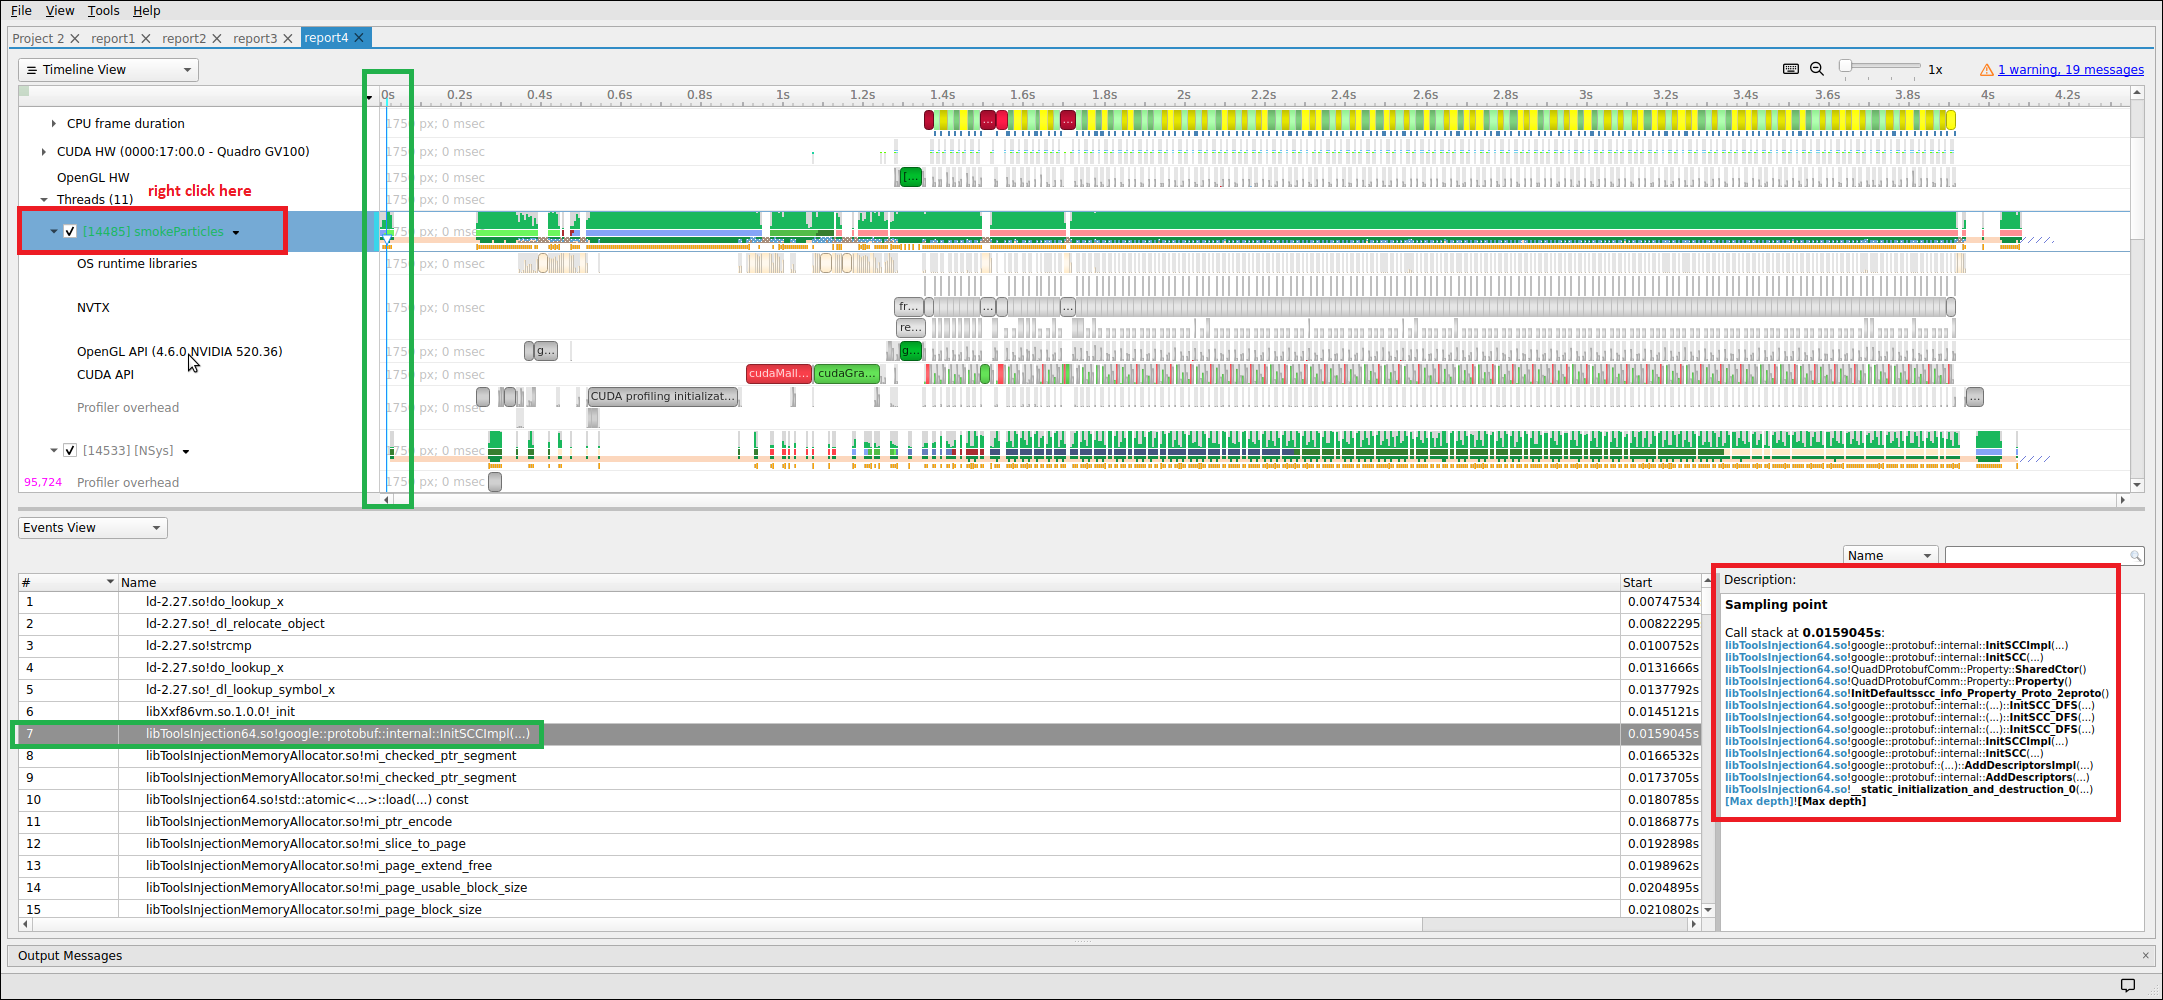
Backtraces
To understand the code path used to get to a specific function shown in the sampling summary, right-click on a function and select Expand.
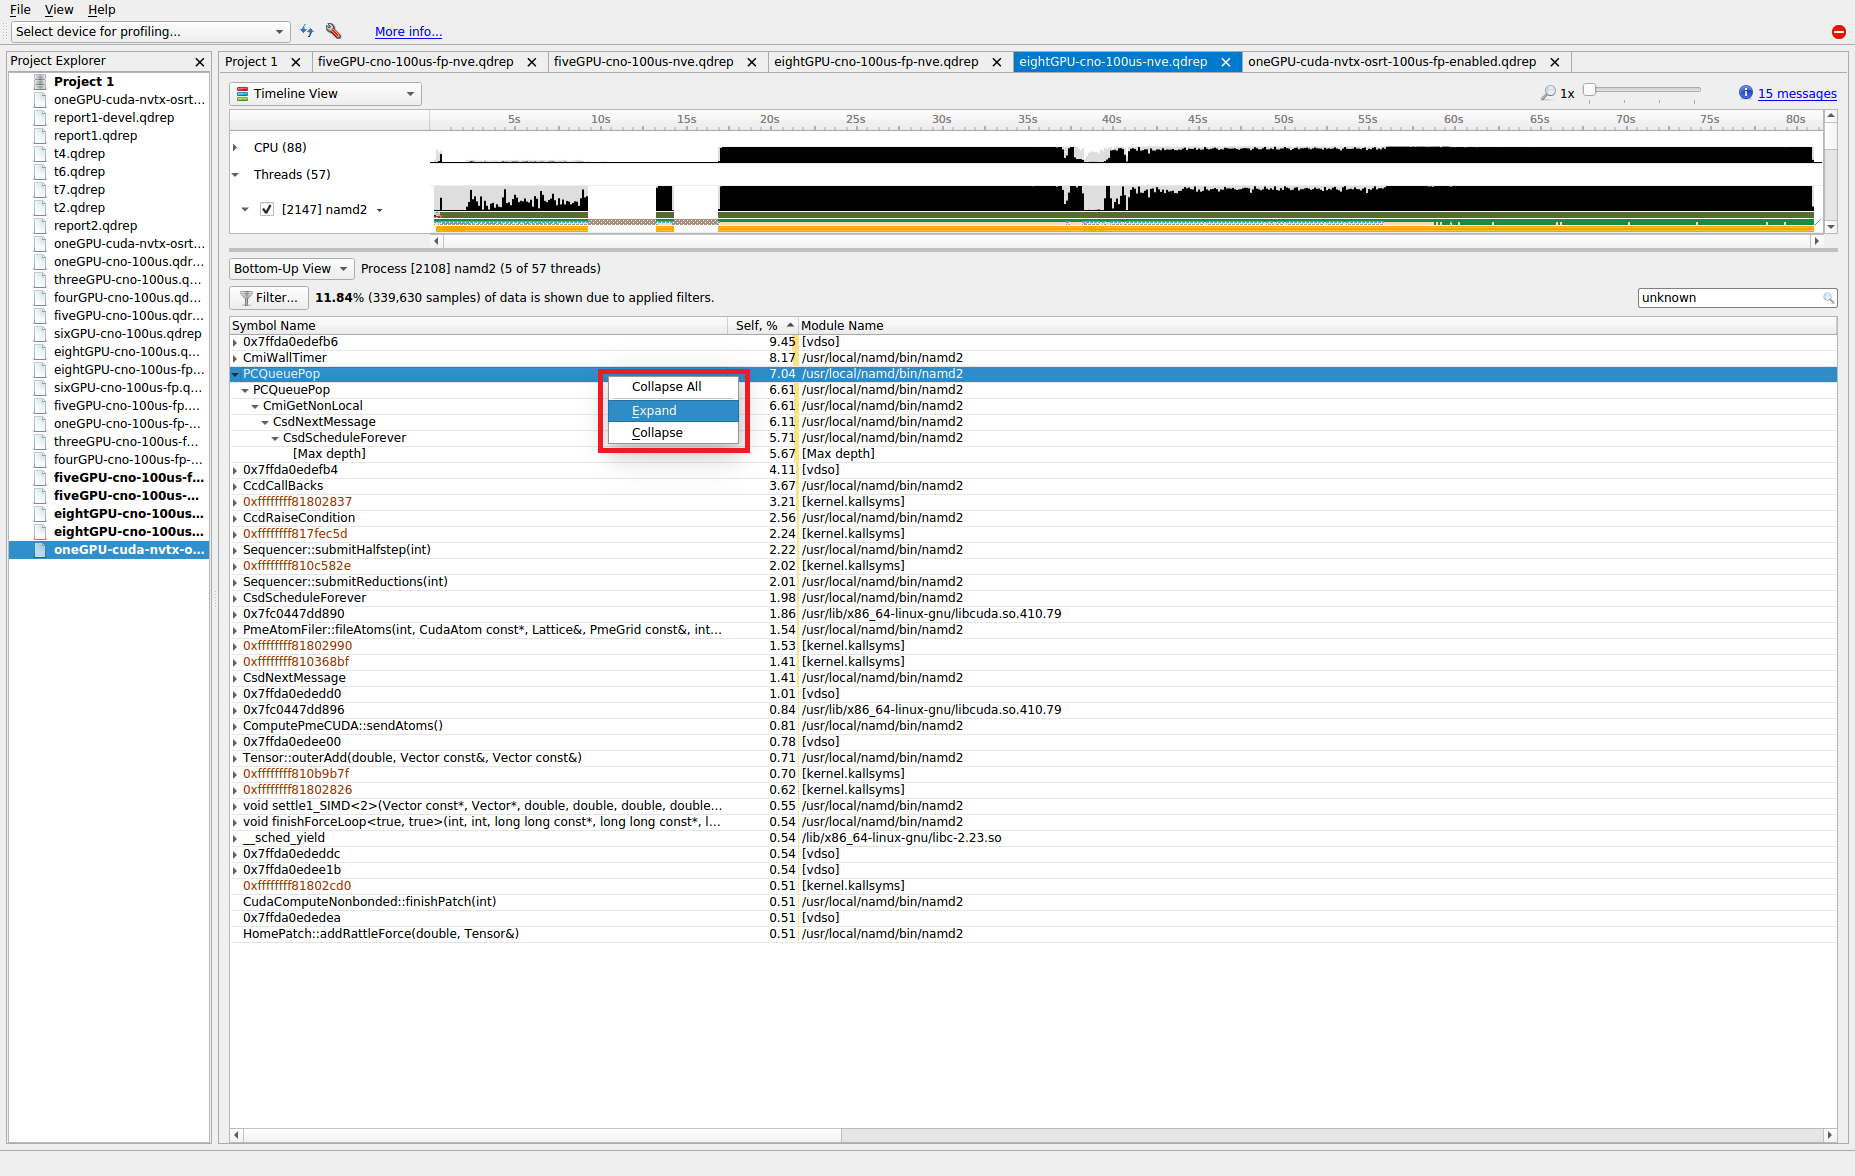
The above shows what happens when a function’s backtraces are expanded. In this case, the PCQueuePop function was called from the CmiGetNonLocal function which was called by the CsdNextMessage function which was called by the CsdScheduleForever function. The [Max depth] string marks the end of the collected backtrace.
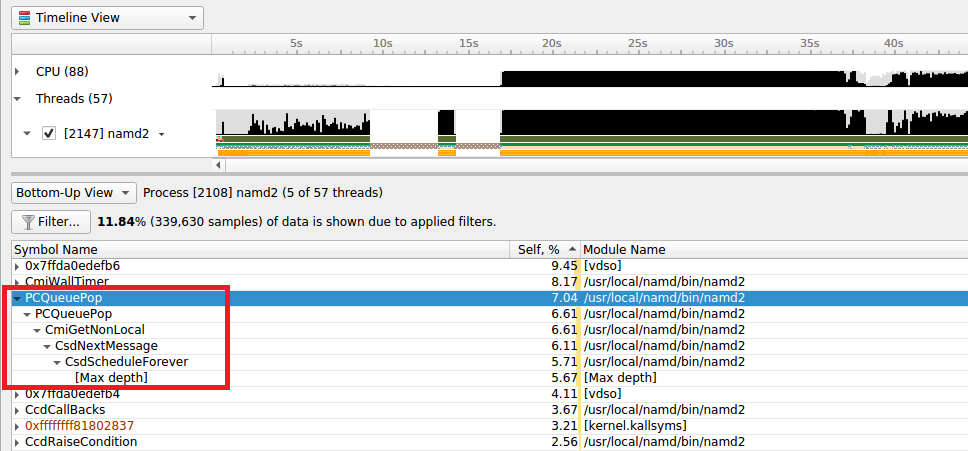
Note that, by default, backtraces with less than 0.5% of the total backtraces are hidden. This behavior can make the percentage results hard to understand. If all backtraces are shown (i.e., the filter is disabled), the results look very different and the numbers add up as expected. To disable the filter, click on the Filter… button and uncheck the Hide functions with CPU usage below X% checkbox.
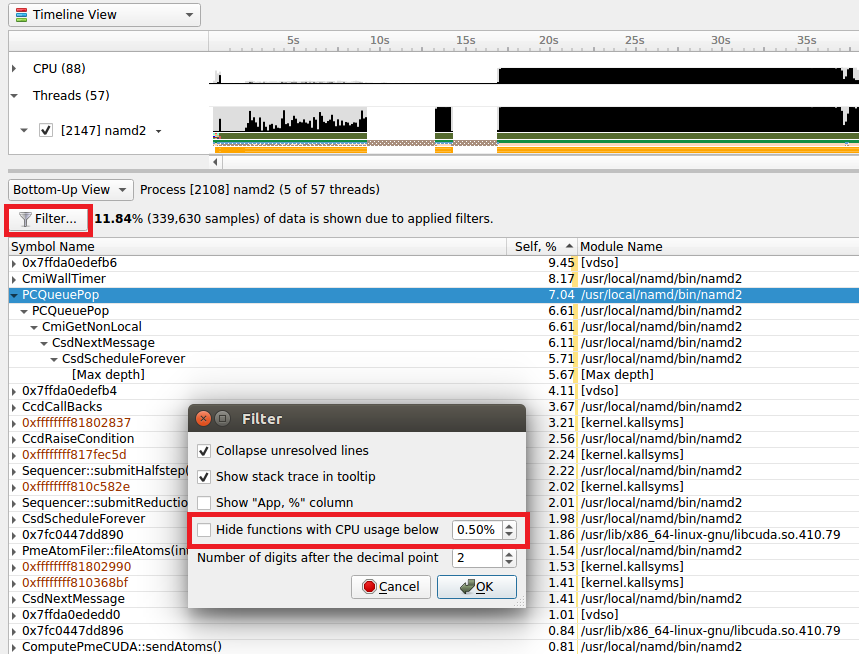
When the filter is disabled, the backtraces are recalculated. Note that you may need to right-click on the function and select Expand again to get all of the backtraces to be shown.
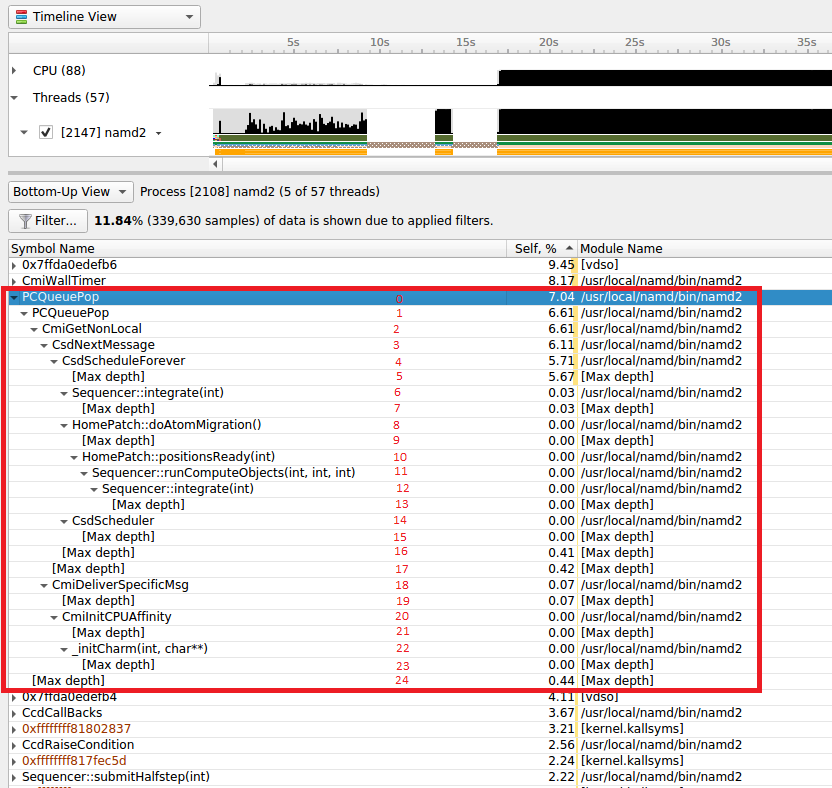
When backtraces are collected, the whole sample (IP and backtrace) is handled as a single sample. If two samples have the exact same IP and backtrace, they are summed in the final results. If two samples have the same IP but a different backtrace, they will be shown as having the same leaf (i.e., IP) but a different backtrace. As mentioned earlier, when backtraces end, they are marked with the [Max depth] string (unless the backtrace can be traced back to its origin; e.g., __libc_start_main) or the backtrace breaks because an IP cannot be resolved.
Above, the leaf function is PCQueuePop. In this case, there are 11 different backtraces that lead to PCQueuPop — all of them end with [Max depth]. For example, the dominant path is PCQueuPop<-CmiGetNonLocal<-CsdNextmessage<-CsdScheduleForever<-[Max depth]. This path accounts for 5.67% of all samples as shown in line 5 (red numbers). The second most dominant path is PCQueuPop<-CmiGetNonLocal<-[Max depth] which accounts for 0.44% of all samples as shown in line 24 (red numbers). The path PCQueuPop<-CmiGetNonLocal<-CsdNextmessage<-CsdScheduleForever<-Sequencer::integrate(int)<-[Max depth] accounts for 0.03% of the samples as shown in line 7 (red numbers). Adding up percentages shown in the [Max depth] lines (lines 5, 7, 9, 13, 15, 16, 17, 19, 21, 23, and 24) generates 7.04% which equals the percentage of samples associated with the PCQueuePop function shown in line 0 (red numbers).
Multi-Report Timeline Views#
Viewing Multiple Reports in Separate Panes#
You have the option of looking at two or more Nsight Systems results files in separate panes. To do so, open each in a tab. Grab one of the tabs and undock:
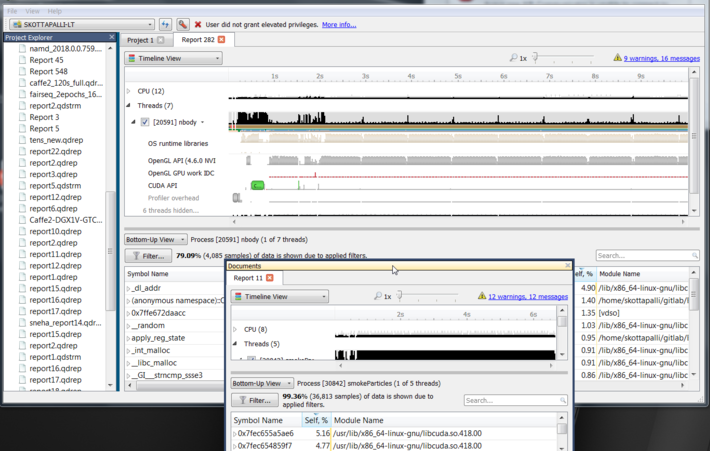
When you hover with the cursor in the middle of the GUI, you will see options for where to dock the pane:
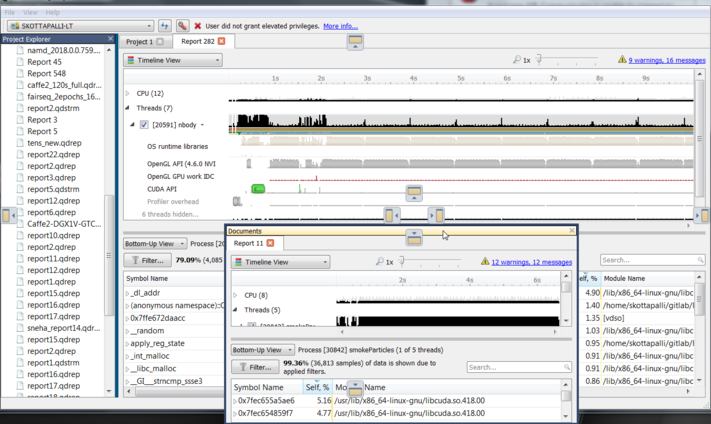
Multiple reports can be docked in the window.
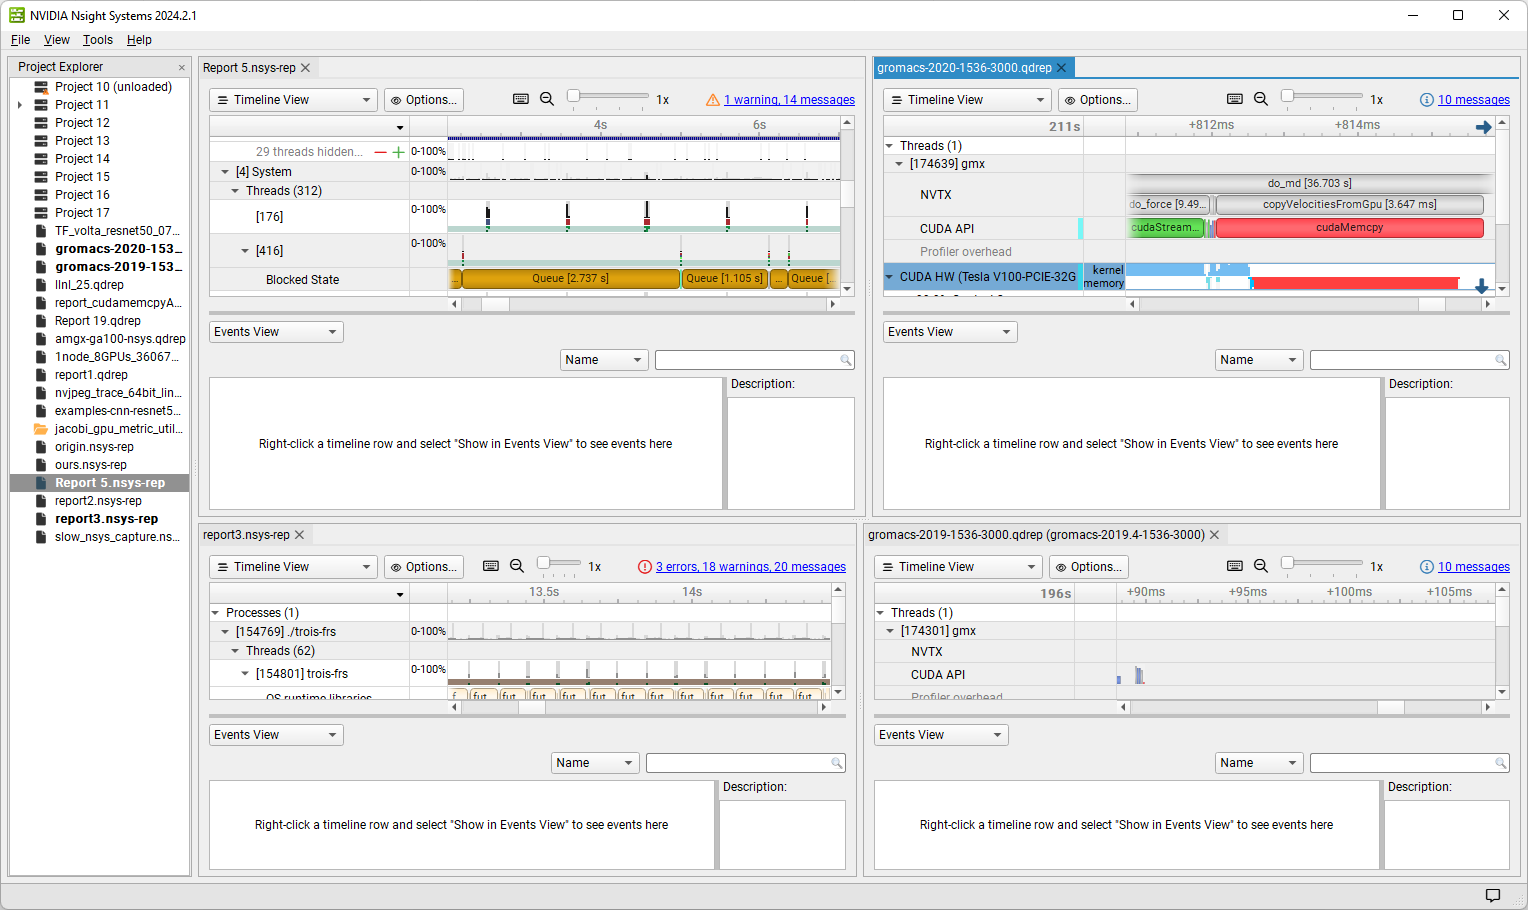
Viewing Multiple Reports in the Same Timeline#
You can open several reports in a single timeline. This could be done using one of these methods:
File > Open… in the main menu, and select several report files.
File > New multi-report view in the main menu, add report files that you want to open in the Multi-report view, and click the “Apply” button.
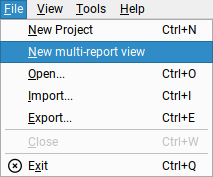
Multi-report view contains simple editor that allows to add/remove some report files and will load them all on a single timeline after applying that set of reports.
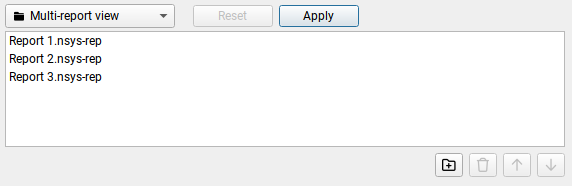
When reports are loaded, one can use the View Selector to open the Multi-report view again, change the set of reports, and click on “Apply” button to reload the timeline with the new set of reports.
The selected set of reports can be saved as a Multi-report view document and could be opened later to load the same set again.
Time Synchronization#
When multiple reports are loaded into a single timeline, timestamps between them need to be adjusted, such that events that happened at the same time appear to be aligned.
Nsight Systems can automatically adjust timestamps based on UTC time
recorded around the collection start time. This method is used by default when
other more precise methods are not available. This time can be seen as UTC
time at t=0 in the Analysis Summary page of the report file. Refer to your
OS documentation to learn how to sync the software clock using the Network Time
Protocol (NTP). NTP-based time synchronization is not very precise, with the
typical errors on the scale of one to tens of milliseconds.
Reports collected on the same physical machine can use synchronization based on
Timestamp Counter (TSC) values. These are platform-specific counters,
typically accessed in user space applications using the RDTSC instruction on
x86_64 architecture, or by reading the CNTVCT register on Arm64. Their values
converted to nanoseconds can be seen as TSC value at t=0 in the Analysis
Summary page of the report file. Reports synchronized using TSC values can be
aligned with nanoseconds-level precision.
TSC-based time synchronization is activated automatically, when Nsight Systems
detects that reports come from same target and that the same TSC value
corresponds to very close UTC times. Targets are considered to be the same when
either explicitly set environment variables NSYS_HW_ID are the same for both
reports or when target hostnames are the same and NSYS_HW_ID is not set for
either target. The difference between UTC and TSC time offsets must be below 1
second to choose TSC-based time synchronization.
To find out which synchronization method was used, navigate to the Analysis
Summary tab of an added report and check the Report alignment source
property of a target. Note, that the first report won’t have this parameter.
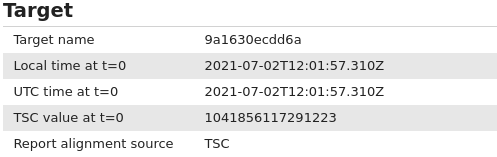

When loading multiple reports into a single timeline, it is always advisable to first check that time synchronization looks correct, by zooming into synchronization or communication events that are expected to be aligned.
Timeline Hierarchy#
When reports are added to the same timeline Nsight Systems will automatically
line them up by timestamps as described above. If you want Nsight Systems to
also recognize matching process or hardware information, you will need to set
environment variables NSYS_SYSTEM_ID and NSYS_HW_ID as shown below at
the time of report collection (such as when using the “nsys profile …” command).
When loading a pair of given report files into the same timeline, they will be merged in one of the following configurations:
Different hardware — is used when reports are coming from different physical machines, and no hardware resources are shared in these reports. This mode is used when neither
NSYS_HW_IDorNSYS_SYSTEM_IDis set and target hostnames are different or absent, and can be additionally signalled by specifying differentNSYS_HW_IDvalues.Different systems, same hardware — is used when reports are collected on different virtual machines (VMs) or containers on the same physical machine. To activate this mode, specify the same value of
NSYS_HW_IDwhen collecting the reports.Same system — is used when reports are collected within the same operating system (or container) environment. In this mode a process identifier (PID) 100 will refer to the same process in both reports. To manually activate this mode, specify the same value of
NSYS_SYSTEM_IDwhen collecting the reports. This mode is automatically selected when target hostnames are the same and neitherNSYS_HW_IDorNSYS_SYSTEM_IDis provided.
The following diagrams demonstrate typical cases:
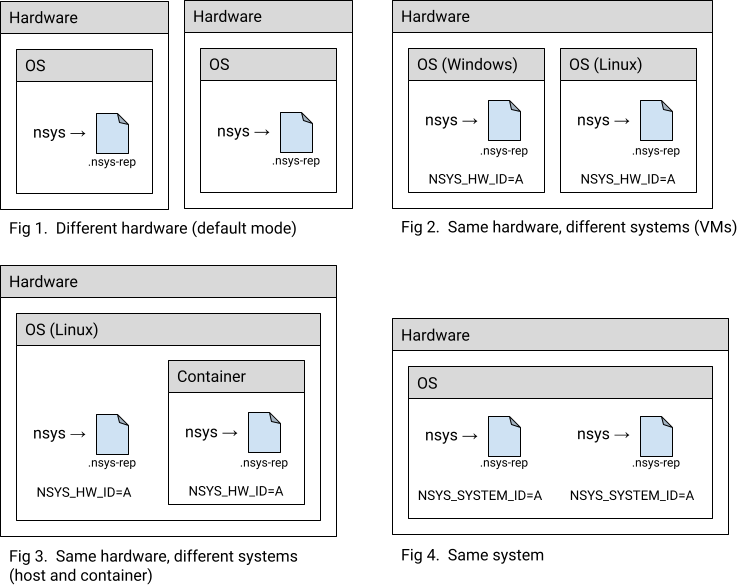
Example: MPI#
A typical scenario is when a computing job is run using one of the MPI implementations. Each instance of the app can be profiled separately, resulting in multiple report files. For example:
# Run MPI job without the profiler:
mpirun <mpirun-options> ./myApp
# Run MPI job and profile each instance of the application:
mpirun <mpirun-options> nsys profile -o report-%p <nsys-options>./myApp
When each MPI rank runs on a different node, the command above works fine, since the default pairing mode (different hardware) will be used.
When all MPI ranks run the localhost only, use this command (value “A” was chosen arbitrarily, it can be any non-empty string):
NSYS_SYSTEM_ID=A mpirun <mpirun-options> nsys profile -o report-%p < nsys -options> ./myApp
For convenience, the MPI rank can be encoded into the report filename. For Open MPI, use the following command to create report files based on the global rank value:
mpirun <mpirun-options> nsys profile -o report-%q{OMPI_COMM_WORLD_RANK} < nsys -options> ./myApp
MPICH-based implementations set the environment variable PMI_RANK and Slurm
(srun) provides the global MPI rank in SLURM_PROCID.
Limitations on Syncing Multiple Reports in Timeline#
Only report files collected with Nsight Systems version 2021.3 and newer are fully supported.
Sequential reports collected in a single CLI profiling session cannot be loaded into a single timeline yet.
Add-on Graphs - Flame Graph#
The generation of Flame Graphs from Nsight Systems reports is not a built-in
feature, but it is possible to create such graphs from Nsight Systems reports
with the script stackcollapse_nsys.py located at
<nsys-install-dir>/<host-folder>/Scripts/Flamegraph.
There is also a README.md file at that location with
additional usage details.
Requirements:
flamegraph.plfrom Brendan Gregg’s FlameGraph github,Perl
Usage
Generating flamegraph from Nsight Systems report file on Linux:
python3 stackcollapse_nsys.py report.nsys-rep | ./flamegraph.pl > result_flamegraph.svg
Generating flamegraph from Nsight Systems report file on Windows:
PowerShell -Command "python stackcollapse_nsys.py report.nsys-rep | perl flamegraph.pl > result_flamegraph.svg"
The script exports the report to SQLite, queries the CPU samples and passes them as input to flamegraph.pl.
Parameters
The following parameters can be passed to the script:
Short |
Long |
Default |
Switch Description |
|---|---|---|---|
|
Current Nsight Systems CLI installation location |
Path to the Nsight Systems CLI directory (e.g., |
|
-o |
|
Output is written to stdout |
Path to a result file containing a data suitable for |
|
False |
Use full function names with return type, arguments and expanded templates, if available. |
Note
By default, the script tries to shorten function definitions (eliminating
return type, arguments and templates). In some complex cases
shortening may fail and return a full function definition. To disable
shortening defining --full_function_names=False argument can be used.
Here is an example of a Flame Graph generated from an Nsight Systems report. The program was a debug build of GROMACS, running on two ranks, each running two OpenMP threads.
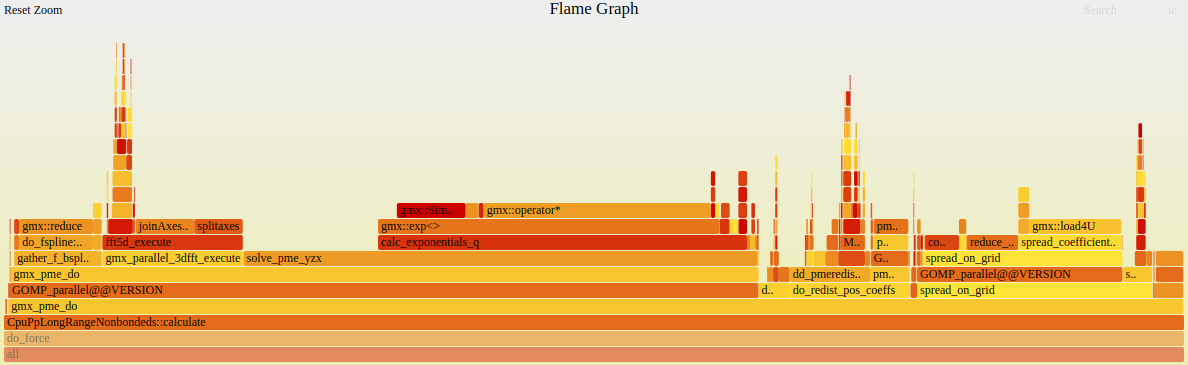
Visual Studio Integration#
NVIDIA Nsight Integration is a Visual Studio extension that allows you to access the power of Nsight Systems from within Visual Studio.
When Nsight Systems is installed along with NVIDIA Nsight Integration, Nsight Systems activities will appear under the NVIDIA Nsight menu in the Visual Studio menu bar. These activities launch Nsight Systems with the current project settings and executable.
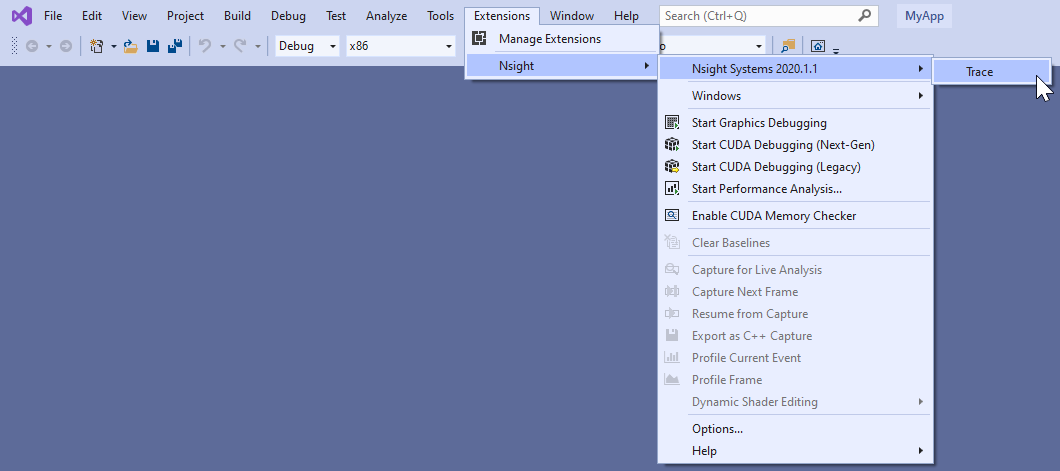
Selecting the “Trace” command will launch Nsight Systems, create a new Nsight Systems project and apply settings from the current Visual Studio project:
Target application path
Command line parameters
Working folder
If the “Trace” command has already been used with this Visual Studio project then Nsight Systems will load the respective Nsight Systems project and any previously captured trace sessions will be available for review using the Nsight Systems project explorer tree.
For more information about using Nsight Systems from within Visual Studio, please visit
Troubleshooting#
General Troubleshooting#
Profiling
If the profiler behaves unexpectedly during the profiling session, or the profiling session fails to start, try the following steps:
Close the host application.
Restart the target device.
Start the host application and connect to the target device.
Nsight Systems uses a settings file (NVIDIA Nsight Systems.ini) on the host
to store information about loaded projects, report files, window layout
configuration, etc. Location of the settings file is described in the
Help → About dialog. Deleting the settings file will restore Nsight Systems
to a fresh state, but all projects and reports will disappear from the Project
Explorer.
Profiling Games
In launcher-based platforms (like Steam), if you attempt to run the game executable directly from Nsight Systems the game will detect that the launcher is missing. It will therefore launch the launcher and then self-terminate.
To avoid this, Nsight Systems on Windows automatically attaches to child processes spawned by the target process that Nsight Systems launched. Instead of setting Nsight Systems to launch the game, set Nsight Systems to launch the game platform client, and use the client GUI to launch the game.
Nsight Systems is configured to ignore the game platform client and launcher apps, and will attach to the game executable that the client launches.
An example workflow:
Verify the Steam client is not running. Select the Quit command to terminate Steam if it is running.
Configure Nsight Systems to launch the Steam client with a manual collection option. It is recommended you check the hotkey checkbox to begin data collection from within the game without requiring you to switching window focus.
Click Start. Nsight Systems will launch the Steam client.
Use Steam GUI to launch the game.
When the game is running and you have reached the scene you want to profile, press the
F12hotkey to start Nsight Systems data collection. Let the game continue running while Nsight Systems collects its profiling data (typically 10-60 seconds, or however long is relevant for you). PressF12again to end the collection.
Environment Variables
By default, Nsight Systems writes temporary files to /tmp directory. If you
are using a system that does not allow writing to /tmp or where the /tmp
directory has limited storage you can use the TMPDIR environment variable to set
a different location. An example:
TMPDIR=/testdata ./bin/nsys profile -t cuda matrixMul
Environment variable control support for Windows target trace is not available, but there is a quick workaround:
Create a batch file that sets the env vars and launches your application.
Set Nsight Systems to launch the batch file as its target; i.e., set the project settings target path to the path of batch file.
Start the trace. Nsight Systems will launch the batch file in a new cmd instance and trace any child process it launches. In fact, it will trace the whole process tree whose root is the cmd running your batch file.
WebGL Testing
Nsight Systems cannot profile using the default Chrome launch command. To profile WebGL please follow the following command structure:
“C:\Program Files (x86)\Google\Chrome\Application\chrome.exe”
       --inprocess-gpu --no-sandbox --disable-gpu-watchdog --use-angle=gl
       https://webglsamples.org/aquarium/aquarium.html
Common Issues with QNX Targets
Make sure that
traceloggerutility is available and can be run on the target.Make sure that
/tmpdirectory is accessible and supports sub-directories.When switching between Nsight Systems versions, processes related to the previous version, including profiled applications forked by the daemon, must be killed before the new version is used. If you experience issues after switching between Nsight Systems versions, try rebooting the target.
CUDA Troubleshooting#
Flush CUDA Profile Data
To reduce profiling overhead, the profiling tools collect and record profile information into internal buffers. These buffers are then flushed asynchronously to disk with low priority to avoid perturbing application behavior. To avoid losing profile information that has not yet been flushed, the application being profiled should make sure, before exiting, that all GPU work is done (using CUDA synchronization calls), and then call cudaProfilerStop() or cuProfilerStop(). Doing so forces buffered profile information in corresponding context(s) to be flushed.
If your CUDA application includes graphics that operate using a display or main loop, care must be taken to call cudaProfilerStop() or cuProfilerStop() before the thread executing that loop calls exit(). Failure to call one of these APIs may result in the loss of some or all of the collected profile data.
For some graphics applications like the ones use OpenGL, the application exits
when the escape key is pressed. In those cases where calling the above functions
before exit is not feasible, explicitly end analysis using duration or
nsys stop. The profiler will force a data flush just before the timeout.
CLI Troubleshooting#
.nsys-rep file will not load
If you have collected a report file using the CLI and the report will not open in the GUI, check to see that your GUI version is the same or greater than the CLI version you used. If it is not, download a new version of the Nsight Systems GUI and you will be able to load and visualize your report.
This situation occurs most frequently when you update Nsight Systems using a CLI only package, such as the package available from the NVIDIA HPC SDK.
.nsys-rep file not generated
The CLI initially generates a .qdstrm file. The .qdstrm file is an intermediate result file, not intended for multiple imports. It needs to be processed. Usually this happens automatically. If it does not, you can use the standalone QdstrmImporter utility to generate an optimized .nsys-rep file. You can then use this file to visualize locally, to open the result on a different machine, or for sharing results with teammates.
The CLI and QdstrmImporter versions must match to convert a .qdstrm file into a .nsys-rep file. This .nsys-rep file can then be opened in the same version or more recent versions of the GUI.
To run QdstrmImporter on the host system, find the QdstrmImporter binary in the Host-x86_64 directory in your installation. QdstrmImporter is available for all host platforms. See options below.
To run QdstrmImporter on the target system, copy the Linux Host-x86_64 directory to the target Linux system or install Nsight Systems for Linux host directly on the target. The Windows or macOS host QdstrmImporter will not work on a Linux Target. See options below.
Short |
Long |
Parameter |
Description |
|---|---|---|---|
-h |
|
Help message providing information about available options and their parameters. |
|
-v |
|
Output QdstrmImporter version information |
|
-i |
|
filename or path |
Import .qdstrm file from this location. |
-o |
|
filename or path |
Provide a different file name or path for the resulting .nsys-rep file. Default is the same name and path as the .qdstrm file. |
Launch Processes in Stopped State#
In many cases, it is important to profile an application from the very beginning of its execution. When launching processes, Nsight Systems takes care of it by making sure that the profiling session is fully initialized before making the exec() system call on Linux.
If the process launch capabilities of Nsight Systems are not sufficient, the application should be launched manually, and the profiler should be configured to attach to the already launched process. One approach would be to call sleep() somewhere early in the application code, which would provide time for the user to attach to the process in Nsight Systems Embedded Platforms Edition, but there are two other more convenient mechanisms that can be used on Linux, without the need to recompile the application. (Note that the rest of this section is only applicable to Linux-based target devices.)
Both mechanisms ensure that between the time the process is created (and therefore its PID is known) and the time any of the application’s code is called, the process is stopped and waits for a signal to be delivered before continuing.
LD_PRELOAD#
The first mechanism uses LD_PRELOAD environment variable. It only works with dynamically linked binaries, since static binaries do not invoke the runtime linker, and therefore are not affected by the LD_PRELOAD environment variable.
For ARMv7 binaries, preload
/opt/nvidia/nsight_systems/libLauncher32.so
Otherwise if running from host, preload
/opt/nvidia/nsight_systems/libLauncher64.so
Otherwise if running from CLI, preload
[installation_directory]/libLauncher64.so
The most common way to do that is to specify the environment variable as part of the process launch command, for example:
$ LD_PRELOAD=/opt/nvidia/nsight_systems/libLauncher64.so ./my-aarch64-binary --arguments
When loaded, this library will send itself a SIGSTOP signal, which is equivalent to typing Ctrl+Z in the terminal. The process is now a background job, and you can use standard commands like jobs, fg and bg to control them. Use jobs -l to see the PID of the launched process.
When attaching to a stopped process, Nsight Systems will send SIGCONT signal, which is equivalent to using the bg command.
Launcher#
The second mechanism can be used with any binary. Use [installation_directory]/launcher to launch your application, for example:
$ /opt/nvidia/nsight_systems/launcher ./my-binary --arguments
The process will be launched, daemonized, and wait for SIGUSR1 signal. After attaching to the process with Nsight Systems, the user needs to manually resume execution of the process from command line:
$ pkill -USR1 launcher
Note
Note that pkill will send the signal to any process with the matching name. If that is not desirable, use kill to send it to a specific process. The standard output and error streams are redirected to /tmp/stdout_<PID>.txt and /tmp/stderr_<PID>.txt.
The launcher mechanism is more complex and less automated than the LD_PRELOAD option, but gives more control to the user.
GUI Troubleshooting#
Empty or Black Pages in Analysis or Diagnostics Summary#
If the Analysis Summary or Diagnostics Summary pages appear empty or black when running Nsight Systems, this may be caused by rendering issues, often related to drivers for OpenGL or Vulkan.
To resolve this, try running Nsight Systems with the following command:
QTWEBENGINE_CHROMIUM_FLAGS="--no-sandbox" QMLSCENE_DEVICE=softwarecontext [installation_path]/host-linux-[arch]/nsys-ui
xcb-cursor0 or libxcb-cursor0 is needed to load the Qt xcb platform plugin#
If you encounter the following error, you may be missing the required xcb-cursor package:
qt.qpa.plugin: From 6.5.0, xcb-cursor0 or libxcb-cursor0 is needed to load the Qt xcb platform plugin.
This issue typically occurs on RHEL but may also affect other distributions. To resolve it, install the required xcb-cursor package based on your OS:
RHEL/CentOS/Fedora:
sudo dnf install -y xcb-util-cursor
OpenSUSE:
sudo dnf install -y xcb-util-cursor
Debian/Ubuntu:
sudo apt-get install -y libxcb-cursor0
Other Libraries Loading Errors#
If opening the Nsight Systems Linux GUI fails with one of the following errors, you may be missing some required libraries:
This application failed to start because it could not find or load the Qt platform plugin "xcb" in "". Available platform plugins are: xcb. Reinstalling the application may fix this problem.
or
error while loading shared libraries: [library_name]: cannot open shared object file: No such file or directory
Ubuntu and CentOS With Root Privileges#
Launch the following command, which will install all the required libraries in system directories:
[installation_path]/host-linux-[arch]/Scripts/DependenciesInstaller/install-dependencies.sh
Launch the Linux GUI as usual.
Ubuntu and CentOS Without Root Privileges#
Choose the directory where dependencies will be installed (
dependencies_path). This directory should be writeable for the current user.Launch the following command (if it has already been run, move to the next step), which will install all the required libraries in
[dependencies_path]:[installation_path]/host-linux-[arch]/Scripts/DependenciesInstaller/install-dependencies-without-root.sh [dependencies_path]
Further, use the following command to launch the Linux GUI:
source [installation_path]/host-linux-[arch]/Scripts/DependenciesInstaller/setup-dependencies-environment.sh [dependencies_path] && [installation_path]/host-linux-[arch]/nsys-ui
Other platforms, or if the previous steps did not help#
Launch Nsight Systems using the following command line to determine which libraries are missing and install them.
$ QT_DEBUG_PLUGINS=1 [installation_path]/host-linux-[arch]/nsys-ui
If the workload does not run when launched via Nsight Systems or the timeline is empty, check the stderr.log and stdout.log (click on drop-down menu showing Timeline View and click on Files) to see the errors encountered by the app.
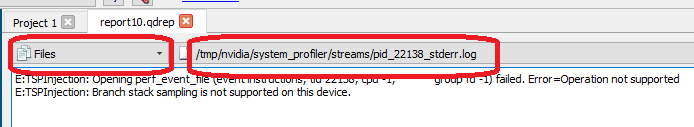
Symbol Resolution#
If stack trace information is missing symbols and you have a symbol file, you can manually re-resolve using the ResolveSymbols utility. This can be done by right-clicking the report file in the Project Explorer window and selecting “Resolve Symbols…”.
Alternatively, you can find the utility as a separate executable in the [installation_path]\Host directory. This utility works with ELF format files, with Linux Debuginfod cache directories and Linux/QNX symbol servers, with Windows PDB directories and symbol servers, or with files where each line is in the format <start><length><name>.
Short |
Long |
Argument |
Description |
|---|---|---|---|
-h |
|
Help message providing information about available options. |
|
-l |
|
Print global process IDs list |
|
-s |
|
filename |
Path to symbol file |
-b |
|
address |
If set then <start> in symbol file is treated as relative address starting from this base address |
-p |
|
pid |
Which process in the report should be resolved. May be omitted if there is only one process in the report. |
-f |
|
This option forces use of a given symbol file. |
|
-i |
|
filename |
Path to the report with unresolved symbols. |
-o |
|
filename |
Path and name of the output file. If it is omitted then “resolved” suffix is added to the original filename. |
-d |
|
directory paths |
List of symbol folder paths, separated by semi-colon characters. Available only on Windows. |
-v |
|
server URLs |
Windows: list of symbol servers that uses the same format as Linux: list of Linux/QNX symbol servers separated by commas, i.e. |
-n |
|
Ignore the symbol locations stored in the |
Broken Backtraces on Tegra#
In Nsight Systems Embedded Platforms Edition, in the symbols table there is a special entry called Broken backtraces. This entry is used to denote the point in the call chain where the unwinding algorithms used by Nsight Systems could not determine what is the next (caller) function.
Broken backtraces happen because there is no information related to the current function that the unwinding algorithms can use. In the Top-Down view, these functions are immediate children of the Broken backtraces row.
One can eliminate broken backtraces by modifying the build system to provide at least one kind of unwind information. The types of unwind information, used by the algorithms in Nsight Systems, include the following:
For ARMv7 binaries:
DWARF information in ELF sections:
.debug_frame,.zdebug_frame,.eh_frame,.eh_frame_hdr. This information is the most precise..zdebug_frameis a compressed version of.debug_frame, so at most one of them is typically present..eh_frame_hdris a companion section for.eh_frameand might be absent.Compiler flag:
-g.Exception handling information in EHABI format provided in
.ARM.exidxand.ARM.extabELF sections..ARM.extabmight be absent if all information is compact enough to be encoded into.ARM.exidx.Compiler flag:
-funwind-tables.Frame pointers (built into the
.textsection).Compiler flag:
-fno-omit-frame-pointer.
For Aarch64 binaries:
DWARF information in ELF sections:
.debug_frame,.zdebug_frame,.eh_frame,.eh_frame_hdr. See additional comments above.Compiler flag:
-g.Frame pointers (built into the
.textsection).Compiler flag:
-fno-omit-frame-pointer.
The following ELF sections should be considered empty if they have size of 4 bytes: .debug_frame, .eh_frame, .ARM.exidx. In this case, these sections only contain termination records and no useful information.
For GCC, use the following compiler invocation to see which compiler flags are enabled in your toolchain by default (for example, to check if -funwind-tables is enabled by default):
$ gcc -Q --help=common
For GCC and Clang, add -### to the compiler invocation command to see which compiler flags are actually being used.
Since EHABI and DWARF information is compiled on per-unit basis (every .cpp or .c file, as well as every static library, can be built with or without this information), presence of the ELF sections does not guarantee that every function has necessary unwind information.
Frame pointers are required by the Aarch64 Procedure Call Standard. Adding frame pointers slows down execution time, but in most cases the difference is negligible.
Debug Versions of ELF Files#
Often, after a binary is built, especially if it is built with debug information (-g compiler flag), it gets stripped before deploying or installing. In this case, ELF sections that contain useful information, such as non-export function names or unwind information, can get stripped as well.
One solution is to deploy or install the original unstripped library instead of the stripped one, but in many cases this would be inconvenient. Nsight Systems can use missing information from alternative locations.
For target devices with Ubuntu, see Debug Symbol Packages. These packages typically install debug ELF files with /usr/lib/debug prefix. Nsight Systems can find debug libraries there, and if it matches the original library (e.g., the built-in BuildID is the same), it will be picked up and used to provide symbol names and unwind information.
Many packages have debug companions in the same repository and can be directly installed with APT (apt-get). Look for packages with the -dbg suffix. For other packages, refer to the Debug Symbol Packages wiki page on how to add the debs package repository. After setting up the repository and running apt-get update, look for packages with -dbgsym suffix.
To verify that a debug version of a library has been picked up and downloaded from the target device, look in the Module Summary section of Analysis Summary:
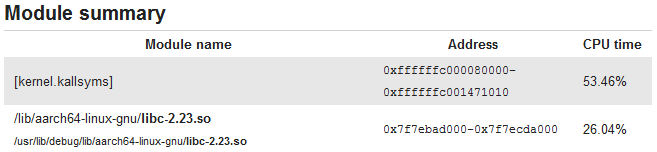
Logging#
To enable logging on the host, refer to this config file:
host-linux-x64/nvlog.config.template
When reporting any bugs please include the build version number as described in the Help → About dialog. If possible, attach log files and report (.nsys-rep) files, as they already contain necessary version information.
Verbose Remote Logging on Linux Targets#
Verbose logging is available when connecting to a Linux-based device from the GUI on the host. This extra debug information is not available when launching via the command line. Nsight Systems installs its executable and library files into the following directory:
/opt/nvidia/nsight_systems/
To enable verbose logging on the target device, when launched from the host, follow these steps:
Close the host application.
Restart the target device.
Place
nvlog.configfrom host directory to the/opt/nvidia/nsight_systemsdirectory on target.From SSH console, launch the following command:
sudo /opt/nvidia/nsight_systems/nsys --daemon --debug
Start the host application and connect to the target device.
Logs on the target devices are collected into this file (if enabled):
nsys.log
in the directory where nsys command was launched.
Please note that in some cases, debug logging can significantly slow down the profiler.
Verbose CLI Logging on Linux Targets#
To enable verbose logging of the Nsight Systems CLI and the target application’s injection behavior:
In the target-linux-x64 directory, rename the nvlog.config.template file to nvlog.config.
Inside that file, change the line:
$ nsys-ui.log
to:
$ nsys-agent.log
Run a collection, either explicitly giving the path to the config file or with the config file in the same directory with the application. The
target-linux-x64directory will then include a file namednsys-agent.log.
nsys profile --trace=osrt \
   --env-var=NVLOG_CONFIG_FILE="<install-dir>/target-linux-x64/nvlog.config" \
   sleep 1
Note
In some cases, debug logging can significantly slow down the profiler.
Verbose Logging on Windows Targets#
Verbose logging is available when connecting to a Windows-based device from the GUI on the host. Nsight Systems installs its executable and library files into the following directory by default:
C:\Program Files\NVIDIA Corporation\Nsight Systems 2023.3
To enable verbose logging on the target device, when launched from the host, follow these steps:
Close the host application.
Terminate the
nsysprocess.Place
nvlog.configfrom host directory next to Nsight Systems Windows agent on the target device.Local Windows target:
C:\Program Files\NVIDIA Corporation\Nsight Systems 2023.3\target-windows-x64
Remote Windows target:
C:\Users\<user name>\AppData\Local\Temp\nvidia\nsight_systems
Start the host application and connect to the target device.
Logs on the target devices are collected into this file (if enabled):
nsight-sys.log
in the same directory as Nsight Systems Windows agent.
Note
In some cases, debug logging can significantly slow down the profiler.
Other Resources#
Looking for information to help you use Nsight Systems the most effectively? Here are some more resources you might want to review:
Training Seminars#
NVIDIA Deep Learning Institute Training - Self-Paced Online Course - Nsight Analysis System: Build Custom Python Analysis Scripts
NVIDIA Deep Learning Institute Training - Self-Paced Online Course - Optimizing CUDA Machine Learning Codes With Nsight Profiling Tools
CUDA Developer Tools YouTube Channel - Intro to NVIDIA Nsight Systems
2018 NCSA Blue Waters Webinar - Video Only - Introduction to NVIDIA Nsight Systems
Blog Posts#
NVIDIA developer blogs
These are longer form, technical pieces written by tool and domain experts.
2021 : Optimizing DX12 Resource Uploads to the GPU Using CPU-Visible VRAM
2020 : Understanding the Visualization of Overhead and Latency in Nsight Systems
2019 : Migrating to NVIDIA Nsight Tools from NVVP and nvprof
2019 : Transitioning to Nsight Systems from NVIDIA Visual Profiler / nvprof
External Blog Posts
2025 : Practical ML, Speed Up PyTorch Training by 3x with NVIDIA Nsight and PyTorch 2.0 Tricks
Feature Videos#
Short videos, only a minute or two, to introduce new features.
Conference Presentations#
GTC 2025 - Optimizing Multi-Language Scientific Simulations: A Grace Superchip Case Study
GTC 2024 - Achieving Higher Performance From Your Data Center and Cloud Application
Jetson Edge AI Developer Days 2023 - Getting the Most Out of Your Jetson Orin Using NVIDIA Nsight Developer Tools
GTC 2023 - Optimizing at Scale: Investigating Hidden Bottlenecks for Multi-Node Workloads
GTC 2023 - Optimize Multi-Node System Workloads With NVIDIA Nsight Systems
GTC 2023 - Ray-Tracing Development using NVIDIA Nsight Graphics and NVIDIA Nsight Systems
GTC 2022 - Optimizing Communication with Nsight Systems Network Profiling
GTC 2022 - Optimizing Vulkan 1.3 Applications with Nsight Graphics & Nsight Systems
GTC 2021 - Tuning GPU Network and Memory Usage in Apache Spark
GTC 2020 - Scaling the Transformer Model Implementation in PyTorch Across Multiple Nodes
GTC 2019 - Using Nsight Tools to Optimize the NAMD Molecular Dynamics Simulation Program
GTC 2018 - Optimizing HPC Simulation and Visualization Codes Using NVIDIA Nsight Systems
GTC 2018 - Israel - Boost DNN Training Performance using NVIDIA Tools
Siggraph 2018 - Taming the Beast; Using NVIDIA Tools to Unlock Hidden GPU Performance
For More Support#
To file a bug report or to ask a question on the Nsight Systems forums, you will need to register with the NVIDIA Developer Program. See the FAQ. You do not need to register to read the forums.
After that, you can access Nsight Systems Forums and the NVIDIA Bug Tracking System.
To submit feedback directly from the GUI, go to Help->Send Feedback and fill out the form. Enter your email address if you would like to hear back from the Nsight Systems team.