1. Walkthrough: Debugging a CUDA Application
In the following walkthrough, we present some of the more common procedures that you might use to debug a CUDA-based application. We use a sample application called Matrix Multiply as an example. NVIDIA Nsight Visual Studio Edition includes this sample application.
For the purpose of this walkthrough, we are going to assume that the application is debugged remotely (the NVIDIA Nsight VSE host software running on a machine with Visual Studio, and the Nsight Monitor running on a separate machine).[1]
[1] Note that the Next-Gen CUDA debugger only supports local debugging. Remote debugging is not currently supported.
1.1. Open the Sample Project and Set Breakpoints
-
Open the sample project in the CUDA SDK called matrixMul.
For assistance in locating sample applications, see Working with Samples.
You might notice that there are other sample projects with similar names: matrixMul_nvrtc, matrixMul_CUBLAS, matrixMultDrv. The project we use in this example uses the CUDA Runtime API.
Note:
NOTE that this file contains code for the CPU (i.e. matrixMultiply()) and GPU (i.e. matrixMultiplyCUDA(), any function specified with a __global__ or __device__ keyword).
The Legacy CUDA debugger only supports debugging GPU CUDA kernels
The Next-Gen CUDA debugger allows you to debug both CPU and GPU code.
-
First, let's set some breakpoints in GPU code.
-
Open the file called matrixMul.cu, and find the CUDA kernel function matrixMulCUDA().
-
Set a breakpoint at:
int aStep = BLOCK_SIZE
-
Set another breakpoint at the statement that begins with:
for {int a = aBegin, b = bBegin;
-
-
Now, let's set some breakpoints in CPU code:
-
In the same file, matrixMul.cu, find the CPU function matrixMultiply().
-
Set one breakpoint at:
if (block_size == 16)
-
Set another breakpoint at the statement that begins with:
printf("done\n");
-
In this section of the walkthrough, you opened the sample project and set breakpoints. Next, we build the sample project and start the debugging session.
1.2. Configure for Local or Remote Debugging
-
Initialize the target machine.
Note:
If you are using the Legacy CUDA debugger on a single machine:
Nsight Monitor will be launched automatically for you. You can skip this step.
If you are using the Next-Gen CUDA debugger:
Remote debugging is not currently supported. The target machine is assumed to be localhost. Please go to Build the Sample and Launch the Debugger.
On the target machine, start the Nsight Monitor.
-
On the target machine, click the Windows Start menu.
-
Select All Programs > NVIDIA Corporation > Nsight Visual Studio Edition2020.1 > Nsight Monitor.
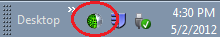
The Nsight Monitor starts. The Nsight Monitor icon appears in the system tray.
-
-
On the host machine, configure the project for local or remote debugging.
-
In the Solution Explorer, right-click on the project name matrixMul, and select Nsight User Properties. (As an alternative, you can also go to the Project menu > Nsight User Properties.)
The User Settings window appears.
-
In the left pane, choose Launch.
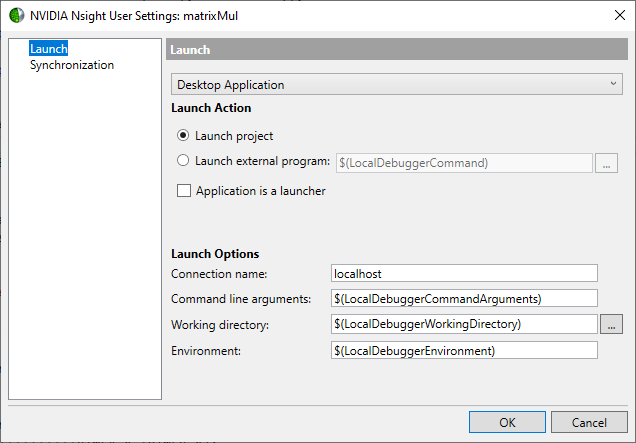
Local target (default) settings
-
For remote debugging, you can change the Connection name field by replacing localhost with the address of your target machine (the remote computer where the application to be debugged will run). This can be the IP address of the machine on your local network, or the machine name as recognized on your network (see Recommended IP Address Formatting for more information).
IMPORTANT: Do not use a mapped drive to specify the hostname. For example:
WRONG: M:\ CORRECT: jsmith.mydomain.com
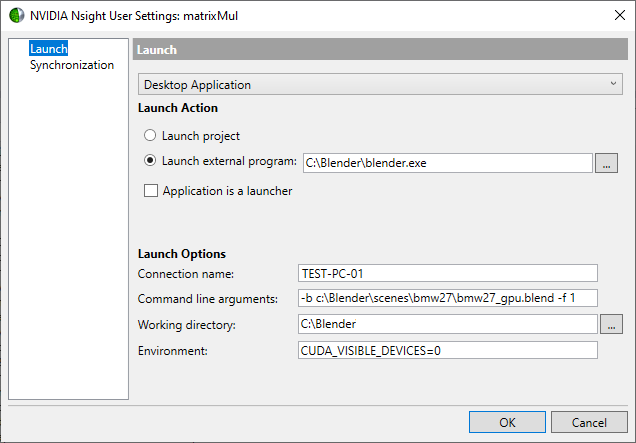
Remote Target: TEST-PC-01
You can optionally update the default:
-
Working directory — You can specify the directory you want the target application to use as its working directory. The default working directory is the project directory
-
Command line arguments — specified with a file in the working directory, or directly in this field.
-
Environment — specify environment variables and their values.
The debugger will pickup the environment block from the local debugging option in VS properties, when $(Environment) is set in the environment field.
-
Launch Action
-
Launch Project — launches the current project's executable
-
Launch external program — for late debugger attachment
Note: Next-Gen CUDA Debugger does not currently support late attach.
-
Application is a launcher — for late debugger attachment to a program launched by another program (ie. game engine).
Note: Next-Gen CUDA Debugger does not currently support late attach.
-
-
-
Click OK
-
-
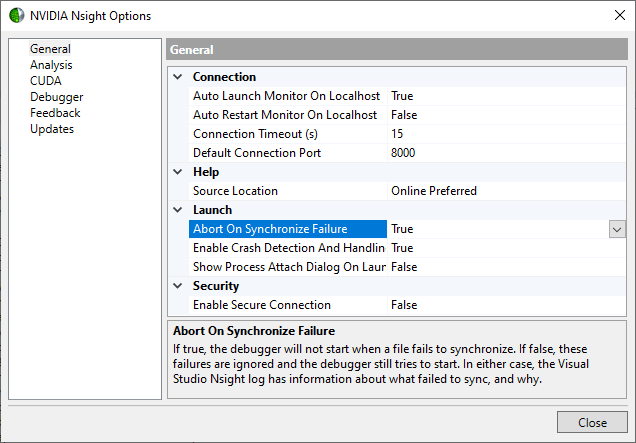
Optional: when remote debugging, to abort the launch when a file fails to copy to the remote system, set the Abort on synchronize failure option to "True."
Note:
If you are using the Next-Gen CUDA debugger:
The Connection, Launch, and Security options are not currently supported. Please go to Build the Sample and Launch the Debugger.
-
From the Nsight menu, select Nsight Options. The Nsight Options window opens.
-
In the left hand pane, select General.
-
Under the Launch section, set Abort on synchronize failure to True.
-
Click the OK button.
-
-
Configure the Legacy CUDA Debugger and Legacy CUDA Memory Checker properties.
Note:
If you are using the Next-Gen CUDA debugger:
These options are not currently supported. Please go to Build the Sample and Launch the Debugger.
-
From the Nsight menu select Nsight Options. The Nsight Options window opens.
-
In the left-hand pane, select CUDA.
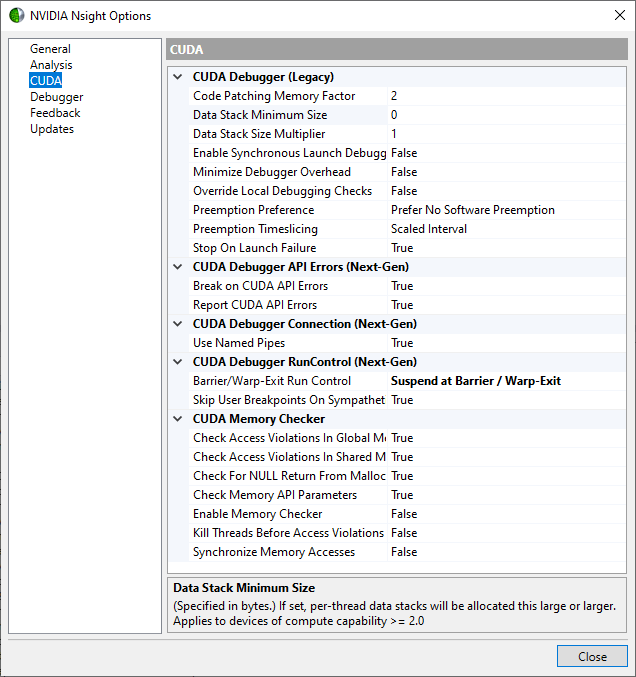
-
Configure the Legacy CUDA settings to suit your debugging needs.
Note:
NOTE on the CUDA Data Stack feature:
On newer architectures, each GPU thread has a private data stack. Normally the required data stack size is determined by the compiler, and usually the driver's default size is greater than what a kernel will require.
However, if a kernel uses a recursive function, the compiler cannot statically determine the data stack size. In such cases the application must call cuCtxGetLimit() and cuCtxSetLimit() with CU_LIMIT_STACK_SIZE to ensure adequate stack space.
Setting CU_LIMIT_STACK_SIZE is normally the responsibility of the application, for release-compiled kernels.
Since debug-compiled kernels require extra stack space, the application would require different stack size settings for debug and release.
As a convenience, and to avoid polluting application code with debug-kernel-specific code, we have added settings to the CUDA Debugger that will automatically increase your stack size settings while debugging.
-
1.3. Build the Sample and Launch the Debugger
-
On the host machine, build the matrixMul project.
-
From the Visual Studio Build menu, select Rebuild matrixMul.
NVIDIA Nsight VSE builds the project.
Note:
You must use the following nvcc compiler switch to generate symbolics information for CUDA kernels:
-G
When debugging native CPU code (requires the Next-Gen Debugger), you should also use the -g, -0 nvcc compiler flags to generate unoptimized code with symbolics information.
-
View the output window for error messages. If the project built successfully, go to the next step. If the project did not build, you need to correct the problem before going to the next step.
-
From the Nsight menu, choose
-
Start CUDA Debugging (Legacy)
-
Start CUDA Debugging (Next-Gen)
For information on choosing the correct debugger for your system configuration see the System Requirements page.
Alternatively, you can also choose to:
-
Right-click on the project, and select Debug > Start CUDA Debugging (Legacy)/(Next-Gen)
-
Click on the Start CUDA Debugging (Legacy)/(Next-Gen) toolbar icon.
Show/hide this icon group by right-clicking on the Visual Studio toolbar and toggling Nsight CUDA Debug.
-
Click on the Start CUDA Debugging (Legacy)/(Next-Gen) toolbar menu item.
Show/hide this icon group by right-clicking on the Visual Studio toolbar and toggling Nsight Connections.
-
-
-
If you started Legacy CUDA debugging:
-
You'll notice that on the host machine, a pop-up message indicates that a connection has been made.
-
Note that with a remote debugging configuration, the Nsight Monitor must be started prior to debugging. However, in a local debugging setup, the Nsight Monitor will launch automatically when the CUDA Debugger is started.
-
You've started the debugging session. In the next section of this walkthrough, we'll look at some of the windows that you typically inspect during a debugging session.
Edit the .cu File Properties
In Visual Studio, you may have a dependency fail because the properties of the .cu file are configured incorrectly. To workaround this issue, use the following steps.
-
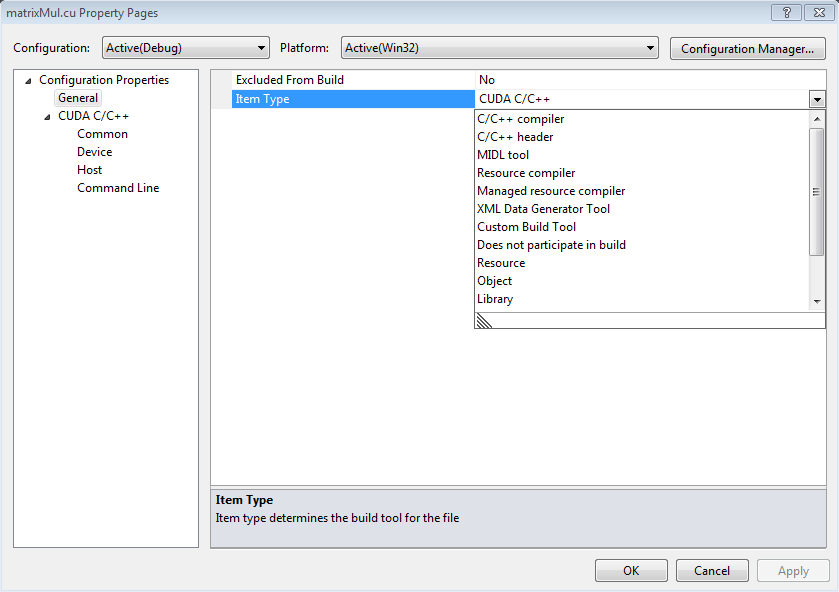
Right-click on the included .cu file and select Properties.
-
Change Item Type to C/C++ header.
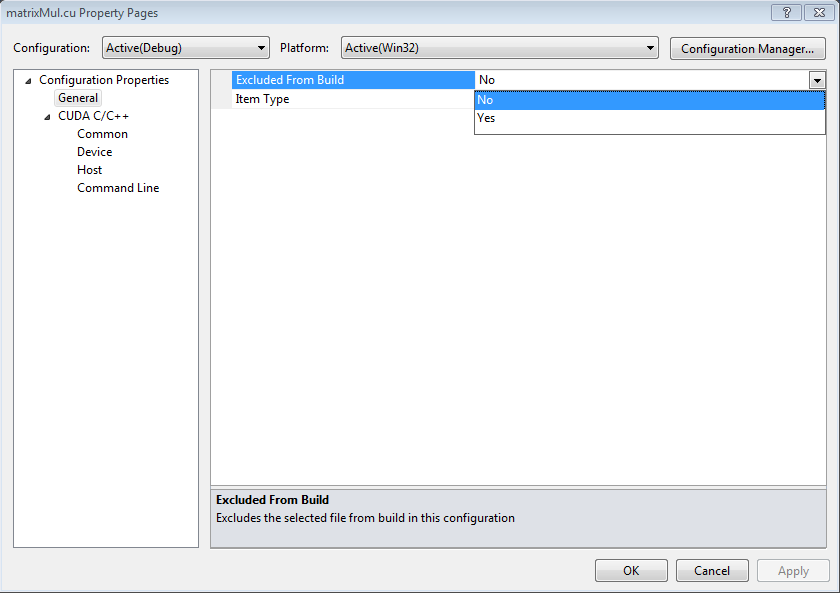
-
Ensure that the Excluded from Build property is set to No.
Inspect Values of Variables
-
Start the CUDA Debugger.
-
From the Nsight menu in Visual Studio, select either:
-
Start CUDA Debugging (Next-Gen)
-
Start CUDA Debugging (Legacy)
For information on choosing the correct debugger for your system configuration, see System Requirements.
Alternatively, you can also choose to:
-
Right-click on the project, and select Debug > Start CUDA Debugging (Legacy)/(Next-Gen)
-
Click on the Start CUDA Debugging (Legacy)/(Next-Gen) toolbar icon.
Show/hide this icon group by right-clicking on the Visual Studio toolbar and toggling Nsight CUDA Debug.
-
Click on the Start CUDA Debugging (Legacy)/(Next-Gen) toolbar menu item.
Show/hide this icon group by right-clicking on the Visual Studio toolbar and toggling Nsight Connections.
-
-
-
-
From the Debug menu, choose Windows > Locals.
The Locals window opens. The Locals window displays the variables and their values in the current lexical scope.
NOTE: You cannot change the value in GPU memory by editing the value in the Locals window.
Inspect Values in Memory
-
Start the CUDA Debugger.
-
From the Nsight menu in Visual Studio, choose either:
-
Start CUDA Debugging (Next-Gen)
-
Start CUDA Debugging (Legacy)
For information on choosing the correct debugger for your system configuration, see System Requirements.
Alternatively, you can also choose to:
-
Right-click on the project, and select Debug > Start CUDA Debugging (Legacy)/(Next-Gen)
-
Click on the Start CUDA Debugging (Legacy)/(Next-Gen) toolbar icon.
Show/hide this icon group by right-clicking on the Visual Studio toolbar and toggling Nsight CUDA Debug.
-
Click on the Start CUDA Debugging (Legacy)/(Next-Gen) toolbar menu item.
Show/hide this icon group by right-clicking on the Visual Studio toolbar and toggling Nsight Connections.
-
-
-
-
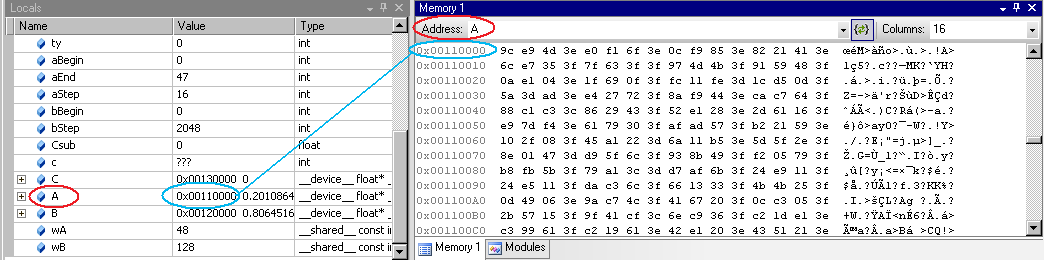
From the Debug menu, choose Windows > Memory > Memory Window 1.
The Memory window opens.
-
Click and drag a variable from the Locals window onto the Memory window.
The memory window displays the values at the address that corresponds to the variable (or pointer).
-
When viewing memory in __local__, __const__ or __shared__ make sure the Visual Studio Memory view is set to Re-evaluate automatically. This will ensure that the memory shown is for the correct memory space. Without this, the display can change to an address which defaults to global memory.
|
Note: |
You cannot change the value in GPU memory by editing the value in the Memory window. |
2. Tutorial: Using the CUDA Debugger
In the following tutorial we look at how to use some of the basic features of the CUDA Debugger. For the purpose of this tutorial, we use a sample application called Matrix Multiply, but you can follow the same procedures, using your own source.
This tutorial covers how to debug an application locally. This means that you will need to have the NVIDIA Nsight VSE host software running on a machine with Visual Studio, and have the Nsight Monitor also running on the same machine.
Make sure that the machine you use meets the system requirements. For more information, see System Requirements for NVIDIA Nsight Software.
That will be our first exercise in this tutorial: configuring a machine for local debugging. In this tutorial:
-
EXERCISE 1: Open A Project And Build The Executable
-
EXERCISE 2: Set Breakpoints
-
EXERCISE 3: Run The CUDA Debugger And Inspect Variables
-
EXERCISE 4: Run The Memory Checker
2.1. EXERCISE 1: Open a Project and Build an Executable
Let's open the sample project matrixMul. This is a simple CUDA-based application that multiplies 2 matrices. The algorithms in the source code are relatively simple, but will still give you a sense of how the CUDA Debugger works. The matrixMul application is included with the NVIDIA Nsight VSE software.
Make sure that you understand the importance of using a CUDA Toolkit that works with NVIDIA Nsight VSE.
|
Note: |
CUDA Toolkit: In order to use a project with the NVIDIA Nsight VSE tools, we recommend that you use the compiler that ships with the tools. The default installation directory for this version of the compiler is: C:\Program Files\NVIDIA GPU Computing Toolkit\CUDA The compiler is in a subdirectory labeled by its version, such as: ...\<version_number>\bin\nvcc.exe The NVIDIA Nsight VSE tools work best with this version of the compiler. However, the tools also work with the standard toolkit. Whichever compiler you use, the CUDA Toolkit that you use to compile your CUDA C code must support the following switch to generate symbolics information for CUDA kernels: -G. It is also recommended that you use the -g -0 nvcc flags to generate unoptimized code with symbolics information for the native host side code, when using the Next-Gen Debugger. |
-
Open the sample project called matrixMul.
-
From the Windows Start menu, select All Programs > NVIDIA Corporation > Nsight Visual Studio Edition2020.1 > Browse NVIDIA Nsight VSE Code Samples.
-
Here you will find the ZIP file of the NVIDIA Nsight VSE sample projects. Choose a location to unzip the files.
-
Browse to the CUDA >Debugging > Matrix Multiply folder.
-
Double-click on the file:
matrixMul_vc100.vcpxroj
-
Visual Studio starts. The matrixMul project opens. You might notice that there is another sample project with a similar name, Matrix Multiply (Driver API). This project uses the CUDA driver API. The project we use in this example uses CUDART (CUDA Runtime API).
-
-
Alternatively, you can open the matrixMul project from within Visual Studio.
-
From the Nsight menu, choose Help > Samples.
-
This will also open the ZIP file for the sample projects. Choose a location to unzip the files.
-
Follow the steps outlined above to open the matrixMul project file.
-
-
Build the matrixMul project.
-
From the Visual Studio Build menu, select Rebuild matrixMul. NVIDIA Nsight VSE builds the project.
-
View the output window for error messages. If the project built successfully, go to the next step. If the project did not build, you need to correct the problem before going to the next step.
-
You have now successfully opened the project and built the matrixMul executable.
2.2. EXERCISE 2: Set Breakpoints
Before we run the matrixMul application, let's set some breakpoints at key places in the source code. This will cause the CUDA Debugger to pause execution of the target application at those points, and give us an opportunity to inspect the values of variables and the state of each thread.
-
Open the file called matrixMul_kernel.cu.
-
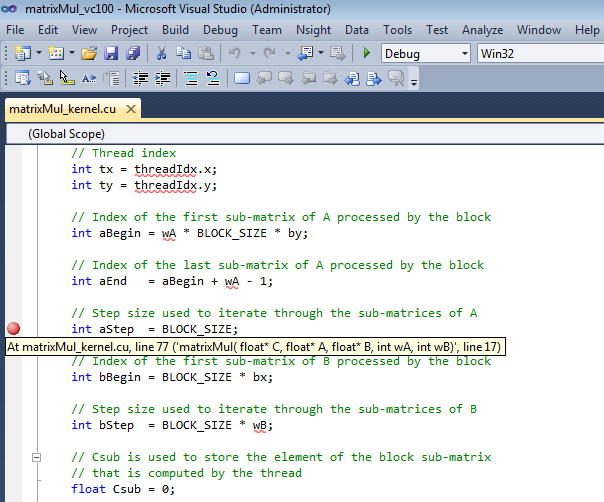
Set a breakpoint in matrixMul_kernel.cu at the statement:
int aBegin = wA * BLOCK_SIZE * by;
You can also use any of the other various methods that Visual Studio provides to set breakpoints. Visual Studio marks the location of the breakpoint with a red circle (glyph).
-
Let's set another breakpoint. Set a breakpoint at the statement that begins:
int aStep = BLOCK_SIZE;
-
Let's set another breakpoint at:
int BS(ty, tx) = B[b + wB * ty + tx];
This particular breakpoint will be interesting because it occurs on a line of source code immediately preceding the _synchthreads statement.
2.3. EXERCISE 3: Run the CUDA Debugger and Inspect Variables
Let's start the CUDA Debugger and take a look at variables and memory at the breakpoints we set.
-
Start the Nsight Monitor.
-
On the target machine, click the Windows Start menu.
-
Select All Programs > NVIDIA Corporation > Nsight Visual Studio Edition2020.1 > Nsight Monitor.
The Nsight Monitor starts. The monitor icon appears in the system tray.
-
-
Start the CUDA Debugger. From the Nsight menu in Visual Studio, select Start CUDA Debugging. (Alternately, you can also right-click on the project and choose Start CUDA Debugging.)
The CUDA Debugger starts. Notice that a popup message indicates that a connection has been made. The debugger start the matrixMul application. Execution continues until the debugger encounters the first breakpoint, at which point the debugger pauses execution.
You cannot use F5 to start the CUDA Debugger unless you change the key bindings. The default key binding in Visual Studio for the F5 key is to start the native debugger (CPU debugger). However, once the CUDA Debugger starts, it will respond to the other key bindings that affect run control (such as F11 and F12).
-
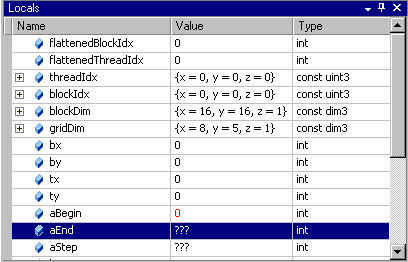
From the Debug menu, choose Windows > Locals. The Locals window opens. The Locals window displays the variables and their values in the current lexical scope. Notice the value of the variable aBegin in the Locals window.
-
Click the Step Into icon or press F11.
Notice that the value of the variable aBegin changed. The color red indicates that the value changed as a result of the last instruction executed, which in this case was the statement that had the first breakpoint.
Keep in mind that, unlike using the native debugger on CPU code, you cannot change the value in GPU memory by editing the value in the Locals window.
-
Click the Run icon or press F5.
The CUDA Debugger resumes execution of the matrixMul application, and pauses before executing the instruction on the line of source code at the next breakpoint. Before we continue execution, let's take a look at the values in memory.
-
From the Debug menu, choose Windows > Memory > Memory Window 1. The Memory window opens.
-
Click and drag a variable from the Locals window onto the Memory window. The memory window displays the values at the address that corresponds to the variable (or pointer).
When viewing memory in __local__, __const__ or __shared__ make sure the Visual Studio Memory view is set to Re-evaluate automatically. This will ensure that the memory shown is for the correct memory space. Without this, the display can change to an address which defaults to global memory.
|
Note: |
You cannot change the value in GPU memory by editing the value in the Memory window. |
2.4. EXERCISE 4: Run the Memory Checker
The CUDA Memory Checker keeps track of all memory allocations. to ensure that invalid memory locations are not accessed by the target application.
Writing to an out-of-bounds memory location in a CUDA kernel launch causes the GPU to terminate the launch, and places the CUDA context in a permanent error state. This results in all CUDA API functions returning an error code, such as CUDA_ERROR_UNKNOWN. The coding errors that lead to invalid memory access can been difficult to debug without a memory checker.
-
From the Nsight menu, select Enable CUDA Memory Checker. A checkmark indicates that the Memory Checker is enabled.
-
Start the CUDA Debugger.
-
Make sure that the Nsight Monitor is running on the target machine (either a remote machine or localhost, depending on your configuration).
-
From Nsight menu, select Start CUDA Debugging. (Or right-click on the project and choose Start CUDA Debugging.)
The CUDA Debugger starts and launches the target application.
-
Notices
Notice
NVIDIA® Nsight™ Application Development Environment for Heterogeneous Platforms, Visual Studio Edition 2020.1 User GuideSend Feedback
THE INFORMATION IN THIS GUIDE AND ALL OTHER INFORMATION CONTAINED IN NVIDIA DOCUMENTATION REFERENCED IN THIS GUIDE IS PROVIDED “AS IS.” NVIDIA MAKES NO WARRANTIES, EXPRESSED, IMPLIED, STATUTORY, OR OTHERWISE WITH RESPECT TO THE INFORMATION FOR THE PRODUCT, AND EXPRESSLY DISCLAIMS ALL IMPLIED WARRANTIES OF NONINFRINGEMENT, MERCHANTABILITY, AND FITNESS FOR A PARTICULAR PURPOSE. Notwithstanding any damages that customer might incur for any reason whatsoever, NVIDIA’s aggregate and cumulative liability towards customer for the product described in this guide shall be limited in accordance with the NVIDIA terms and conditions of sale for the product.
THE NVIDIA PRODUCT DESCRIBED IN THIS GUIDE IS NOT FAULT TOLERANT AND IS NOT DESIGNED, MANUFACTURED OR INTENDED FOR USE IN CONNECTION WITH THE DESIGN, CONSTRUCTION, MAINTENANCE, AND/OR OPERATION OF ANY SYSTEM WHERE THE USE OR A FAILURE OF SUCH SYSTEM COULD RESULT IN A SITUATION THAT THREATENS THE SAFETY OF HUMAN LIFE OR SEVERE PHYSICAL HARM OR PROPERTY DAMAGE (INCLUDING, FOR EXAMPLE, USE IN CONNECTION WITH ANY NUCLEAR, AVIONICS, LIFE SUPPORT OR OTHER LIFE CRITICAL APPLICATION). NVIDIA EXPRESSLY DISCLAIMS ANY EXPRESS OR IMPLIED WARRANTY OF FITNESS FOR SUCH HIGH RISK USES. NVIDIA SHALL NOT BE LIABLE TO CUSTOMER OR ANY THIRD PARTY, IN WHOLE OR IN PART, FOR ANY CLAIMS OR DAMAGES ARISING FROM SUCH HIGH RISK USES.
NVIDIA makes no representation or warranty that the product described in this guide will be suitable for any specified use without further testing or modification. Testing of all parameters of each product is not necessarily performed by NVIDIA. It is customer’s sole responsibility to ensure the product is suitable and fit for the application planned by customer and to do the necessary testing for the application in order to avoid a default of the application or the product. Weaknesses in customer’s product designs may affect the quality and reliability of the NVIDIA product and may result in additional or different conditions and/or requirements beyond those contained in this guide. NVIDIA does not accept any liability related to any default, damage, costs or problem which may be based on or attributable to: (i) the use of the NVIDIA product in any manner that is contrary to this guide, or (ii) customer product designs.
Other than the right for customer to use the information in this guide with the product, no other license, either expressed or implied, is hereby granted by NVIDIA under this guide. Reproduction of information in this guide is permissible only if reproduction is approved by NVIDIA in writing, is reproduced without alteration, and is accompanied by all associated conditions, limitations, and notices.
Trademarks
NVIDIA, the NVIDIA logo, and cuBLAS, CUDA, CUDA-GDB, CUDA-MEMCHECK, cuDNN, cuFFT, cuSPARSE, DIGITS, DGX, DGX-1, DGX Station, NVIDIA DRIVE, NVIDIA DRIVE AGX, NVIDIA DRIVE Software, NVIDIA DRIVE OS, NVIDIA Developer Zone (aka "DevZone"), GRID, Jetson, NVIDIA Jetson Nano, NVIDIA Jetson AGX Xavier, NVIDIA Jetson TX2, NVIDIA Jetson TX2i, NVIDIA Jetson TX1, NVIDIA Jetson TK1, Kepler, NGX, NVIDIA GPU Cloud, Maxwell, Multimedia API, NCCL, NVIDIA Nsight Compute, NVIDIA Nsight Eclipse Edition, NVIDIA Nsight Graphics, NVIDIA Nsight Integration, NVIDIA Nsight Systems, NVIDIA Nsight Visual Studio Edition, NVLink, nvprof, Pascal, NVIDIA SDK Manager, Tegra, TensorRT, Tesla, Visual Profiler, VisionWorks and Volta are trademarks and/or registered trademarks of NVIDIA Corporation in the United States and other countries. Other company and product names may be trademarks of the respective companies with which they are associated.