CUDA Debugger > Walkthrough: Debugging a CUDA Application

In the following walkthrough we present some of the more common procedures that you might use to debug a CUDA-based application. We use a sample application called Matrix Multiply as an example. NVIDIA Nsight includes this sample application.

For the purpose of this walkthrough, we are going to assume that the application is debugged remotely (the NVIDIA Nsight host software running on a machine with Visual Studio, and the Nsight Monitor running on a separate machine).

Open the Sample Project and Set Breakpoints

  1. Open the sample project called matrixMul.
    For assistance opening the sample projects that ship with NVIDIA Nsight, see Working with Samples.
    You might notice that there is another sample project with a similar name, Matrix Multiply (Driver API), which uses the CUDA driver API. The project we use in this example uses the CUDA Runtime API.
  2. Set a breakpoint.
    1. Open the file called matrixMul_kernel.cu.
    2. Set a breakpoint in matrixMul_kernel.cu at the statement:
      int aStep = BLOCK_SIZE


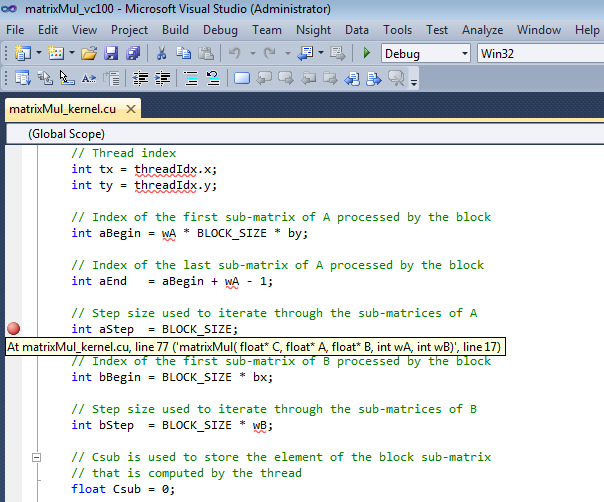
      Visual Studio marks the location of the breakpoint with a red circle. You can also use any of the other various methods that Visual Studio provides to set breakpoints.
  3. For the purpose of this walkthrough, let's set one more breakpoint. Set a breakpoint in the file called matrixMul_kernel.cu at the statement that begins:
    for {int a = aBegin, b = bBegin;

In this section of the walkthrough, you opened the sample project and set breakpoints. Next we build the sample project and start the debugging session.

Build the Sample and Launch the Debugger

  1. On the target machine, start the Nsight Monitor.
    1. On the target machine, click the Windows Start menu.
    2. Select All Programs > NVIDIA Corporation > Nsight Visual Studio Edition 3.2 > Nsight Monitor.
      The Nsight Monitor starts. The Nsight Monitor icon appears in the system tray.

  2. On the host machine, configure the project for remote debugging.
    1. In the Solution Explorer, right-click on the project name matrixMul, and select Nsight User Properties. (As an alternative, you can also go to the Project menu > Nsight User Properties.)
      The User Settings window appears.
    2. In the left pane, choose Launch.
    3. In the Connection name field, replace localhost with the name of your target machine (the remote computer where the application to be debugged will run). This can be the IP address of the machine on your local network, or the machine name as recognized on your network.

      IMPORTANT: Do not use a mapped drive to specify the hostname. For example:

      WRONG: M:\

      CORRECT: jsmith.mydomain.com


    4. In the Working directory field, you can specify the directory you want the target application to use as its working directory. The default working directory is the project directory.
    5. Click OK
  3. Optional: when remote debugging, to abort the launch when a file fails to copy to the remote system, set the Abort on synchronize failure option to "True."
    1. From the Nsight menu select Nsight Options. The Nsight Options window opens.
    2. In the left hand pane, select General.
    3. Under the Launch section, set Abort on synchronize failure to True.


    4. Click theOK button.
  4. Configure the CUDA Debugger and CUDA Memory Checker properties.
    1. From the Nsight menu select Nsight Options. The Nsight Options window opens.
    2. In the left-hand pane, select CUDA.


    3. Configure the CUDA settings to suit your debugging needs.

      NOTE on the CUDA Data Stack feature:

      On Fermi and later architectures, each GPU thread has a private data stack. Normally the required data stack size is determined by the compiler, and usually the driver's default size is greater than what a kernel will require.

      However, if a kernel uses a recursive function, the compiler cannot statically determine the data stack size. In such cases the application must call cuCtxGetLimit() and cuCtxSetLimit() with CU_LIMIT_STACK_SIZE to ensure adequate stack space.

      Setting CU_LIMIT_STACK_SIZE is normally the responsibility of the application, for release-compiled kernels.

      Since debug-compiled kernels require extra stack space, the application would require different stack size settings for debug and release.

      As a convenience, and to avoid polluting application code with debug-kernel-specific code, we have added settings to the CUDA Debugger that will automatically increase your stack size settings while debugging.

  5. On the host machine, build the matrixMul project.
    1. From the Visual Studio Build menu, select Rebuild matrixMul.NVIDIA Nsight builds the project.
      The CUDA Toolkit that you use to compile your CUDA C code must support the following switch for generating debug symbolics: -G0
    2. View the output window for error messages. If the project built successfully, go to the next step. If the project did not build, you need to correct the problem before going to the next step.
  6. From the Nsight menu, select Start CUDA Debugging.
    As an alternate option, you can also choose to right-click on the project and select Start CUDA Debugging.

On the host machine, notice that a pop-up message indicates that a connection has been made. You've started the debugging session. In the next section of this walkthrough, we'll look at some of the windows that you typically inspect during a debugging session.

Edit the .cu File Properties

In Visual Studio 2010, you may have a dependency fail because the properties of the .cu file are configured incorrectly. To workaround this issue, use the following steps.

  1. Right-click on the included .cu file and select Properties.
  2. Change Item Type to C/C++ header.


  3. Ensure that the Excluded from Build property is set to No.


Inspect Values of Variables

  1. Start the CUDA Debugger.
    1. From the Nsight menu in Visual Studio, choose Start CUDA Debugging. (Or right-click on the project and choose Start CUDA Debugging.)
    2. Pause execution or allow the application to run to a breakpoint, or set a breakpoint if none enabled.
  2. From the Debug menu, choose Windows > Locals.
    The Locals window opens. The Locals window displays the variables and their values in the current lexical scope.

NOTE: You cannot change the value in GPU memory by editing the value in the Locals window.

Inspect Values in Memory

  1. Start the CUDA Debugger.
    1. From the Nsight menu in Visual Studio, choose Start CUDA Debugging. (Or right-click on the project and choose Start CUDA Debugging.)
    2. Pause execution or allow the application to run to a breakpoint, or set a breakpoint if none enabled.
  2. From the Debug menu, choose Windows > Memory > Memory Window 1.
    The Memory window opens.
  3. Click and drag a variable from the Locals window onto the Memory window.
    The memory window displays the values at the address that corresponds to the variable (or pointer).


  4. When viewing memory in __local__, __const__ or __shared__ make sure the Visual Studio Memory view is set to Re-evaluate automatically. This will ensure that the memory shown is for the correct memory space. Without this, the display can change to an address which defaults to global memory.

You cannot change the value in GPU memory by editing the value in the Memory window.

See Also

How Tos
How To: Launch the CUDA Debugger
How To: Set GPU Breakpoints
How To: Setup Local Headless GPU Debugging
How To: Specify Debugger Context

Reference
Tesla Compute Cluster (TCC)


NVIDIA® Nsight™ Development Platform, Visual Studio Edition User Guide Rev. 3.2.131009 ©2009-2013. NVIDIA Corporation. All Rights Reserved.

of