Build and Run#
Build and run projects with the CUDA Debugger in NVIDIA Nsight VSE.
Build and Run#
In this section, learn more about how to configure the properties of a CUDA project, launching the CUDA Debugger, and how to attach debugging to a running CUDA Process.
CUDA Project Properties#
With NVIDIA Nsight™ VSE, you can set parameters of your CUDA project in order to customize your debugging experience.
To configure your project’s CUDA properties page:
In the Solution Explorer, click on the project name so that it is highlighted.
From the Project menu, choose Properties. The Property Pages window opens.
Select CUDA C/C++ in the left pane.
Common#
On the Common page, you can configure the following options:
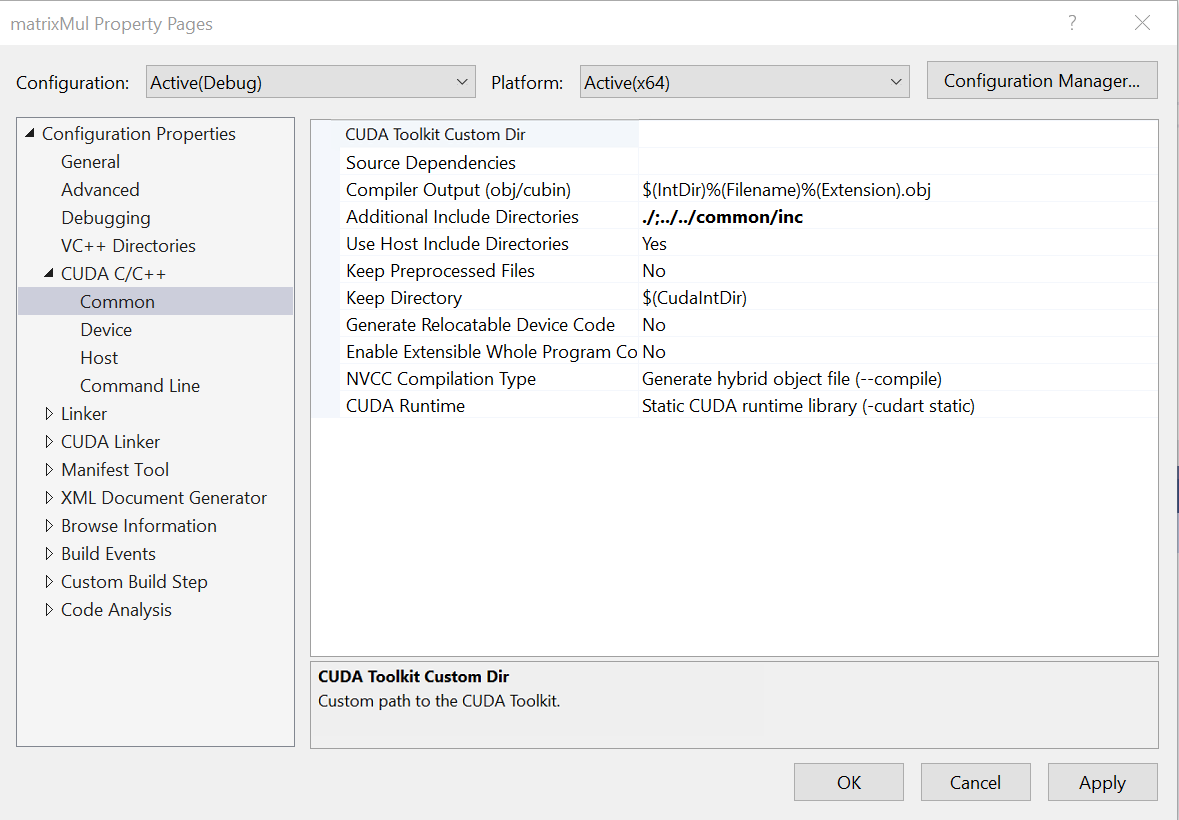
CUDA Toolkit Custom Dir — This option sets a custom path to the CUDA toolkit. You can edit the path, select “Browse” to choose the path, or select “inherit from parent or project defaults.”
Source Dependencies — This option allows you to add additional source file dependencies. If you have a dependency that has been set with an #include statement, it does not need to be explicitly specified in this.
Compiler Output (obj/cubin) — This sets the output as an
.objor a.cubinfile. The default setting is$(IntDir)%(Filename)%(Extension).obj.Additional Include Directories — This option allows you to list at least one additional directory to add to the include path. If you have more than one, use a semicolon to separate them.
Use Host Include Directories — This option specifies whether or not to use the additional include directories that are used by the host compiler for device code.
Keep Preprocessed Files — This option allows you to choose whether or not the preprocessor files generated by the CUDA compiler (for example,
.ptx,.cubin,.cudafe1.c, etc.) will be deleted.Keep Directory — This option sets the path the directory where the preprocessor files generated by the CUDA compiler will be kept.
Generate Relocatable Device Code — This setting chooses whether or not to compile the input file into an object file that contains relocatable device code.
NVCC Compilation Type — This option sets your desired output of NVCC compilation. Choices here include the following:
Generate hybrid object file (
--compile)Generate hybrid .c file (
-cuda)Generate .gpu file (
-gpu)Generate .cubin file (
-cubin)Generate .ptx file (
-ptx)
CUDA Runtime — This option allows you to specify the type of CUDA runtime library to be used. The choices here include the following:
No CUDA runtime library (
-cudart none)Shared/dynamic CUDA runtime library (
-cudart shared)Static CUDA runtime library (
-cudart static)
Device#
On the Device page, you can configure the following options:
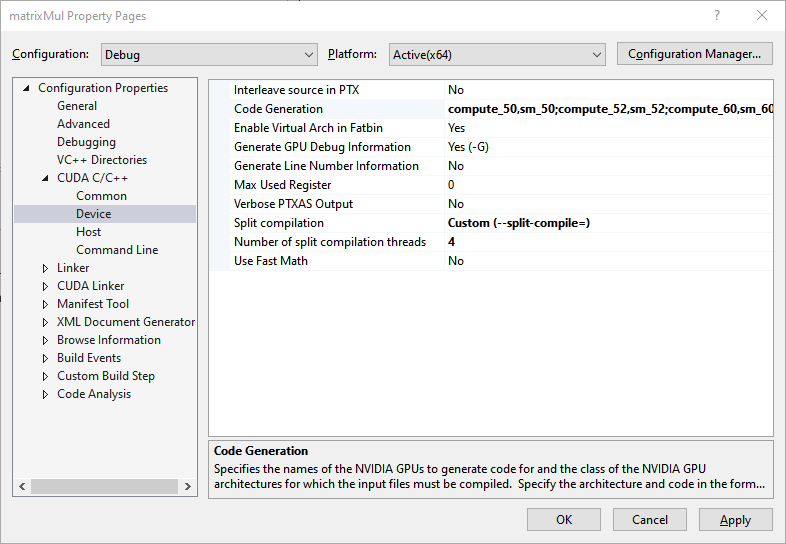
C interleaved in PTXAS Output — This setting chooses whether or not to insert source code into generated PTX.
Code Generation — This option specifies the names of the NVIDIA GPU architectures to generate code for. If you click Edit from the drop-down menu, the following pop-up appears:
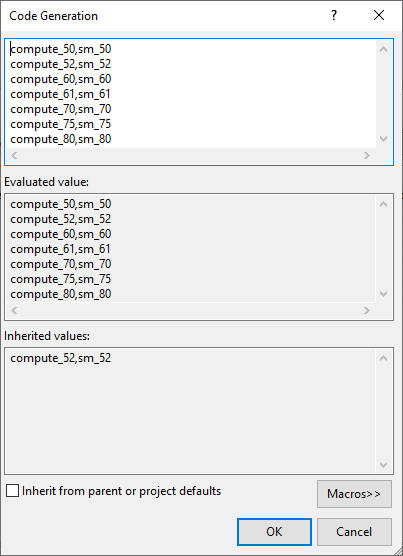
If you edit this field, the correct syntax to use is
[arch],[code](for example,compute_80,sm_80). If the selected NVCC Compilation Type iscompile, then multiple arch/code pairs may be listed, separated by a semicolon (for example,compute_70,sm_70;compute_75,sm_75).Generate GPU Debug Information — This setting selects whether or not GPU debugging information is generated by the CUDA compiler.
Generate Line Number Information — This option chooses whether or not to generate line number information for device code. If Generate GPU Debug Information is on (
-G), line information (-lineinfo) is automatically generated as well.Max Used Register — This option specifies the maximum amount of registers that GPU functions can use.
Verbose PTXAS Output — This option selects whether or not to use verbose PTXAS output.
Split Compilation — The Split Compilation NVCC option specifies the upper bound for the number of threads the compiler is allowed to use for parallel compilation. With split compilation, the compiler breaks up your code into groups of kernels that it compiles and optimizes in parallel to speed up compile time.
Split-compilation can be set to:
Default: The
--split-compileargument is not passed to the compiler and split compilation is disabled (equivalent to--split-compile=1).Max threads (–split-compile=0): The compiler automatically manages the maximum number of threads to use based on your software/hardware configuration.
Max threads (extended) (–split-compile-extended=0): The compiler automatically manages the maximum number of threads to use based on your software/hardware configuration.
Custom (–split-compile=): Uses the ‘Number of split compilation threads’ property field to specify a custom upper bound value for the number of compiler threads.
Custom (extended) (–split-compile-extended=): Uses the ‘Number of split compilation threads’ property field to specify a custom upper bound value for the number of compiler threads.
Note
The value specified in “Number of split compilation threads” is ignored unless split compilation is set to “Custom” or “Custom (extended)”.
Setting split compilation to “Custom” or “Custom (extended)” and not providing a value for “Number of split compilation threads” results in a build error with the following text:
Invalid command line switch for "". The parameter "SplitCompile" requires missing parameter "SplitCompileCustomThreads" to be set.
Host#
On the Host page, you can configure the following options:
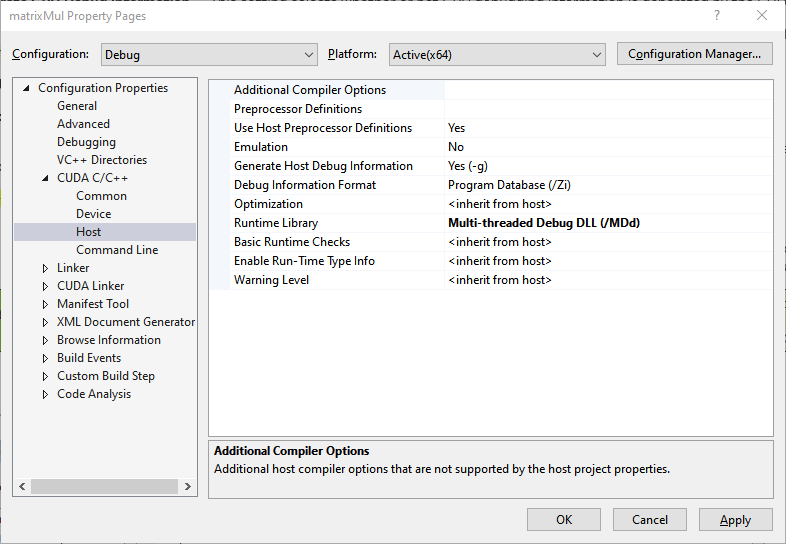
Additional Compiler Options — This setting lists additional host compiler options that are not supported by the host’s project properties.
Preprocessor Definitions — This option allows you to list preprocessor defines.
Use Host Preprocessor Definitions — This option selects whether or not to use the defines that were used by the host compiler for device code.
Emulation — This option specifies whether or not to generate emulated code.
Generate Host Debug Information — This option specifies whether or not the host debugging information will be generated by the CUDA compiler.
Use Fast Math — This option selects whether or not to make use of the fast math library.
Optimization — This field selects the option for code optimization. Available choices include the following:
<inherit from host>
Disabled (
/Od)Minimize Size (
/O1)Maximize Speed (
/O2)Full Optimization (
/Ox)
Runtime Library — This field selects the runtime library to use for linking. Available choices include the following:
<inherit from host>
Multi-Threaded (
/Mt)Multi-Threaded Debug (
/Mtd)Multi-Threaded DLL (
/MD)Multi-Threaded Debug DLL (
/MDd)Single-Threaded (
/ML)Single-Threaded Debug (
/MLd)
Basic Runtime Checks — This field performs basic runtime error checks, incompatible with any optimization type other than debug. Available choices include the following:
<inherit from host>
Default
Stack Frames (
/RTCs)Uninitialized Variables (
/RTCu)Both (
/RTC1)
Enable Run-Time Type Info — This option chooses whether or not to add code for checking C++ object types at run time.
Warning Level — This option selects how strictly you want the compiler to be when checking for potentially suspect constructs. Available choices here include:
<inherit from host>
Off: Turn Off All Warnings (
/W0)Level 1 (
/W1)Level 2 (
/W2)Level 3 (
/W3)Level 4 (
/W4)Enable All Warnings (
/Wall)
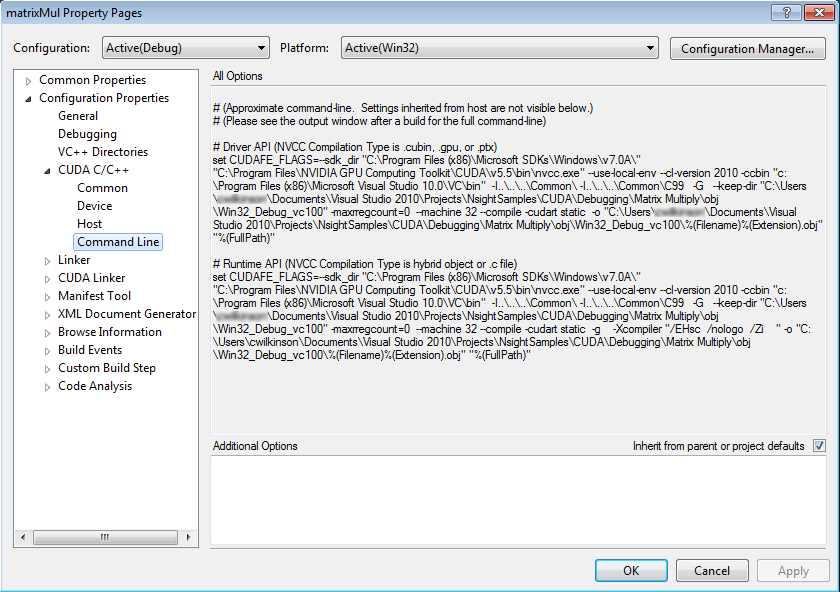
Command Line#
The Command Line page shows the approximate command line parameters, given the settings you’ve chosen.
Launch the CUDA Debugger#
Make sure that the modules you intend to debug are built with the compiler generating debug symbols. If a module has no symbols, then debugging is disabled for all functions in that module.
Note
The CUDA debugger only supports local debugging. Remote debugging is not currently supported.
To start the CUDA Debugger locally:
From the Nsight menu select Start CUDA Debugging.
Right-click on the project, and select Debug > Start CUDA Debugging
Click on the Start CUDA Debugging toolbar icon.
Show/hide this icon group by right-clicking on the Visual Studio toolbar and toggling Nsight CUDA Debug.
Notices
Notice
ALL NVIDIA DESIGN SPECIFICATIONS, REFERENCE BOARDS, FILES, DRAWINGS, DIAGNOSTICS, LISTS, AND OTHER DOCUMENTS (TOGETHER AND SEPARATELY, “MATERIALS”) ARE BEING PROVIDED “AS IS.” NVIDIA MAKES NO WARRANTIES, EXPRESSED, IMPLIED, STATUTORY, OR OTHERWISE WITH RESPECT TO THE MATERIALS, AND EXPRESSLY DISCLAIMS ALL IMPLIED WARRANTIES OF NONINFRINGEMENT, MERCHANTABILITY, AND FITNESS FOR A PARTICULAR PURPOSE.
Information furnished is believed to be accurate and reliable. However, NVIDIA Corporation assumes no responsibility for the consequences of use of such information or for any infringement of patents or other rights of third parties that may result from its use. No license is granted by implication of otherwise under any patent rights of NVIDIA Corporation. Specifications mentioned in this publication are subject to change without notice. This publication supersedes and replaces all other information previously supplied. NVIDIA Corporation products are not authorized as critical components in life support devices or systems without express written approval of NVIDIA Corporation.
Trademarks
NVIDIA and the NVIDIA logo are trademarks or registered trademarks of NVIDIA Corporation in the U.S. and other countries. Other company and product names may be trademarks of the respective companies with which they are associated.