Getting Started with the CUDA Debugger#
Introduction to the NVIDIA Nsight VSE CUDA Debugger.
Walkthrough: Debugging a CUDA Application#
In the following walkthrough, we present some of the more common procedures that you might use to debug a CUDA-based application. We use a sample application called Matrix Multiply as an example. NVIDIA CUDA Toolkit SDK includes this sample application. More information, including licensing information, about the NVIDIA CUDA Toolkit and the NVIDIA GPU CUDA Samples can be found at: http://www.nvidia.com/getcuda
Note that the CUDA debugger only supports local debugging. Remote debugging is not currently supported.
Open the Sample Project and Set Breakpoints#
Open the sample project in the CUDA SDK called matrixMul.
For assistance in locating sample applications, see Working with Samples.
You might notice that there are other sample projects with similar names: matrixMul_nvrtc, matrixMul_CUBLAS, matrixMultDrv. The project we use in this example uses the CUDA Runtime API.
Note
NOTE that this file contains code for the CPU (i.e.
matrixMultiply()) and GPU (i.e.matrixMultiplyCUDA(), any function specified with a__global__or__device__keyword).First, let’s set some breakpoints in GPU code.
Open the file called
matrixMul.cu, and find the CUDA kernel functionmatrixMulCUDA().Set a breakpoint at:
int aStep = BLOCK_SIZE
Set another breakpoint at the statement that begins with:
for {int a = aBegin, b = bBegin;
Now, let’s set some breakpoints in CPU code:
In the same file,
matrixMul.cu, find the CPU functionmatrixMultiply().Set one breakpoint at:
if (block_size == 16)
Set another breakpoint at the statement that begins with:
printf("done\n");
In this section of the walkthrough, you opened the sample project and set breakpoints. Next, we build the sample project and start the debugging session.
Build the Sample and Launch the Debugger#
On the host machine, build the matrixMul project.
From the Visual Studio Build menu, select Rebuild matrixMul.
NVIDIA Nsight™ VSE builds the project.
Note
You must use the following nvcc compiler switch to generate symbolics information for CUDA kernels:
> nvcc -G <source file>When debugging native CPU code you should also use the
-g, -O0nvcc compiler flags to generate unoptimized code with symbolics information.> nvcc -g -O0 <source file>View the output window for error messages. If the project built successfully, go to the next step. If the project did not build, you need to correct the problem before going to the next step.
From the Nsight menu, choose
Start CUDA Debugging
For information on choosing the correct debugger for your system configuration see the System Requirements page.
Alternatively, you can also choose to:
Right-click on the project, and select Debug > Start CUDA Debugging
Click on the Start CUDA Debugging toolbar icon.
Show/hide this icon group by right-clicking on the Visual Studio toolbar and toggling Nsight CUDA Debug.
You’ve started the debugging session. In the next section of this walkthrough, we’ll look at some of the windows that you typically inspect during a debugging session.
Edit the .cu File Properties
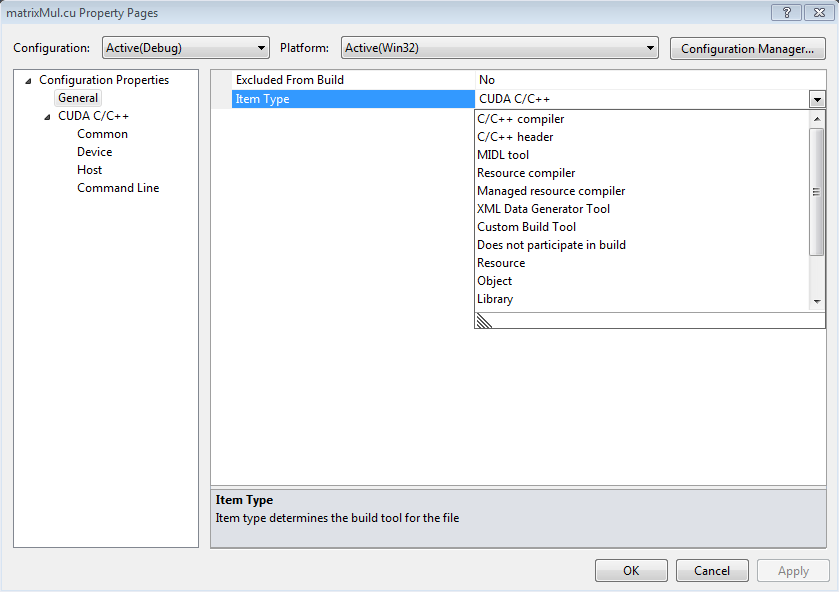
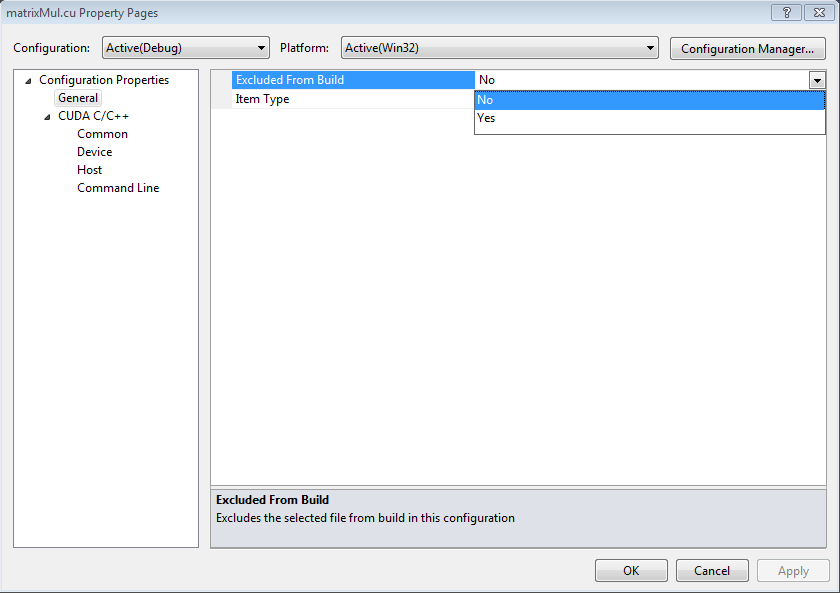
In Visual Studio, you may have a dependency fail because the properties of the .cu file are configured incorrectly. To workaround this issue, use the following steps.
Right-click on the included .cu file and select Properties.
Change Item Type to C/C++ header.
Ensure that the Excluded from Build property is set to No.
Inspect Values of Variables
Start the CUDA Debugger.
From the Nsight menu in Visual Studio, select Start CUDA Debugging
Alternatively, you can also choose to:
Right-click on the project, and select Debug > Start CUDA Debugging
Click on the Start CUDA Debugging toolbar icon.
Show/hide this icon group by right-clicking on the Visual Studio toolbar and toggling Nsight CUDA Debug.
From the Debug menu, choose Windows > Locals.
The Locals window opens. The Locals window displays the variables and their values in the current lexical scope.
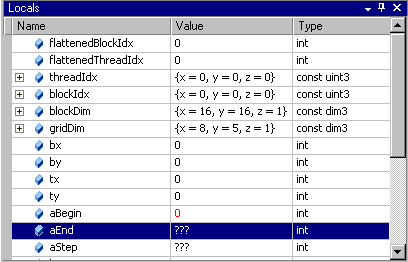
NOTE: You cannot change the value in GPU memory by editing the value in the Locals window.
Inspect Values in Memory
Start the CUDA Debugger.
From the Nsight menu in Visual Studio, choose:
Start CUDA Debugging
Alternatively, you can also choose to:
Right-click on the project, and select Debug > Start CUDA Debugging
Click on the Start CUDA Debugging toolbar icon.
Show/hide this icon group by right-clicking on the Visual Studio toolbar and toggling Nsight CUDA Debug.
From the Debug menu, choose Windows > Memory > Memory Window 1.
The Memory window opens.
Click and drag a variable from the Locals window onto the Memory window.
The memory window displays the values at the address that corresponds to the variable (or pointer).

When viewing memory in
__local__,__const__or__shared__make sure the Visual Studio Memory view is set to Re-evaluate automatically. This will ensure that the memory shown is for the correct memory space. Without this, the display can change to an address which defaults to global memory.Note
You cannot change the value in GPU memory by editing the value in the Memory window.
Inspect Values of SASS Indexed Constants
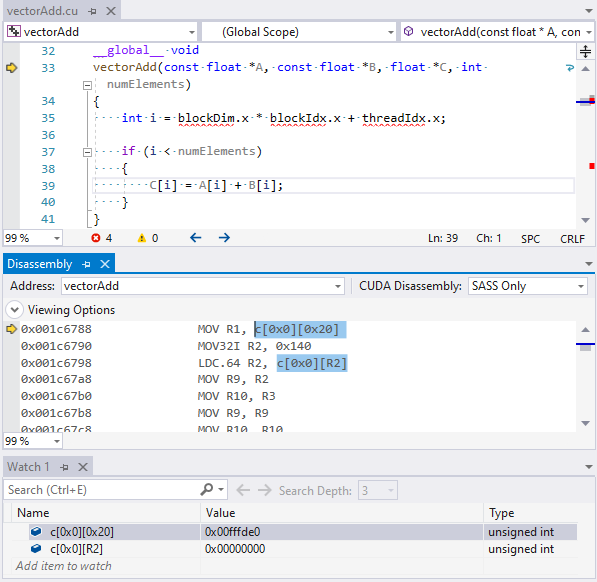
From the Debug menu, choose Windows > Disassembly, and set the CUDA Disassembly for SASS.
SASS is a GPU architecture specific disassembly and its implementation is subject to change, therefore not documented by NVIDIA, although it is similar to PTX.
From the Nsight menu, ensure Break on Launch is set.
Start the CUDA Debugger:
From the Nsight menu in Visual Studio, select Start CUDA Debugging.
Execution will stop at the first kernel launch.
Note that launch user kernel parameter constants are represented in the disassembly view as c[bank][offset].
From the Debug menu, choose Windows > Watch.
Add the indexed constants in order to view their values.
The c[bank][offset] notation refers to locations in constant memory.
Indexed constants may be found elsewhere and are heavily used to reference:
Per module constant variables
Per module constant literals (const double = 1.0) that cannot be encoded directly into instructions
Per launch user kernel parameters (up to 4KB)
Per launch driver kernel parameters (local memory base address, GridDim, BlockDim)
The bank for module level constants will be different from per kernel launch constants.
The banks and offsets will differ between GPU architectures.
The CUDA debugger can also read module constants (bank=0, c[0][#]) in the memory view using the syntax (constant int*)0. For c[0][0x100] use (constant int*)0x100.
The CUDA debugger can also view the 4KiB of kernel parameters using (params int*)0. This maps to c[3][0x140] or c[3][0x160] depending on the architecture.
See Also
How Tos
Reference
Tutorial: Using the CUDA Debugger#
In the following tutorial we look at how to use some of the basic features of the CUDA Debugger. For the purpose of this tutorial, we use a sample application called Matrix Multiply, but you can follow the same procedures, using your own source.
This tutorial covers how to debug an application locally. This means that you will need to have the NVIDIA Nsight™ VSE host software running on a machine with Visual Studio.
Make sure that the machine you use meets the system requirements. For more information, see System Requirements for NVIDIA Nsight Software.
That will be our first exercise in this tutorial: configuring a machine for local debugging. In this tutorial:
EXERCISE 1: Open A Project And Build The Executable
EXERCISE 2: Set Breakpoints
EXERCISE 3: Run The CUDA Debugger And Inspect Variables
EXERCISE 1: Open a Project and Build an Executable#
Let’s open the sample project matrixMul. This is a simple CUDA-based application that multiplies 2 matrices. The algorithms in the source code are relatively simple, but will still give you a sense of how the CUDA Debugger works. The matrixMul application is included with the CUDA Toolkit software (see Working with Samples).
Make sure that you understand the importance of using a CUDA Toolkit that works with NVIDIA Nsight™ VSE.
Note
CUDA Toolkit: In order to use a project with the NVIDIA Nsight™ VSE tools, we recommend that you use the compiler that ships with the tools. The default installation directory for this version of the compiler is:
C:\Program Files\NVIDIA GPU Computing Toolkit\CUDA
The compiler is in a subdirectory labeled by its version, such as:
...\<version_number>\bin\nvcc.exe
The NVIDIA Nsight™ VSE tools work best with this version of the compiler. However, the tools also work with the standard toolkit. Whichever compiler you use, the CUDA Toolkit that you use to compile your CUDA C code must support the following switch to generate symbolics information for CUDA kernels: -G.
It is also recommended that you use the -g -0 nvcc flags to generate unoptimized code with symbolics information for the native host side code.
Open the sample project called matrixMul.
Browse to the CUDA Samples repository on GitHub:
Here you will find a number of sample projects, including those with supported Visual Studio version projects and solutions.
Browse to the
C:\ProgramData\NVIDIA Corporation\CUDA Samples\<version_number>\0_Simple\MatrixMul
Double-click on the
matrixMul_vs20YY.sln
file for your version of Visual Studio
Visual Studio starts. The matrixMul project opens. You might notice that 0_Simple contains other sample project with a similar names, such as matrixMulDrv. This project uses the CUDA driver API. The project we use in this example uses CUDART (CUDA Runtime API).
Build the matrixMul project.
From the Visual Studio Build menu, select Rebuild matrixMul. NVIDIA Nsight™ VSE builds the project.
View the output window for error messages. If the project built successfully, go to the next step. If the project did not build, you need to correct the problem before going to the next step.
You have now successfully opened the project and built the matrixMul executable.
EXERCISE 2: Set Breakpoints#
Before we run the matrixMul application, let’s set some breakpoints at key places in the source code. This will cause the CUDA Debugger to pause execution of the target application at those points, and give us an opportunity to inspect the values of variables and the state of each thread.
Open the file called
matrixMul_kernel.cu.Set a breakpoint in
matrixMul_kernel.cuat the statement:int aBegin = wA * BLOCK_SIZE * by;
You can also use any of the other various methods that Visual Studio provides to set breakpoints. Visual Studio marks the location of the breakpoint with a red circle (glyph).
Let’s set another breakpoint. Set a breakpoint at the statement that begins:
int aStep = BLOCK_SIZE;
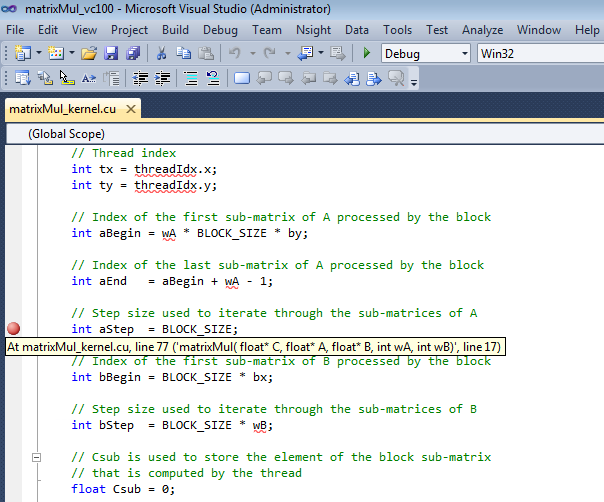
Let’s set another breakpoint at:
int BS(ty, tx) = B[b + wB * ty + tx];
This particular breakpoint will be interesting because it occurs on a line of source code immediately preceding the
_synchthreadsstatement.
EXERCISE 3: Run the CUDA Debugger and Inspect Variables#
Let’s start the CUDA Debugger and take a look at variables and memory at the breakpoints we set.
Start the CUDA Debugger. From the Nsight menu in Visual Studio, select Start CUDA Debugging. (Alternately, you can also right-click on the project and choose Start CUDA Debugging.)
The CUDA Debugger starts. Notice that a popup message indicates that a connection has been made. The debugger start the matrixMul application. Execution continues until the debugger encounters the first breakpoint, at which point the debugger pauses execution.
You cannot use F5 to start the CUDA Debugger unless you change the key bindings. The default key binding in Visual Studio for the F5 key is to start the native debugger (CPU debugger). However, once the CUDA Debugger starts, it will respond to the other key bindings that affect run control (such as F11 and F12).
From the Debug menu, choose Windows > Locals. The Locals window opens. The Locals window displays the variables and their values in the current lexical scope. Notice the value of the variable aBegin in the Locals window.
Click the Step Into icon or press F11.

Notice that the value of the variable aBegin changed. The color red indicates that the value changed as a result of the last instruction executed, which in this case was the statement that had the first breakpoint.
Keep in mind that, unlike using the native debugger on CPU code, you cannot change the value in GPU memory by editing the value in the Locals window.
Click the Run icon or press F5.
The CUDA Debugger resumes execution of the matrixMul application, and pauses before executing the instruction on the line of source code at the next breakpoint. Before we continue execution, let’s take a look at the values in memory.
From the Debug menu, choose Windows > Memory > Memory Window 1. The Memory window opens.
Click and drag a variable from the Locals window onto the Memory window. The memory window displays the values at the address that corresponds to the variable (or pointer).

When viewing memory in __local__, __const__ or __shared__ make sure the Visual Studio Memory view is set to Re-evaluate automatically. This will ensure that the memory shown is for the correct memory space. Without this, the display can change to an address which defaults to global memory.
Note: |
You cannot change the value in GPU memory by editing the value in the Memory window. |
Other Topics#
CUDA Debugger |
|---|
Notices
Notice
ALL NVIDIA DESIGN SPECIFICATIONS, REFERENCE BOARDS, FILES, DRAWINGS, DIAGNOSTICS, LISTS, AND OTHER DOCUMENTS (TOGETHER AND SEPARATELY, “MATERIALS”) ARE BEING PROVIDED “AS IS.” NVIDIA MAKES NO WARRANTIES, EXPRESSED, IMPLIED, STATUTORY, OR OTHERWISE WITH RESPECT TO THE MATERIALS, AND EXPRESSLY DISCLAIMS ALL IMPLIED WARRANTIES OF NONINFRINGEMENT, MERCHANTABILITY, AND FITNESS FOR A PARTICULAR PURPOSE.
Information furnished is believed to be accurate and reliable. However, NVIDIA Corporation assumes no responsibility for the consequences of use of such information or for any infringement of patents or other rights of third parties that may result from its use. No license is granted by implication of otherwise under any patent rights of NVIDIA Corporation. Specifications mentioned in this publication are subject to change without notice. This publication supersedes and replaces all other information previously supplied. NVIDIA Corporation products are not authorized as critical components in life support devices or systems without express written approval of NVIDIA Corporation.
Trademarks
NVIDIA and the NVIDIA logo are trademarks or registered trademarks of NVIDIA Corporation in the U.S. and other countries. Other company and product names may be trademarks of the respective companies with which they are associated.