

System Monitoring
This guide explains how to configure NVIDIA Run:ai to generate health alerts and to connect these alerts to alert-management systems within your organization. Alerts are generated for NVIDIA Run:ai clusters.
Alert Infrastructure
NVIDIA Run:ai uses Prometheus for externalizing metrics and providing visibility to end-users. The NVIDIA Run:ai Cluster installation includes Prometheus or can connect to an existing Prometheus instance used in your organization. The alerts are based on the Prometheus AlertManager. Once installed, it is enabled by default.
This document explains how to:
- Configure alert destinations - triggered alerts send data to specified destinations
- Understand the out-of-the-box cluster alerts, provided by NVIDIA Run:ai
- Add additional custom alerts
Prerequisites
- A Kubernetes cluster with the necessary permissions
- Up and running NVIDIA Run:ai environment, including Prometheus Operator
- kubectl command-line tool installed and configured to interact with the cluster
Setup
Use the steps below to set up monitoring alerts.
Validating Prometheus Operator Installed
-
Verify that the Prometheus Operator Deployment is running. Copy the following command and paste it in your terminal, where you have access to the Kubernetes cluster. In your terminal, you can see an output indicating the deployment’s status, including the number of replicas and their current state.
-
Verify that Prometheus instances are running. Copy the following command and paste it in your terminal. You can see the Prometheus instance(s) listed along with their status:
Enabling Prometheus AlertManager
In each of the steps in this section, copy the content of the code snippet to a new YAML file (e.g., step1.yaml).
-
Copy the following command to your terminal, to apply the YAML file to the cluster:
-
Copy the following command to your terminal to create the AlertManager CustomResource, to enable AlertManager:
-
Copy the following command to your terminal to validate that the AlertManager instance has started:
-
Copy the following command to your terminal to validate that the Prometheus operator has created a Service for AlertManager:
Configuring Prometheus to Send Alerts
-
Open the terminal on your local machine or another machine that has access to your Kubernetes cluster
-
Copy and paste the following command in your terminal to edit the Prometheus configuration for the
runainamespace. This command opens the Prometheus configuration file in your default text editor (usuallyviornano): -
Copy and paste the following text to your terminal to change the configuration file:
-
Delete the prometheus pod to reset the pod’s settings:
-
Save the changes and exit the text editor.
Note
To save changes using vi, type :wq and press Enter.
The changes are applied to the Prometheus configuration in the cluster.
Alert Destinations
Set out below are the various alert destinations.
Configuring AlertManager for Custom Email Alerts
In each step, copy the contents of the code snippets to a new file and apply it to the cluster using kubectl apply -f.
-
Add your smtp password as a secret:
-
Replace the relevant smtp details with your own, then apply the
alertmanagerconfigusingkubectl apply: -
Save and exit the editor. The configuration is automatically reloaded.
Third Party Alert Destinations
Prometheus AlertManager provides a structured way to connect to alert-management systems. There are built-in plugins for popular systems such as PagerDuty and OpsGenie, including a generic Webhook.
Example: Integrating NVIDIA Run:ai With a Webhook
-
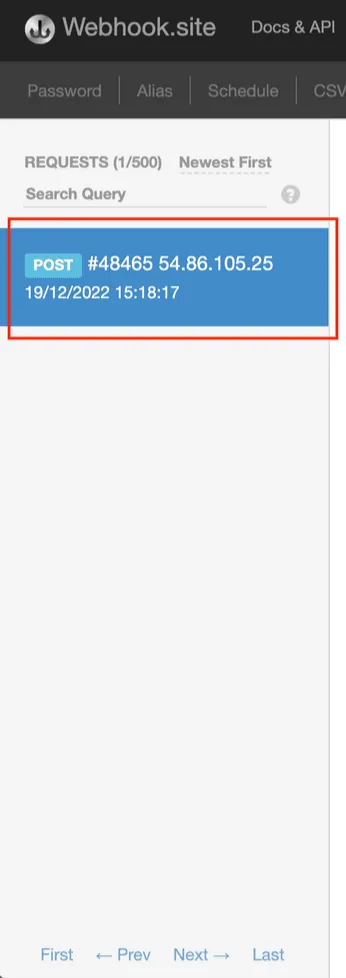
Use webhook.site to get a unique URL.
-
Use the upgrade cluster instructions to modify the values file:
Edit the values file to add the following, and replace<WEB-HOOK-URL>with the URL from webhook.site: -
Verify that you are receiving alerts on the webhook.site, in the left pane:
Built-in Alerts
An NVIDIA Run:ai cluster comes with several built-in alerts. Each alert notifies on a specific functionality of a NVIDIA Run:ai’s entity. There is also a single, inclusive alert: NVIDIA Run:ai Critical Problems, which aggregates all component-based alerts into a single cluster health test.
NVIDIA Run:ai Agent Cluster Info Push Rate Low
- Meaning - The
cluster-syncPod in therunainamespace might not be functioning properly - Impact - Possible impact - no info/partial info from the cluster is being synced back to the control-plane
- Severity - Critical
- Diagnosis -
kubectl get pod -n runaito see if thecluster-syncpod is running - Troubleshooting/Mitigation - To diagnose issues with the
cluster-syncpod, follow these steps:- Paste the following command to your terminal, to receive detailed information about the
cluster-syncdeployment:kubectl describe deployment cluster-sync -n runai - Check the Logs - Use the following command to view the logs of the
cluster-syncdeployment:kubectl logs deployment/cluster-sync -n runai - Analyze the Logs and Pod Details - From the information provided by the logs and the deployment details, attempt to identify the reason why the
cluster-syncpod is not functioning correctly - Check Connectivity - Ensure there is a stable network connection between the cluster and the NVIDIA Run:ai Control Plane. A connectivity issue may be the root cause of the problem.
- Paste the following command to your terminal, to receive detailed information about the
NVIDIA Run:ai Agent Pull Rate Low
- Meaning - The
runai-agentpod may be too loaded, is slow in processing data (possible in very big clusters), or therunai-agentpod itself in therunainamespace may not be functioning properly. - Impact - Possible impact - no info/partial info from the control-plane is being synced in the cluster
- Severity - Critical
- Diagnosis - Run:
kubectl get pod -n runaiAnd see if therunai-agentpod is running. - Troubleshooting/Mitigation - To diagnose issues with the
runai-agentpod, follow these steps:- Describe the Deployment - Run the following command to get detailed information about the
runai-agentdeployment:kubectl describe deployment runai-agent -n runai - Check the Logs - Use the following command to view the logs of the
runai-agentdeployment:kubectl logs deployment/runai-agent -n runai - Analyze the Logs and Pod Details - From the information provided by the logs and the deployment details, attempt to identify the reason why the
runai-agentpod is not functioning correctly. There may be a connectivity issue with the control plane. - Check Connectivity - Ensure there is a stable network connection between the
runai-agentand the control plane. A connectivity issue may be the root cause of the problem. - Consider Cluster Load - If the
runai-agentappears to be functioning properly but the cluster is very large and heavily loaded, it may take more time for the agent to process data from the control plane. - Adjust Alert Threshold - If the cluster load is causing the alert to fire, you can adjust the threshold at which the alert triggers. The default value is 0.05. You can try changing it to a lower value (e.g., 0.045 or 0.04). To edit the value, paste the following in your terminal:
kubectl edit runaiconfig -n runai/.In the editor, navigate to:spec: prometheus: agentPullPushRateMinForAlert. If theagentPullPushRateMinForAlertvalue does not exist, add it underspec -> prometheus.
- Describe the Deployment - Run the following command to get detailed information about the
NVIDIA Run:ai Container Memory Usage Critical
- Meaning -
Runaicontainer is using more than 90% of its Memory limit - Impact - The container might run out of memory and crash.
- Severity - Critical
- Diagnosis - Calculate the memory usage, this is performed by pasting the following to your terminal:
container_memory_usage_bytes{namespace=~"runai - Troubleshooting/Mitigation - Add more memory resources to the container.
NVIDIA Run:ai Container Memory Usage Warning
- Meaning - Runai container is using more than 80% of its memory limit
- Impact - The container might run out of memory and crash
- Severity - Warning
- Diagnosis - Calculate the memory usage, this can be done by pasting the following to your terminal:
container_memory_usage_bytes{namespace=~"runai - Troubleshooting/Mitigation - Add more memory resources to the container.
NVIDIA Run:ai Container Restarting
- Meaning -
Runaicontainer has restarted more than twice in the last 10 min - Impact - The container might become unavailable and impact the NVIDIA Run:ai system
- Severity - Warning
- Diagnosis - To diagnose the issue and identify the problematic pods, paste this into your terminal:
kubectl get pods -n runaiandkubectl get pods -n runai-backend. One or more of the pods have a restart count >= 2. - Troubleshooting/Mitigation - Paste this into your terminal:
kubectl logs -n NAMESPACE POD_NAME. ReplaceNAMESPACEandPOD_NAMEwith the relevant pod information from the previous step. Check the logs for any standout issues and verify that the container has sufficient resources.
NVIDIA Run:ai CPU Usage Warning
- Meaning -
runaicontainer is using more than 80% of its CPU limit - Impact - This might cause slowness in the operation of certain NVIDIA Run:ai features.
- Severity - Warning
- Diagnosis - Paste the following query to your terminal in order to calculate the CPU usage:
rate(container_cpu_usage_seconds_total{namespace=~"runai - Troubleshooting/Mitigation - Add more CPU resources to the container.
NVIDIA Run:ai Critical Problem
- Meaning - One of the critical NVIDIA Run:ai alerts is currently active
- Impact - Impact is based on the active alert
- Severity - Critical
- Diagnosis - Check NVIDIA Run:ai alerts in Prometheus to identify any active critical alerts
Unknown State Alert for a Node
- Meaning - The Kubernetes node hosting GPU workloads is in an unknown state, and its health and readiness cannot be determined.
- Impact - This may interrupt GPU workload scheduling and execution.
- Severity - Critical - Node is either unschedulable or has unknown status. The node is in one of the following states:
Ready=Unknown- The control plane cannot communicate with the node.Ready=False- The node is not healthy.Unschedulable=True- The node is marked as unschedulable.
- Diagnosis - Check the node’s status using kubectl describe node, verify Kubernetes API server connectivity, and inspect system logs for GPU-specific or node-level errors.
Low Memory Node Alert
- Meaning - The Kubernetes node hosting GPU workloads has insufficient memory to support current or upcoming workloads.
- Impact - GPU workloads may fail to schedule, experience degraded performance, or crash due to memory shortages, disrupting dependent applications.
- Severity:
- Critical - Node is using more than 90% of its memory.
- Warning - Node is using more than 80% of its memory.
- Diagnosis - Use
kubectltop node to assess memory usage, identify memory-intensive pods, consider resizing the node or optimizing memory usage in affected pods.
NVIDIA Run:ai DaemonSet Rollout Stuck / DaemonSet Unavailable on Nodes
- Meaning - There are currently 0 available pods for the
runaidaemonset on the relevant node - Impact - No fractional GPU workloads support
- Severity - Critical
- Diagnosis - Paste the following command to your terminal:
kubectl get daemonset -n runai-backend. In the result of this command, identify the daemonset(s) that don’t have any running pods - Troubleshooting/Mitigation - Paste the following command to your terminal, where
daemonsetXis the problematic daemonset from the previous step:kubectl describe daemonsetX -n runaion the relevant deamonset(s) from the previous step. The next step is to look for the specific error which prevents it from creating pods. Possible reasons might be:- Node Resource Constraints - The nodes in the cluster may lack sufficient resources (CPU, memory, etc.) to accommodate new pods from the daemonset.
- Node Selector or Affinity Rules - The daemonset may have node selector or affinity rules that are not matching with any nodes currently available in the cluster, thus preventing pod creation.
NVIDIA Run:ai Deployment Insufficient Replicas /Deployment No Available Replicas /Deployment Unavailable Replicas
- Meaning -
Runaideployment has one or more unavailable pods - Impact - When this happens, there may be scale issues. Additionally, new versions cannot be deployed, potentially resulting in missing features.
- Severity - Critical
- Diagnosis - Paste the following commands to your terminal, in order to get the status of the deployments in the
runaiandrunai-backendnamespaces:kubectl get deployment -n runaiandkubectl get deployment -n runai-backend. Identify any deployments that have missing pods. Look for discrepancies in theDESIREDandAVAILABLEcolumns. If the number ofAVAILABLEpods is less than theDESIREDpods, it indicates that there are missing pods. - Troubleshooting/Mitigation:
- Paste the following commands to your terminal, to receive detailed information about the problematic deployment:
kubectl describe deployment <DEPLOYMENT_NAME> -n runaiandkubectl describe deployment <DEPLOYMENT_NAME> -n runai-backend - Paste the following commands to your terminal, to check the replicaset details associated with the deployment:
kubectl describe replicaset <REPLICASET_NAME> -n runaiandkubectl describe replicaset <REPLICASET_NAME> -n runai-backend - Paste the following commands to your terminal to retrieve the logs for the deployment to identify any errors or issues:
kubectl logs deployment/<DEPLOYMENT_NAME> -n runaiandkubectl logs deployment/<DEPLOYMENT_NAME> -n runai-backend - From the logs and the detailed information provided by the
describecommands, analyze the reasons why the deployment is unable to create pods. Look for common issues such as:- Resource constraints (CPU, memory)
- Misconfigured deployment settings or replicasets
- Node selector or affinity rules preventing pod scheduling
- Paste the following commands to your terminal, to receive detailed information about the problematic deployment:
NVIDIA Run:ai Project Controller Reconcile Failure
- Meaning - The
project-controllerinrunainamespace had errors while reconciling projects - Impact - Some projects might not be in the “Ready” state. This means that they are not fully operational and may not have all the necessary components running or configured correctly.
- Severity - Critical
- Diagnosis - Retrieve the logs for the
project-controllerdeployment by pasting the following command in your terminal:kubectl logs deployment/project-controller -n runai. Carefully examine the logs for any errors or warning messages. These logs help you understand what might be going wrong with the project controller. - Troubleshooting/Mitigation - Once errors in the log have been identified, follow these steps to mitigate the issue. The error messages in the logs should provide detailed information about the problem:
- Read through them to understand the nature of the issue. If the logs indicate which project failed to reconcile, you can further investigate by checking the status of that specific project.
- Run the following command, replacing
<PROJECT_NAME>with the name of the problematic project:kubectl get project <PROJECT_NAME> -o yaml - Review the status section in the YAML output. This section describes the current state of the project and provide insights into what might be causing the failure.
NVIDIA Run:ai StatefulSet Insufficient Replicas / StatefulSet No Available Replicas
- Meaning -
Runaistatefulset has no available pods - Impact - Absence of Metrics Database Unavailability
- Severity - Critical
- Diagnosis - To diagnose the issue, follow these steps:
- Check the status of the stateful sets in the
runai-backendnamespace by running the following command:kubectl get statefulset -n runai-backend - Identify any stateful sets that have no running pods. These are the ones that might be causing the problem.
- Check the status of the stateful sets in the
- Troubleshooting/Mitigation - Once you’ve identified the problematic stateful sets, follow these steps to mitigate the issue:
- Describe the stateful set to get detailed information on why it cannot create pods. Replace
Xwith the name of the stateful set:kubectl describe statefulset X -n runai-backend - Review the description output to understand the root cause of the issue. Look for events or error messages that explain why the pods are not being created.
- Describe the stateful set to get detailed information on why it cannot create pods. Replace
Adding a Custom Alert
You can add additional alerts from NVIDIA Run:ai. Alerts are triggered by using the Prometheus query language with any NVIDIA Run:ai metric.
To create an alert, follow these steps using Prometheus query language with NVIDIA Run:ai Metrics:
-
Modify Values File: Use the upgrade cluster instructions to modify the values file.
-
Add Alert Structure: Incorporate alerts according to the structure outlined below. Replace placeholders
<ALERT-NAME>,<ALERT-SUMMARY-TEXT>,<PROMQL-EXPRESSION>,<optional: duration s/m/h>, and<critical/warning>with appropriate values for your alert, as described below:<ALERT-NAME>: Choose a descriptive name for your alert, such asHighCPUUsageorLowMemory.<ALERT-SUMMARY-TEXT>: Provide a brief summary of what the alert signifies, for example,High CPU usage detectedorMemory usage below threshold.<PROMQL-EXPRESSION>: Construct a Prometheus query (PROMQL) that defines the conditions under which the alert should trigger. This query should evaluate to a boolean value (1for alert,0for no alert).<optional: duration s/m/h>: Optionally, specify a duration in seconds (s), minutes (m), or hours (h) that the alert condition should persist before triggering an alert. If not specified, the alert triggers as soon as the condition is met.<critical/warning>: Assign a severity level to the alert, indicating its importance. Choose betweencriticalfor severe issues requiring immediate attention, orwarningfor less critical issues that still need monitoring.
You can find an example in the Prometheus documentation.