

Resource Monitor#
Overview#
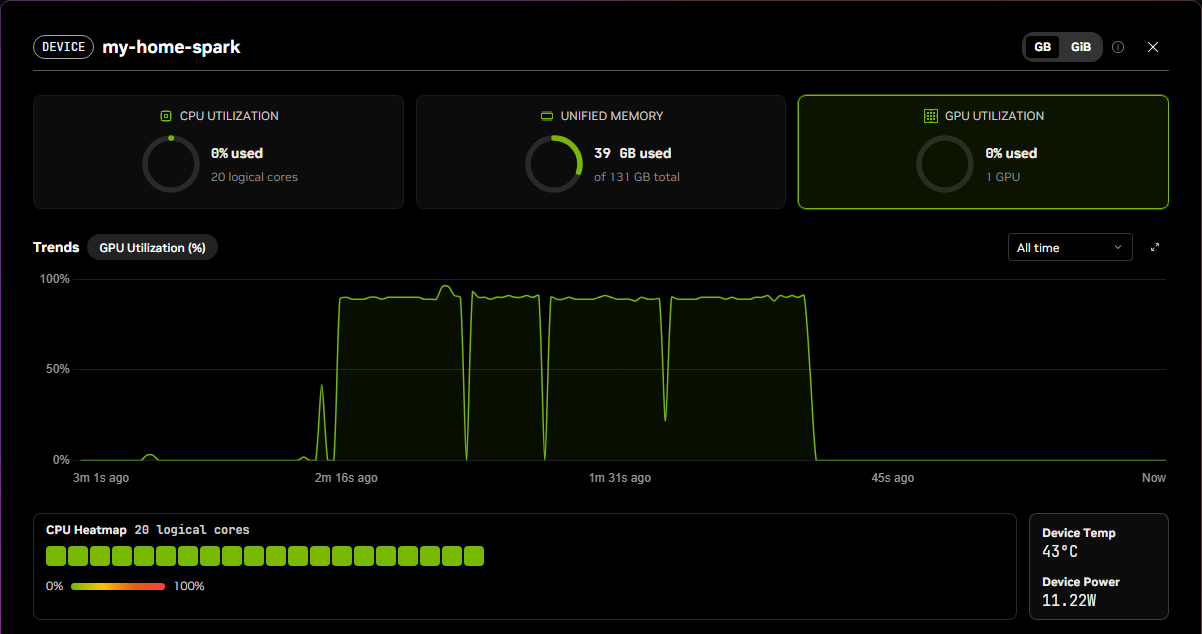
NVIDIA Sync has a resource monitor that shows utilization for system components such as CPU, sRAM, vRAM, and GPU.
The resource monitor shows what is happening on a single device or a cluster.
It reports instantaneous values and plots them over time.
It breaks out CPU utilization by individual core.
The resource monitor displays live data and keeps a limited history while its window is open.
The data is not saved to disk.
Closing the resource monitor window erases the related data.
The time plots include a marquee that lets you select regions for inspection.
You can click and drag to narrow the viewing window.
After you select a region, you can reset the zoom.
You can also specify a backward-looking time interval to skip the marquee.
Opening the Resource Monitor#
To open the resource monitor for a single device:
Open NVIDIA Sync and connect to the device.
In the NVIDIA Sync pop-up window, select Resource Monitor and wait for it to open.
At the top of the window, select the resource you want to plot over time.
Hover over an individual CPU core at the bottom of the window to see its numerical utilization.
To open the resource monitor for a cluster:
Open NVIDIA Sync and confirm that all devices in the cluster are connected.
Go to Settings > Clusters.
Select the resource monitor icon from the cluster card.
When the window opens, select individual devices to view their resources.
FAQ and Common Issues#
I am seeing a “Telemetry Unavailable” banner at the top.
The resource monitor uses the direct SSH or Tailscale connection to the device, and momentary lags or lapses in those connections stop the flow of data. As long as the connection persists, telemetry resumes.
These correspond to times when telemetry was unavailable, most likely because of momentary lags in the connection to the device.