Troubleshooting#
For any crashes for any of the components or troubleshooting help
Please report to NVIDIA the following:
Complete logs for the component and related component (ideally all logs). Please see below a short script to collect all the pod logs from the deployment setup -
#!/bin/bash
for pod in $(kubectl get pods -o go-template --template '{{range .items}}{{.metadata.name}}{{"\n"}}{{end}}')
do
    #depending on logs, this may take a while
    kubectl logs --all-containers $pod > $pod.txt
done
Capture nvidia-smi or equivalent GPU utilization data
Capture CPU & memory utilization data
Capture console logs from UI
Where applicable, please share a video of the interaction.
UI and Iframe Errors#
The below section goes through the different errors that can appear in the Tokkio UI and Tokkio Iframe.
General Troubleshooting Checklist#
All containers are up and running
Poor network conditions over VPN. See recommended bandwidth table.
STUN/TURN server is correctly deployed, configured & accessible in VST. Refer to the Trickle ICE section.
There is no version mismatch between UI and VST containers. Refer Tokkio Documentation.
Microphone & Camera is connected to system.
LLM keys are correctly set & not expired (in case of separate RAG deployment)
GPU drivers are correctly configured. The GPU should be one of the recommended ones. Refer Tokkio Documentation.
Make sure the web browser is supported. The supported web browsers are chrome & safari.
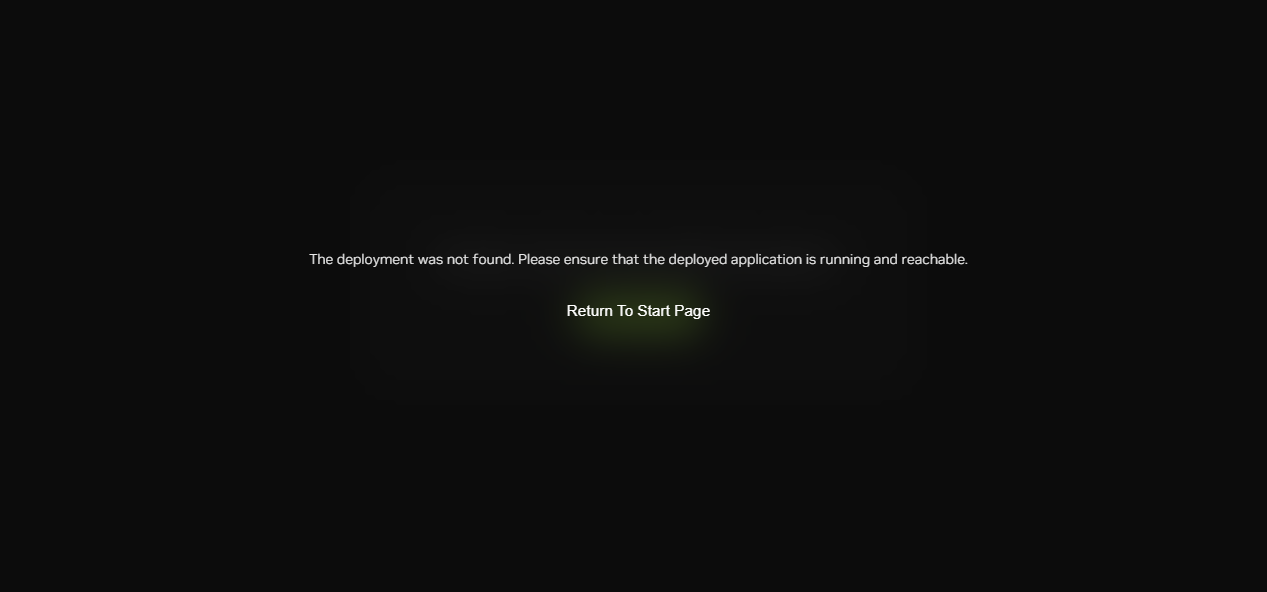
Deployment Not Found#
This error appears when the location of the Tokkio deployment is misconfigured in the UI.
Appearance in Tokkio UI#
Appearance in Iframe#
Resolution#
If deploying the UI or Iframe without the deployment scripts, first ensure that the Tokkio deployment is healthy and reachable. This can be done by hitting the /health endpoint, using the below cURL command:
curl http(s)://<ingress endpoint>/health
If the deployment is healthy, you should see an empty list for unhealthy services in the response payload.
$ curl http://10.128.34.39:30888/health
{"unhealthy_services":[],"healthy_services":["....", "....."]}
If the endpoint does not respond as expected, you must ensure that the deployment is running and the machine you are running it on is reachable by the client.
Once you have verified that the deployment is healthy, confirm that the deployment endpoint is configured correctly in the UI. In the Tokkio Iframe, this is the INGRESS_ENDPOINT config option, and in the Tokkio UI, this is the UI_SERVER_ENDPOINT option. Take the time to read through the documentation for the Configuration or Configuration to ensure that the deployment is configured properly.
If deploying the UI with the deployment scripts, ensure that the above deployment location configs are not set, these will be set automatically by the deployment scripts.
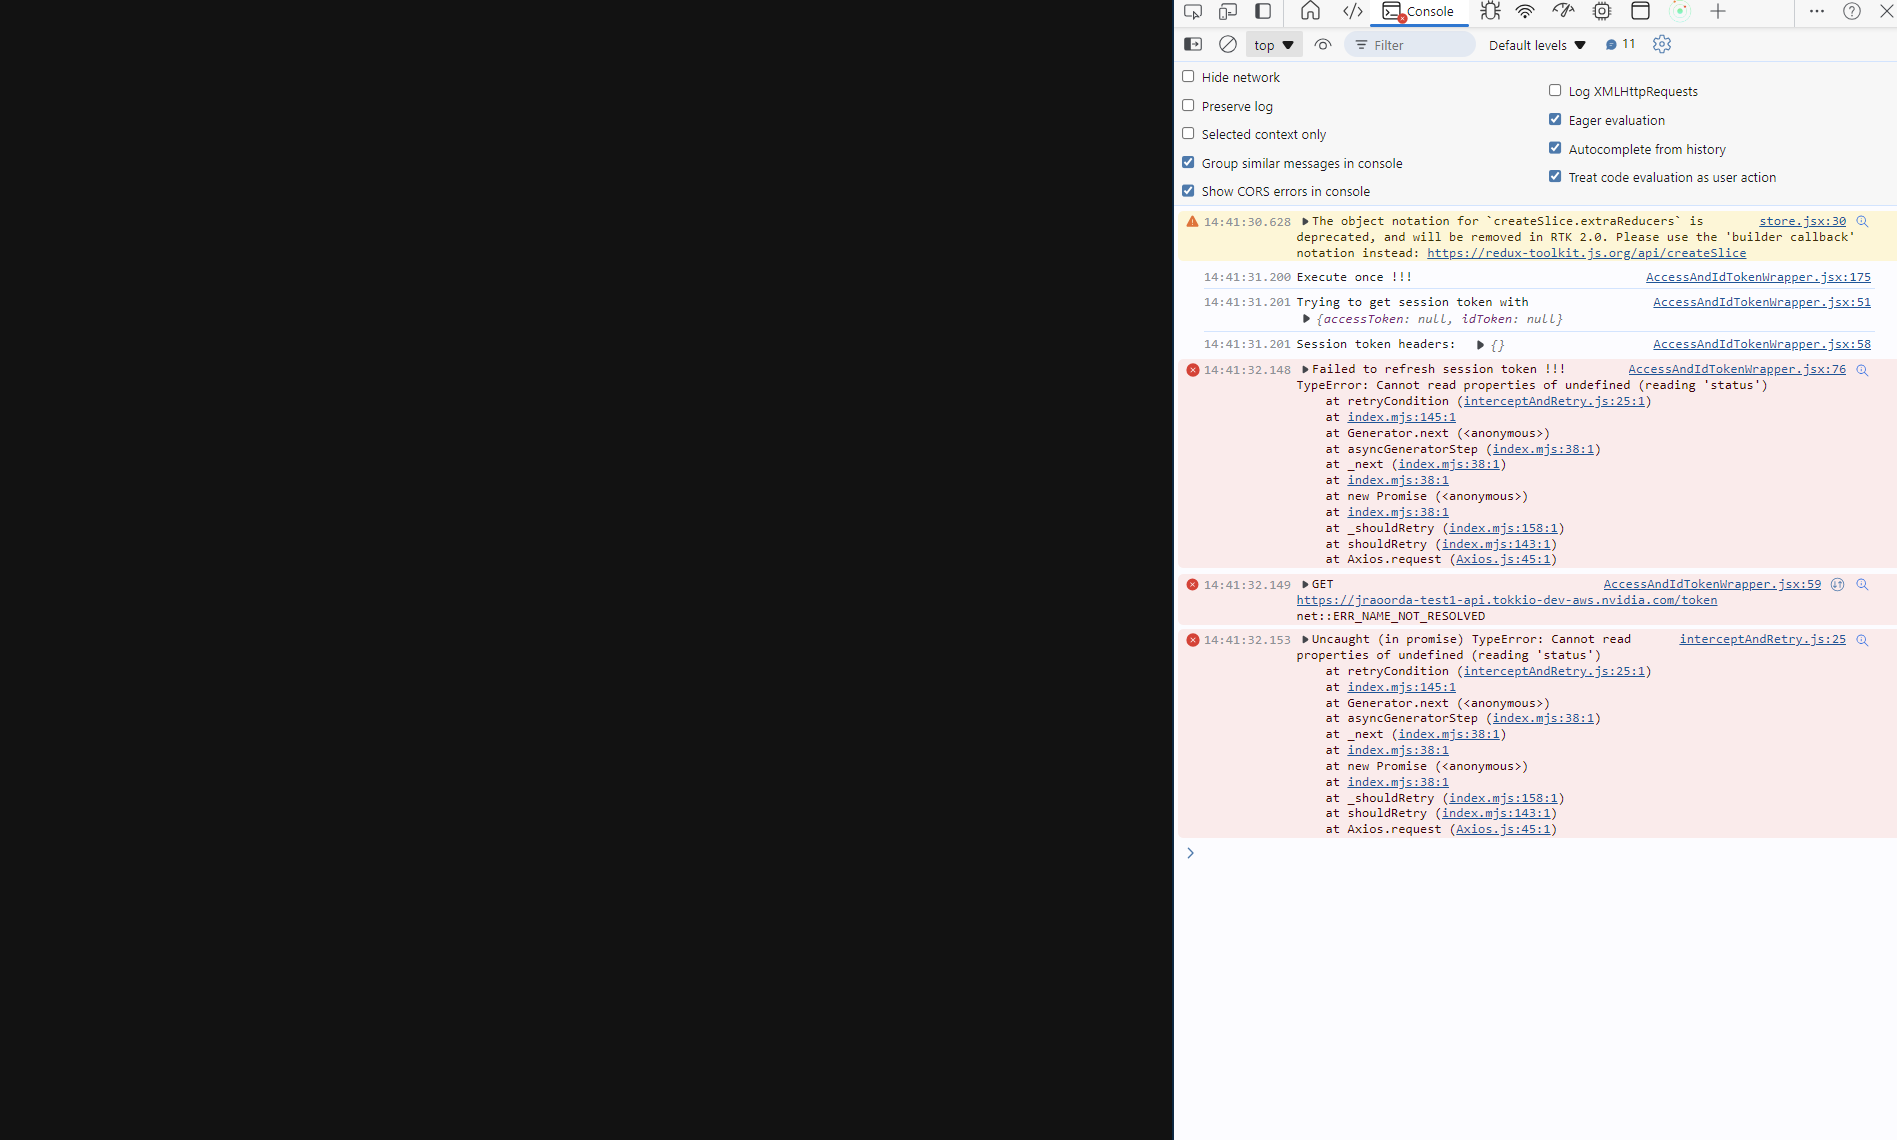
Avatar Stream Not Connecting#
Upon startup, the UI will get the user’s video and audio stream, connect to the VST microservice WebSocket, then establish a webRTC connection for the avatar video. If any part of this process fails, then this error will appear.
Appearance in Tokkio UI#
Appearance in Iframe#
Resolution#
There are a number of possible reasons that this can show up.
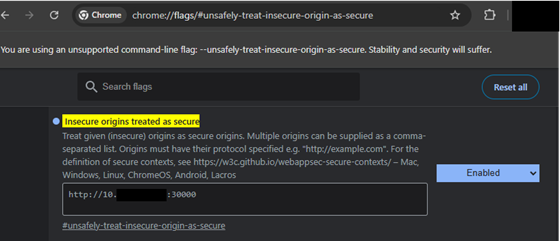
If Tokkio or the UI is deployed over HTTP and not HTTPS, browser flags need to be set in the user’s browser to treat the Tokkio and UI deployment endpoints as secure. On Google Chrome, this is done by navigating to the
chrome://flagsURL, opening theInsecure origin treated as secureoption, then adding the insecure Tokkio endpoints to the text box. This will usually be a string like this:http://<ingress IP:PORT>,ws://<ingress IP:PORT>.The browser window must have access to the user’s microphone. If deploying over remote desktop, there will not be a microphone on the system, and this error will appear. If the camera is enabled, the browser must also have access to a camera.
If any user has multiple UIs open in their browser, this can cause the backend to lose track of the total number of streams, and fail to notify the UI that there is no capacity. In this case, the WebSocket connection will be rejected, and this error will appear.
The coturn server must be configured correctly in the VST microservice. If coturn is not set up properly, the avatar wheel will spin for a long time before showing the error.
If not deploying the UI with the deployment scripts, ensure that the VST endpoint is configured correctly in the UI. In the Tokkio Iframe, this is the
VST_ENDPOINTconfig option, and in the Tokkio UI, this is theVST_WEBSOCKET_ENDPOINToption. Take the time to read through the documentation for the UI or Iframe to ensure that the deployment is configured properly.If deploying the UI with the deployment scripts, ensure that the above deployment location configs are not set, these will be set automatically by the deployment scripts.
One can check the browser logs to narrow down the issue as well.
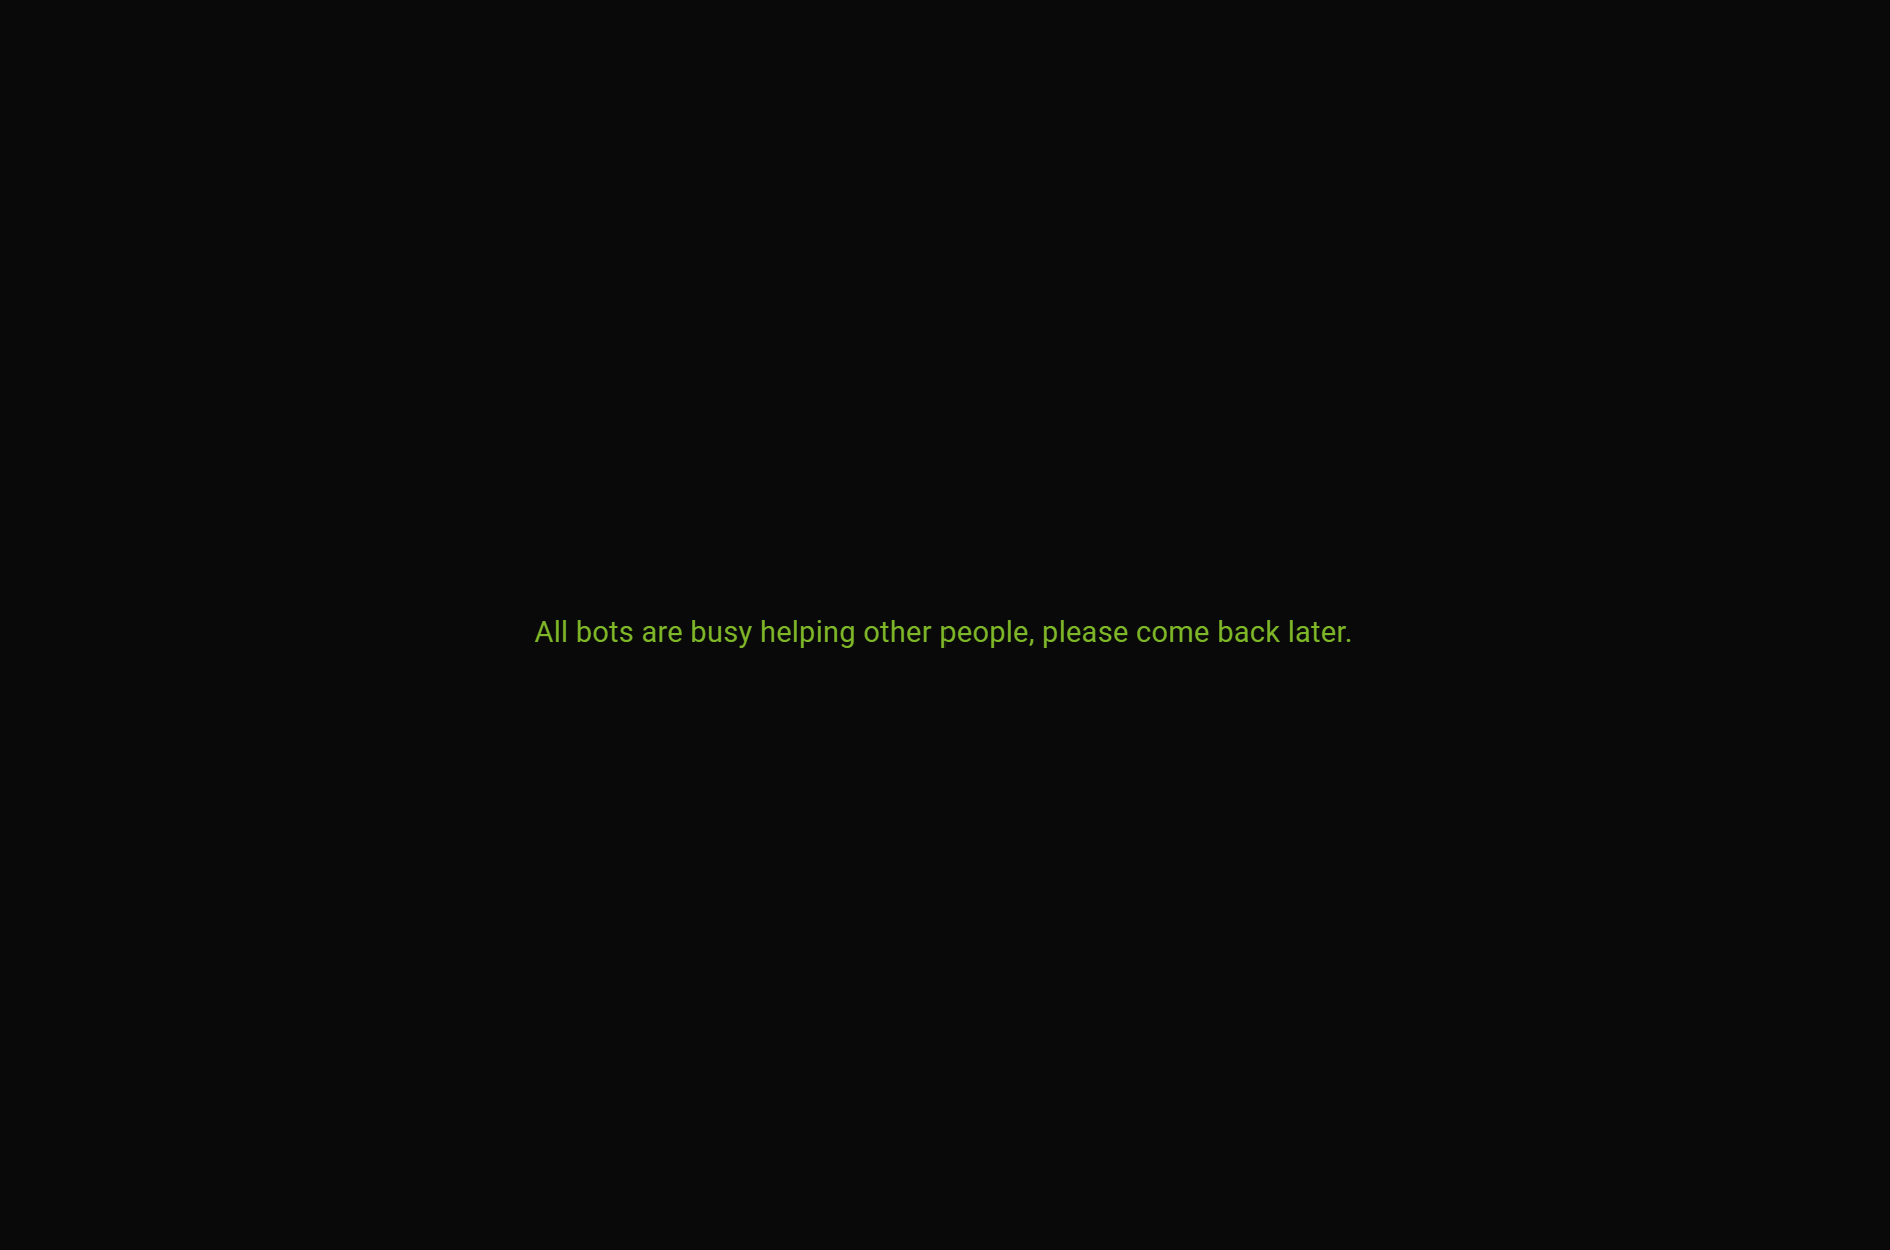
Capacity Full#
This error appears when the UI connects to Tokkio, but all of the streams are being used by others.
Appearance in Tokkio UI#
Appearance in Iframe#

Resolution#
Ensure that there are less people using the system than there are streams available. After closing the UI, it will take a minute or two for the stream used by that UI to free up.
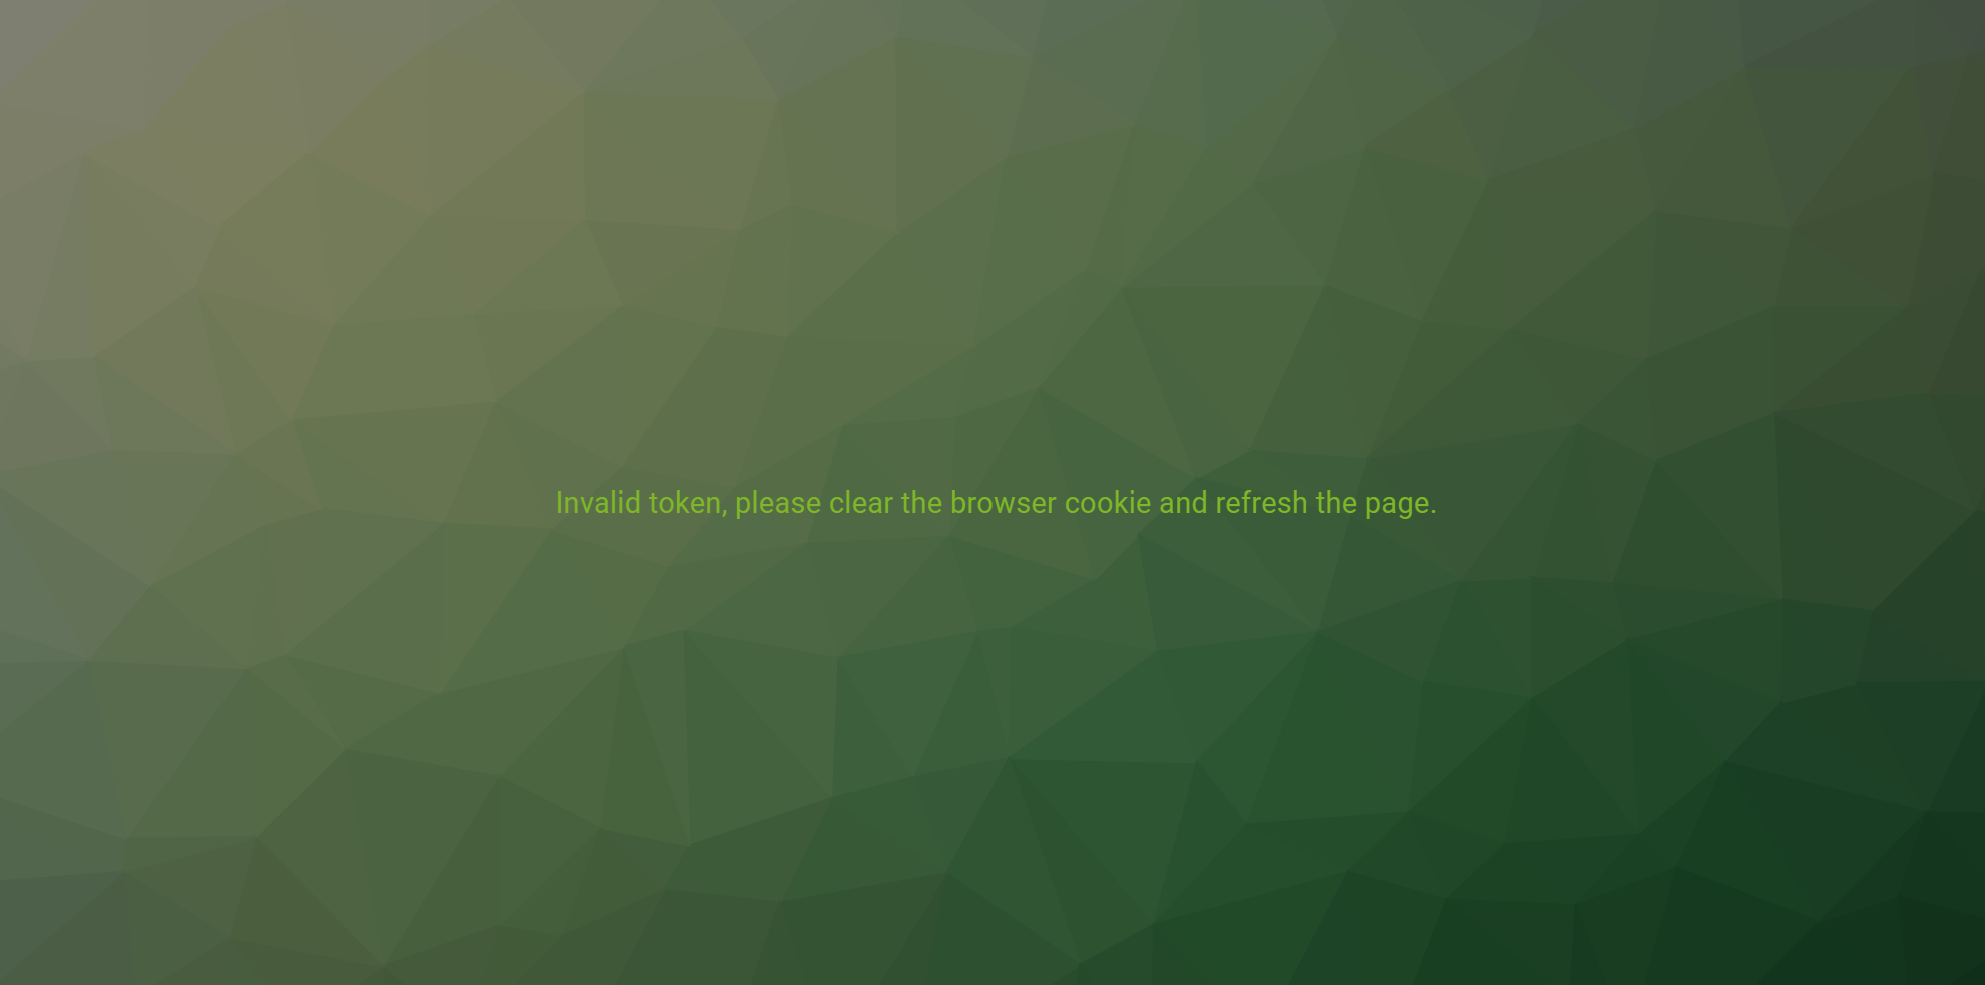
Invalid token#
This error appears when the user attempts to call an endpoint in Tokkio without a session token.
Appearance in Tokkio UI#
Appearance in Iframe#
Avatar will appear for a moment, before showing the capacity full error message. Console logs may show an HTTP 400 error.
Resolution#
Ensure that cookies are enabled in your browser. Clear your cookies and history, and do not open Tokkio in incognito mode.
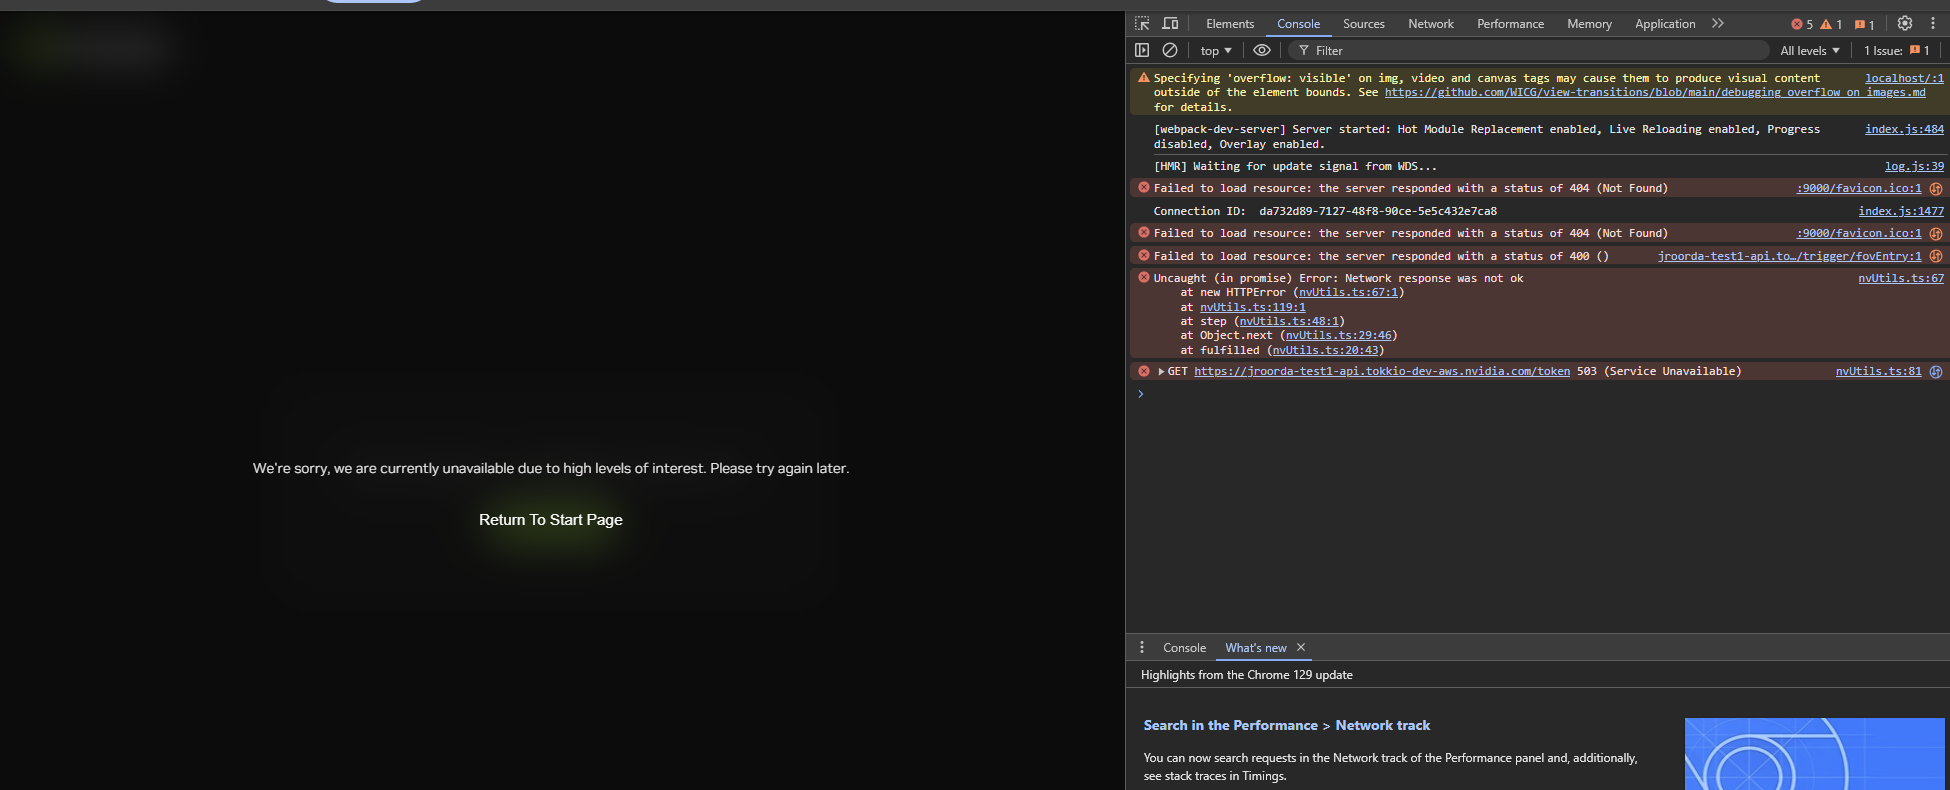
SDR Error Reporting#
This error appears when one of the backend services has crashed, then recovered.
Appearance in Tokkio UI#
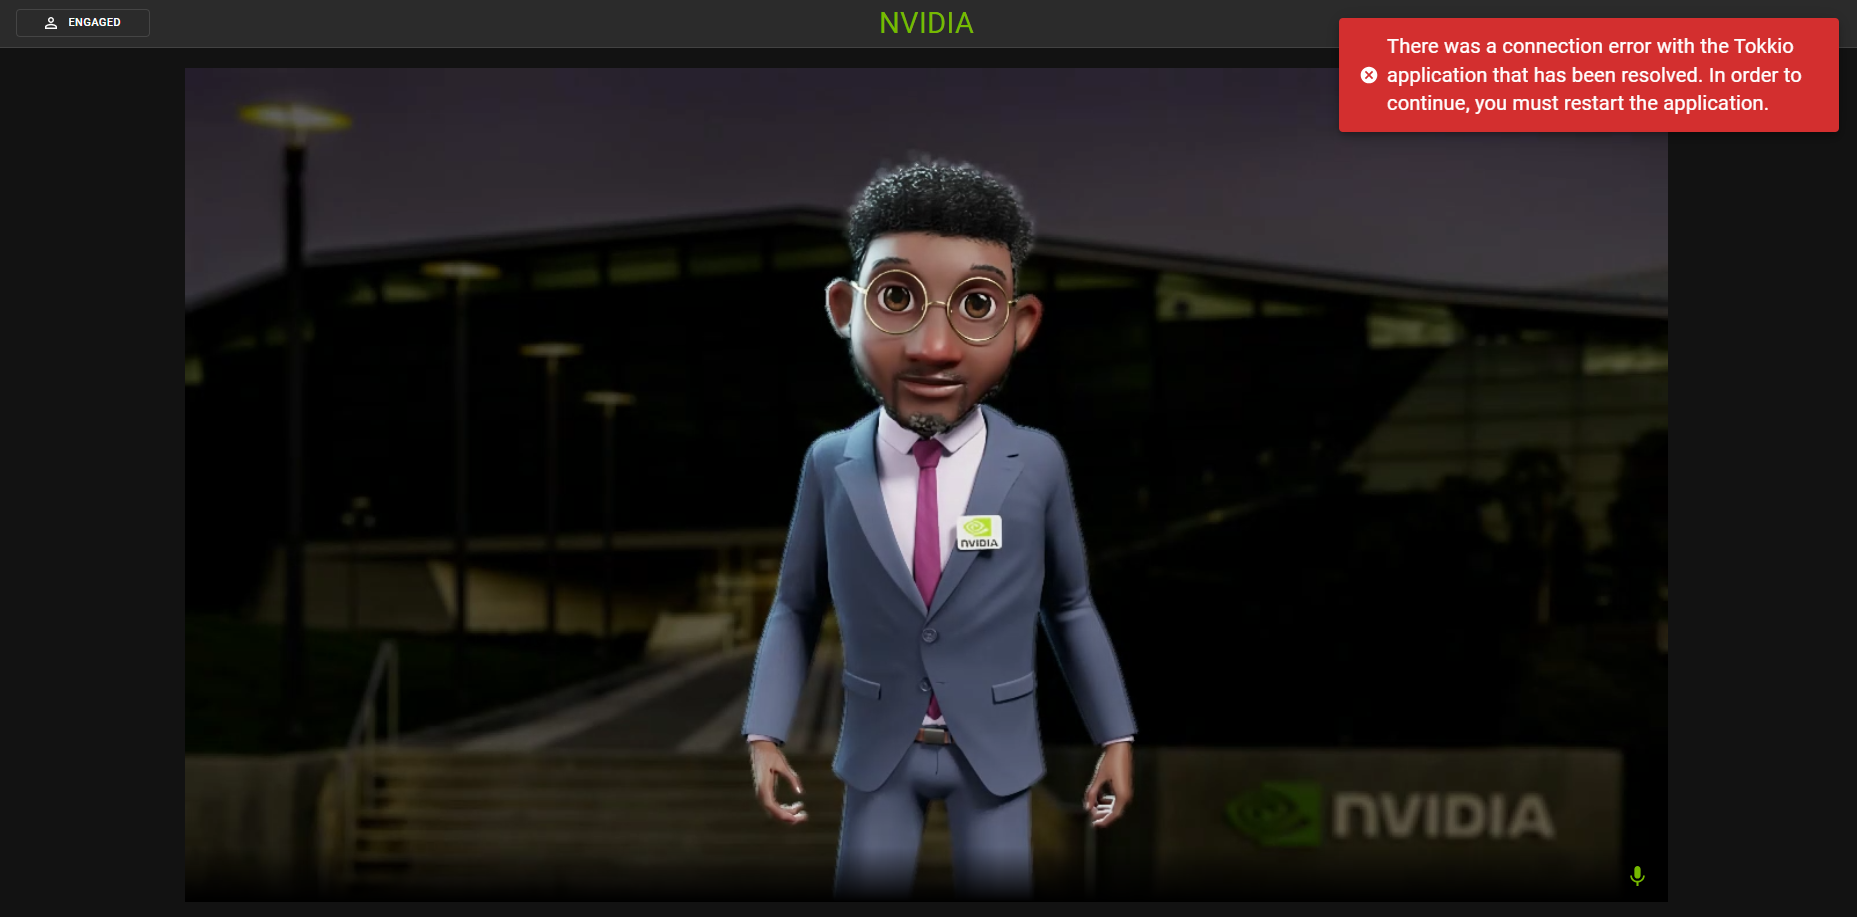
Appearance in Iframe#
This error will not appear in the Iframe, the failure will happen silently. If the avatar video or Tokkio feature stops working abruptly, it is possible that a crash happened.
Resolution#
The error resolved itself by restarting the failing pod. Restart the UI to return to normal.
Recommended Network Bandwidth#
The network bandwidth should be in between minimum bitrate to maximum bitrate range for each specified resolution. If the network bandwidth is low the video will stutter or freeze. There will be blocking artifacts. If the network bandwidth is too low and unstable that can also result in disconnection. A bandwidth value higher than max bitrate is harmless as it will not be utilized by the system.
Resolution |
Min Bitrate (Mbps) |
Optimal Bitrate (Mbps) |
Max Bitrate (Mbps) |
|---|---|---|---|
3820 x 2160 (4k) |
30 |
40 |
80 |
2460 x 1440p (2k or QHD) |
15 |
20 |
40 |
1920 x 1080 (1k or FHD) |
5 |
10 |
20 |
1280 x 720 (HD) |
2 |
5 |
10 |
854 x 480 (FWVGA) |
0.8 |
3 |
5 |
Trickle ICE#
A simple way to check the functioning of ICE Servers is to use a testing tool for WebRTC’s Trickle ICE functionality. Trickle ICE is a technique that allows the gathering and sharing of ICE candidates (potential connection paths) to happen gradually, which can speed up the connection process. Trickle ICE is not applicable in case of RP or reverse proxy.
Testing STUN Servers: A STUN server test is successful if a candidate with type “srflx” is gathered.
Testing TURN Servers: A TURN server test is successful if a candidate with type “relay” is gathered.
Credential Testing: When testing a single TURN/UDP server, the page can detect if incorrect credentials are used for authentication.
Detailed Information: The page displays a table with detailed information about each gathered candidate, including time, type, foundation, protocol, address, port, priority, and additional details when applicable.
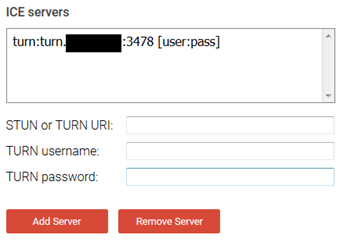
Add stun or turn URI information then click on add server. For example,
STUN or TURN URI: turn:15.266.16.245:3478

TURN username: coturn-admin

TURN password: "Uq3CFRYKr6rFVFcc
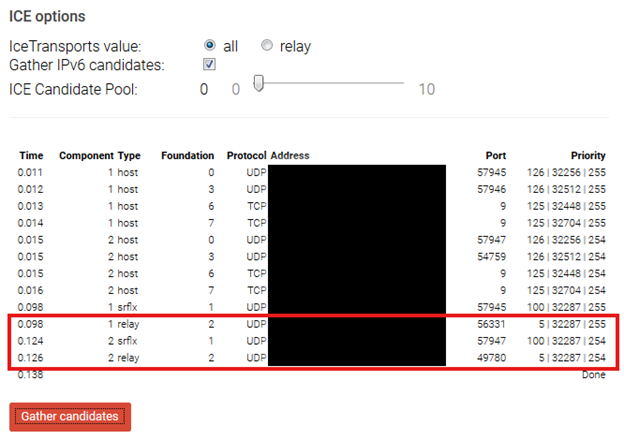
Click on Gather candidates to generate ICE candidates. If you see a relay candidate being generated that means the ICE servers are working as intended.
Microphone or Camera access is denied#
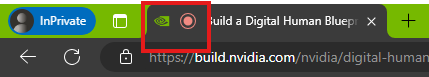
If microphone access is successful a recording icon will appear in the browser tab. If the icon does not appear or UI gives an error that microphone permission was denied in that case, follow below steps. There can be multiple reasons for it.
Appearance in UI#
This error will occur in below cases.
Microphone is not connected to system#
Resolution#
Ensure that a working microphone is connected to the system and cable is not loose.
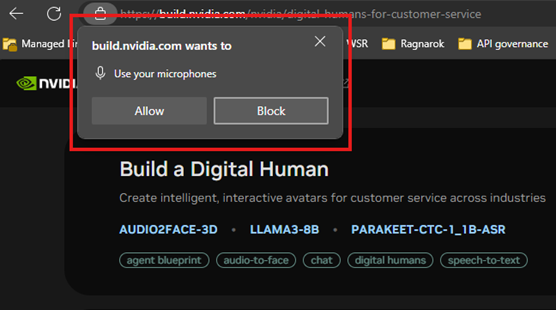
Microphone access was denied by user in the permission prompt#
The browser will ask the user for microphone access permission. If a user clicks outside of the prompt or denies it then the browser will remember this setting and now each time the UI tries to access the microphone it will be denied by the browser.
Appearance in UI#
Resolution#
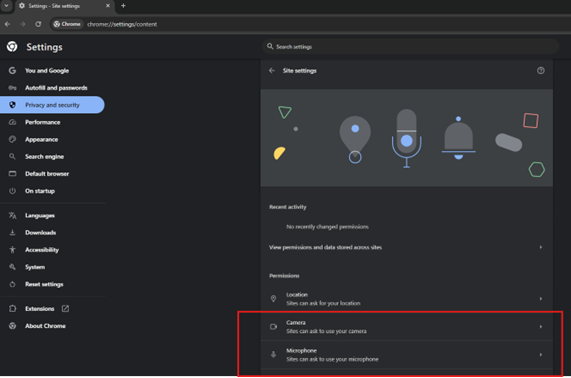
To fix this issue users will need to clear or reset their browser permissions for the web page that is trying to access the microphone. The settings to reset the microphone permissions in Google Chrome are located at Settings/Privacy and security/Site settings.
Microphone is faulty
Try recording from the microphone using another application and check if it’s in working condition. Visit Google WebRTC getusermedia audio sample webpage and check if microphone access is working there.
There is issue in GetUserMedia API, and browser is unable to access microphone
Sometimes the getUserMedia() API of a Web browser may block the access to the microphone if it notices that the microphone access is getting abused. This condition is rare. In these cases, restarting the system (Where UI is opened) fixes the issue. Visit Google WebRTC getusermedia audio sample webpage and check if microphone access is working there or not to confirm it.
Black screen Tokkio UI, non-WebRTC#
A black screen in the video player might occur if the Tokkio UI application is not able to establish a consistent WebSocket Connection. This section will cover non-WebRTC related issues for black screen.
This error will occur in below cases.
Chrome flags are not set (Development Setup)#
If the Tokkio UI deployment is not in production and a UI development setup is being used, then setting incorrect chrome flags will result in WebSocket connection failure. A development setup is not ideal, and users need to do a workaround for CORS and security related issues in web browsers.
Resolution#
To bypass these security issues users, need to set unsafely-treat-insecure-origin-as-secure chrome flag. The value should be the domain name where Tokkio UI is hosted. Note that chrome needs to be re-launched after changing these settings.
Ingress is not configured for WebSocket#
WebSocket connection will fail if the ingress is not configured to handle WebSocket connection.
Resolution#
The WebSocket connection involves a HTTP upgrade request. Ingress needs to be configured to handle this upgrade request.
Black screen for Avatar, WebRTC related#
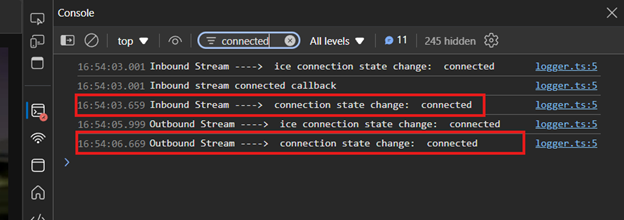
A black screen in the video player might occur if the Tokkio UI application is not able to establish a consistent WebRTC Connection. This section will cover WebRTC related issues for black screen. You can check the status of connection of outbound stream (Microphone) and inbound stream (avatar) using Tokkio UI & VST logs. It’s easier to check the status via Tokkio UI logs.
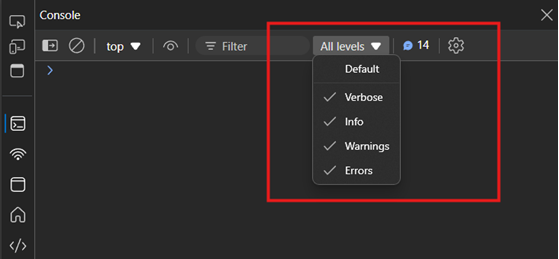
To check stream status via Tokkio UI logs - open developer tools of google chrome and go to console. Ensure that all log levels are selected in the dropdown. In the console log filters write “connected” without quotes. Now you can observe logs stating whether inbound stream and outbound stream went into connected state or not.
Appearance in UI#
This error will occur in below cases
Outbound Stream (Microphone) is connected but inbound stream (Avatar) failed to connect#
There can be many reasons why inbound stream might fail to connect. Most common causes are related to the TURN server. Both peers should be able to generate relay ICE candidates on their side (Not applicable in case of RP or Reverse Proxy). If one of them is unable to generate relay candidates, then the inbound stream will fail to connect.
Resolution#
The TURN server needs to be properly configured & accessible. To check the functioning of the TURN server we can use the methods below.
Check VST & Tokkio UI logs to check if ICE Candidates of type relay are being generated.
For Tokkio UI logs put a “relay” string without quotes in the console logs filter. You should see a log similar to the below string indicating that a relay candidate was generated at the UI side.
onIceCandidate callback: candidate:587694270 1 udp 1677729535 59.125.156.172 50276 typ relay raddr 10.60.186.82 rport 43969 generation 0 ufrag EQFc network-cost 50
For VST logs, search for string “relay” in the logs. You should see the log below indicating that the relay candidate was generated at the VST side.
WebrtcCallbacks.cpp:118: OnIceCandidate] OnIceCandidate candidate = candidate:875259427 1 udp 41820159 10.60.186.82 57132 typ relay raddr 10.60.186.82 rport 43969 generation 0 ufrag SZEn network-id 2 network-cost 50
Refer to Trickle ICE section to check if ICE Candidates of type relay are being generated at Tokkio UI side.
If the WebRTC port range is blocked in the deployed system, then inbound stream connection will fail. WebRTC requires a range of ports to be opened. Ensure that these ports are not blocked. The range is mentioned in webrtc_port_range config of VST. Check if the firewall is not blocking the WebRTC ports. Flush the iptables to unblock the connection using below commands.
sudo iptables -F
sudo iptables -P INPUT ACCEPT
sudo iptables -P FORWARD ACCEPT
sudo iptables -P OUTPUT ACCEPT
Only in case WebCam/Vision AI is enabled where the inbound stream might not start is when the FOV (Field of view) entry is not triggered. In the case of WebCam stream the FOV is triggered when the user is inside the frame. In the case of microphone -only stream the FOV is artificially triggered by UI server service. Need to check UI server logs to see if it triggers the FOV correctly once the camera add Redis event is sent from VST.
Both streams are connected but data is not received in inbound stream (Avatar)#
If both streams are connected but black screen is observed, that means data for Avatar stream may not be received by VST and so not received by Tokkio UI as well. It may also be the case that the VST didn’t receive the GRPC call from OV renderer. Look for below logs in VST logs to confirm whether it received GRPC call or not. If the logs below are not present that means GRPC call failed.
[2024-12-20T9:50:43.508Z:137988407297600:nvgrpc.cpp:217: CreateUDPConnection]   GRPC call CreateUDPConnection
[2024-12-20T9:50:43.508Z:137988407297600:nvgrpc.cpp:304: addDevice]     addDevice
[2024-12-20T9:50:43.508Z:137988407297600:nvgrpc.cpp:141: parseFromClientRequest]        GRPC Client video params codec:h264, fps:30
[2024-12-20T9:50:43.508Z:137988407297600:nvgrpc.cpp:149: parseFromClientRequest]        GRPC Client audio params codec:pcm, sample_rate:16000, bps:32
[2024-12-20T9:50:43.508Z:137988407297600:nvgrpc.cpp:407: addDevice]     audio_enable:1, audio_codec = pcm, sample_rate = 16000, bps = 32
Resolution#
The most common solution is to restart the A2F service, OV renderer service and check if it fixes the issue. If this doesn’t work, try restarting the SDR of OV renderer and A2F as well.
Session ends abruptly within few seconds#
A session may begin but end abruptly within a few seconds. This is the result of the WebSocket connection getting disconnected within a few seconds. A consistent WebSocket connection in requirement for Tokkio UI.
The WebSocket connection is closed because no data is flowing in it#
By default, most ingress will drop the WebSocket connection if they observe that no data is flowing through it.
Resolution#
The solution is to enable WebSocket ping messages via Tokkio UI config. This will ensure that dummy data is sent every few seconds.
WebSocket connection is closed because the frequency of ping-pong#
If the frequency of ping messages is lower than WebSocket timeout set at ingress, then WebSocket connection might drop. Even if the WebSocket ping is enabled in Tokkio UI config it may happen that the frequency of ping messages being sent is less than the configured setting for dropping connection in ingress.
Resolution#
Increasing the frequency via Tokkio UI config will fix the issue.
Avatar video stutters or freezes followed by occasional session closures#
If everything else works fine but there are video stuttering issues, video freezing issues and occasional connection drops then check for below cases.
The network connection is slow#
If the network speed is slow then this issue may occur.
Resolution#
Check the network speed using any online speed measurement tools. Ensure that if you are using VPN the connection speed is not being throttled by VPN. Ensure the location you are connected to via VPN is not far away. Refer to the resolution vs bitrate table.
VST is not configured for Avatar resolution#
VST has a config called webrtc_video_quality_tunning to set bitrate ranges for different resolutions.
Resolution#
Ensure that the bitrate settings are realistic. For example, a high bitrate requirement for a 720p stream is not practical. Ensure that the network can provide the bandwidth required for that bitrate.
High CPU usage at client side#
If the CPU usage is high at client side where Tokkio UI is open, the UI may not get sufficient resources to stream the avatar. In that case video can stutter.
Resolution#
Check the CPU usage using task manager in windows.
The network is congested#
If the network is congested, then it will result in frequent packet drops and poor-quality streaming.
Resolution#
Ensure that the network is not congested by looking at the WebRTC stats. Refer to the WebRTC Stats section.
Tokkio vision tuning#
To disable VisionAI or the user attention visit Disable Tokkio vision To change the sensitivity of the user attention visit: Metropolis User Occupancy and Engagement Alerts
Manually triggering ADD / REMOVE calls from SDR#
Send “CAMERA_ADD” Redis message to vst_events to trigger SDR ADD call
$ xadd vst_events * sensor.id "{\"alert_type\":\"camera_status_change\",\"created_at\":\"2024-09-26T18:00:17Z\",\"event\":{\"camera_id\":\"3477c96b-5e3d-492f-8a5c-3682df2c3b37\",\"camera_name\":\"webcam_3477c96b-5e3d-492f-8a5c-3682df2c3b37\",\"camera_url\":\"rtsp://192.168.33.235:30554/webrtc/3477c96b-5e3d-492f-8a5c-3682df2c3b37\",\"change\":\"camera_add\"},\"source\":\"vst\"}\n"
$ xadd vst_events * sensor.id "{\"alert_type\":\"camera_status_change\",\"created_at\":\"2024-09-26T18:00:19Z\",\"event\":{\"camera_id\":\"3477c96b-5e3d-492f-8a5c-3682df2c3b37\",\"camera_name\":\"webcam_3477c96b-5e3d-492f-8a5c-3682df2c3b37\",\"camera_url\":\"rtsp://192.168.33.235:30554/webrtc/3477c96b-5e3d-492f-8a5c-3682df2c3b37\",\"change\":\"camera_streaming\"},\"source\":\"vst\"}\n"
Check SDR log to make sure ADD call is made
$ kubectl logs -f chat-controller-sdr-envoy-sdr-deployment-bb5dd6588-rmhp7 --tail 1

2024-09-26 19:44:33 lib.podprovisioner.provisionconfig - INFO - Starting add call
2024-09-26 19:44:33 lib.podprovisioner.provisionconfig - INFO - adding camera at http://192.168.33.193:9010/add
2024-09-26 19:44:33 lib.podprovisioner.provisionconfig - INFO - payload: {
"alert_type": "camera_status_change",
"created_at": "2024-09-26T18:00:17Z",
"event": {
    "camera_id": "3477c96b-5e3d-492f-8a5c-3682df2c3b37",
    "camera_name": "webcam_3477c96b-5e3d-492f-8a5c-3682df2c3b37",
    "camera_url": "rtsp://192.168.33.235:30554/webrtc/3477c96b-5e3d-492f-8a5c-3682df2c3b37",
    "change": "camera_add"
},
"source": "vst"
}
2024-09-26 19:44:33 lib.podprovisioner.provisionconfig - INFO - add operation Response Code: 200
2024-09-26 19:44:33 lib.podprovisioner.provisionconfig - INFO - add operation text return: {
        "status" : "STREAM_ADD_SUCCESS"
}
2024-09-26 19:44:33 __main__ - INFO - add operation success updating
                                    the Route mapping
ace-agent-chat-controller-deployment-0: |-
    [
        {
            "alert_type": "camera_status_change",
            "created_at": "2024-09-26T18:00:17Z",
            "event": {
                "camera_id": "3477c96b-5e3d-492f-8a5c-3682df2c3b37",
                "camera_name": "webcam_3477c96b-5e3d-492f-8a5c-3682df2c3b37",
                "camera_url": "rtsp://192.168.33.235:30554/webrtc/3477c96b-5e3d-492f-8a5c-3682df2c3b37",
                "change": "camera_add"
            },
            "source": "vst"
        }
    ]
Send “CAMERA_REMOVE” redis message to vst_events to trigger SDR REMOVE call
$ xadd vst_events * sensor.id "{\"alert_type\":\"camera_status_change\",\"created_at\":\"2024-09-26T18:01:15Z\",\"event\":{\"camera_id\":\"3477c96b-5e3d-492f-8a5c-3682df2c3b37\",\"camera_name\":\"webcam_3477c96b-5e3d-492f-8a5c-3682df2c3b37\",\"camera_url\":\"rtsp://192.168.33.235:30554/webrtc/3477c96b-5e3d-492f-8a5c-3682df2c3b37\",\"change\":\"camera_remove\"},\"source\":\"vst\"}\n"
Check SDR log to make sure REMOVE call is made
See similar instruction for checking ADD call
2024-09-26 19:46:01 werkzeug - INFO - 169.254.3.1 - - [26/Sep/2024 19:46:01] "GET /healthz HTTP/1.1" 200 -
2024-09-26 19:46:01 werkzeug - INFO - 169.254.3.1 - - [26/Sep/2024 19:46:01] "GET /healthz HTTP/1.1" 200 -
2024-09-26 19:46:02 __main__ - INFO - id: 1727379962895-0, content: {'sensor.id': '{"alert_type":"camera_status_change","created_at":"2024-09-26T18:01:15Z","event":{"camera_id":"3477c96b-5e3d-492f-8a5c-3682df2c3b37","camera_name":"webcam_3477c96b-5e3d-492f-8a5c-3682df2c3b37","camera_url":"rtsp://192.168.33.235:30554/webrtc/3477c96b-5e3d-492f-8a5c-3682df2c3b37","change":"camera_remove"},"source":"vst"}\n'}
2024-09-26 19:46:02 __main__ - INFO - {'sensor.id': '{"alert_type":"camera_status_change","created_at":"2024-09-26T18:01:15Z","event":{"camera_id":"3477c96b-5e3d-492f-8a5c-3682df2c3b37","camera_name":"webcam_3477c96b-5e3d-492f-8a5c-3682df2c3b37","camera_url":"rtsp://192.168.33.235:30554/webrtc/3477c96b-5e3d-492f-8a5c-3682df2c3b37","change":"camera_remove"},"source":"vst"}\n'}
2024-09-26 19:46:02 __main__ - INFO - {"alert_type":"camera_status_change","created_at":"2024-09-26T18:01:15Z","event":{"camera_id":"3477c96b-5e3d-492f-8a5c-3682df2c3b37","camera_name":"webcam_3477c96b-5e3d-492f-8a5c-3682df2c3b37","camera_url":"rtsp://192.168.33.235:30554/webrtc/3477c96b-5e3d-492f-8a5c-3682df2c3b37","change":"camera_remove"},"source":"vst"}

2024-09-26 19:46:02 __main__ - INFO - deprovision stream
No response received for queries sent to the Tokkio reference workflow#
Ensure that the microphone used for the speech input is functional
The reference workflows from Tokkio also require a functional camera input to detect a person’s presence in the camera field of view
Check the logs of the chat controller pod to ensure that the input speech is detected
Check the logs of the chat engine pod and the plugin server for errors in retrieving a response
Reach out to Tokkio support point of contact for more information, if needed.
Avatar stuttering or stopping to speak unexpectedly with multiple concurrent sessions#
The avatar speech may become less smooth when the load on compute resources becomes too high. When this happens, Audio2Face-3D inference and blendshape solve can slow down, causing the animation to stutter. Evidence of this can be found in the Audio2Face-3D microservice logs with entries like this:
Streaming <stream ID> at X FPS
Where X is below 30.
If this happens, try reducing the number of concurrent sessions for a smoother experience.
User presence not detected by Tokkio reference workflow#
Ensure that the microphone used for the speech input is functional
The reference workflows from Tokkio also require a functional camera input to detect a person’s presence in the camera field of view
Check the logs of the chat controller pod to check if the input speech is detected
Restart occupancy alerts pods and re-try
Reach out to Tokkio support point of contact for more information, if needed. Include the system logs and a detailed description of the setup configuration in your support request.
Triton pod crashes on T4 GPU with Parakeet model#
There are a couple of options that the users can try here.
1. Change the model used for Tokkio 4.1 asr_conformer_en_us_streaming_throughput_flashlight_vad:2.15.0-tokkio. We can achieve same by passing below user_override_value while deployment.
riva-api:
  modelRepoGenerator:
    ngcModelConfigs:
      triton0:
        models:
        - nvidia/ace/asr_conformer_en_us_streaming_throughput_flashlight_vad:2.15.0-tokkio
        - nvidia/riva/rmir_tts_fastpitch_hifigan_en_us_ipa:2.17.0
you can refer on how to pass user_override_value to OneClick script using Integrating Customization Changes without Rebuild.
The pod will restart a few times for a fresh deployment and then eventually come up. A manual restart of the pod might be required if the pod does not automatically come up after several restarts when doing a 1-click deployment.
ASR and TTS not working on installing a new app with one click script#
Check if the GPU is not available to the Riva init container (NVML Error). Model deployment happens in ONNX format which is not supported and Triton container subsequently fails.
$ kubectl exec -it triton0-bbd77d78f-22dr8 -c riva-model-init /bin/bash -n app group ID 1000 I have no name!@triton0-bbd77d78f-22dr8:/opt/riva$ nvidia-smi Failed to initialize NVML: Unknown Error
Please try the suggestions from NVIDIA Github
Reach out to Tokkio support point of contact for more information, if needed. Include the system logs and a detailed description of the setup configuration in your support request.
UE App does not work on three streams on a fresh Deployment#
Delete the renderer-sdr, ue-renderer and the VMS pod before re-trying.
User Presence not detected even when the user is in FOV#
Uninstall the tokkio app
Delete pvc vms-local-storage, ds-sdr-envoy-agent-storage and delete pv of mongodb, ds-sdr, vms, redis-data
Deploy the app again and check.
Miscellaneous troubleshooting tips when using CSP guides#
In AWS during app installation the scripts might show IAC change due to AWS certificate changes user have to re-run infra and then deploy the app
Updating secrets will not show the modified data and will not restart the pods user has to manually restart the pods
Upgrading the app doesn’t restart all the UE pods have to restart all the UE pods to give streams on all three clients
Upgrade in VMS cm will not restart the pod have to manually restart the pod
Customizations are not reflected in the deployed experience#
If the performed customizations are not reflected in the deployed experience, there are a couple of checks you can do to debug
Check if the performed customizations were overrides vs app specs. When deploying the Tokkio chart, the values present in the overrides values files are used to update the app specs. Ensure that the intended customization is referenced in the correct file and not overridden by an entry in the override values file.
Check if the intended customization needs a chart rebuild. Please refer to the Customize Reference Workflows for a list of the common customizations and indicators regarding the necessity of chart rebuild.
Avatar keeps saying “We are experiencing technical difficulties”#
The default chart for Tokkio uses the LLM-RAG reference workflow configured to send queries to NIM based model (meta/llama3-8b-instruct). One needs API credits in the API Catalog in order to access this NIM endpoint. Typically, in absence of sufficient credits, the bot responds with “We are experiencing technical issues”. One can confirm the issue by checking the logs from the plugin-server-deployment Kubernetes pod when making the query.
If using a custom chart, ensure that you are connecting to a RAG or LLM compatible with the message parsing implemented for your custom version of the Tokkio LLM RAG reference workflow. Please refer to Plugin Server Resource Customization for guidance on various customizations that can be performed for the reference workflow.
Ensure to analyze the logs, especially from the plugin-server-deployment and the chat-engine-deployment kubernetes pods in order to root cause the issue. Refer to the Troubleshooting for guidance on collecting the logs.
Advance diagnostic tools and techniques#
WebRTC Stats#
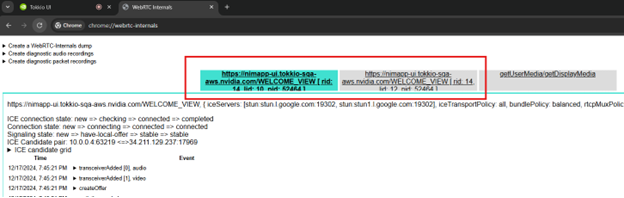
Chrome provides a mechanism to get WebRTC stats in a user-friendly way. The WebRTC stats can give good information about the network conditions, framerates, resolution, audio information, codecs and many other useful things. To check WebRTC stats open chrome://webrtc-internals in a separate chrome tab. In WebRTC internal tabs we can see information for each Peer Connection. In below image we can see there are two Peer Connections, one for Inbound Stream (Avatar) and one for Outbound stream (Microphone)
To check for Inbound stream (Avatar) stats look for section Stats graphs for inbound-rtp. Check the image below for reference.
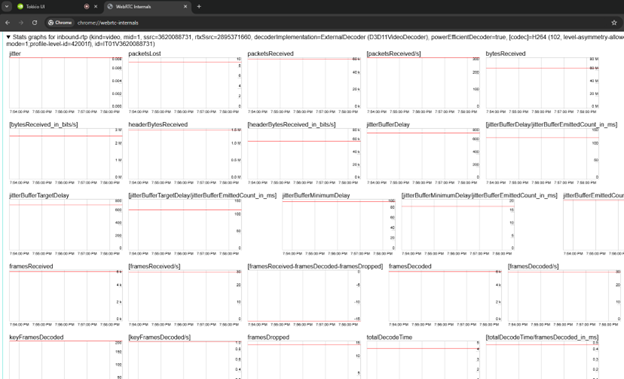
Using these stats we can observe various useful metrics like frames dropped, nack-count, pli-count, framerate, bitrate, packets lost, jitter etc. These metrics are useful to debug any network related issues.
Using these stats we can observe various useful metrics like frames dropped, nack-count, pli-count, framerate, bitrate, packets lost, jitter etc. These metrics are useful to debug any network related issues.
Debugging using VST logs#
VST config: VST config is printed at the beginning of VST logs. It can be used to check current config with which VST is running.
Host HTTP port: 30000 Recorded Video Root: /home/vst/vst_release/vst_video stunurl list: stun.l.google.com:19302, stun1.l.google.com:19302 static_turnurl_list: use_coturn_auth_secret: 0 use_twilio_stun_turn: 0 coturn_turnurl_list_with_secret: twilio_account_sid: twilio_auth_token: use reverse proxy RP: 0

...
Redis server connection: This log can be used to check if VST is able to connect with Redis server.
[2024-12-20T9:49:40.728Z:137990895721664:redis_publisher.cpp:176: redis_init] Radis server address:port= 127.0.0.1;6379 [2024-12-20T9:49:40.728Z:137990895721664:redis_publisher.cpp:187: redis_init] Redis connect success.
GRPC server is listening: This log can be used to check if VST GRPC server is enabled and listening
[2024-12-20T9:49:40.853Z:137988786882112:nvgrpc.cpp:931: RunServer] gRPC Server listening on 0.0.0.0:50051
GPU detected: This log can be used to check if VST detected GPU
[2024-12-20T9:49:40.557Z:137990895721664:utils.cpp:2227: detectGPU]     ############## GPU ID DETECTED = 0 ##############

[2024-12-20T9:49:40.557Z:137990895721664:utils.cpp:2228: detectGPU]     ############## GPU Device = /dev/nvidia0 ##############
Checking WebSocket Connection: This log can be used to check if WebSocket connection was successful
[2024-12-20T9:50:42.164Z:137990862919232:Websocket.cpp:51: addConnection]       Saving connection ID: 1380cd96-aa97-41b4-8f4f-f64f00fc6568

[2024-12-20T9:50:42.164Z:137990862919232:Websocket.cpp:64: addConnection]       Memory allocated to websocket connection ID: 1380cd96-aa97-41b4-8f4f-f64f00fc6568

[2024-12-20T9:50:42.164Z:137990862919232:Websocket.cpp:66: addConnection]       Total websocket connections: 1
Checking Peer Connections: Checking if WebRTC Peer Connections were successful. There should be two of these logs. The one which has Peer ID ending which underscore one (“_1”) is Peer Connection for Avatar stream. The other one is for Peer Connection of WebCam or Microphone stream.
[2024-12-20T9:50:45.223Z:137987255961152:WebrtcCallbacks.cpp:509: OnConnectionChange]    Peer connection state:Connected peerid:1380cd96-aa97-41b4-8f4f-f64f00fc6568

[2024-12-20T9:50:43.484Z:137988304537152:WebrtcCallbacks.cpp:509: OnConnectionChange]    Peer connection state:Connected peerid:1380cd96-aa97-41b4-8f4f-f64f00fc6568_1
Avatar & Microphone Redis events: This log indicates whether Redis events for webcam stream were sent or not. There are two kinds of events. Camera add and Camera streaming. Below logs are relevant to check if redis events are working or not.
[2024-12-20T9:50:43.485Z:137988304537152:PeerConnectionManager.cpp:2653: notify] { "alert_type" : "camera_status_change", "created_at" : "2024-12-20T09:50:43Z", "event" : { "camera_id" : "1380cd96-aa97-41b4-8f4f-f64f00fc6568", "camera_name" : "webcam_1380cd96-aa97-41b4-8f4f-f64f00fc6568", "camera_url" : "rtsp://10.41.25.10:30554/webrtc/1380cd96-aa97-41b4-8f4f-f64f00fc6568", "change" : "camera_add" }, "source" : "vst" }

[2024-12-20T9:50:43.485Z:137989615257152:redis_publisher.cpp:227: sendToRedis] Event sent to Redis Successfully

{ "alert_type" : "camera_status_change", "created_at" : "2024-12-20T09:50:45Z", "event" : { "camera_id" : "1380cd96-aa97-41b4-8f4f-f64f00fc6568", C1380cd96-aa97-41b4-8f4f-f64f00fc6568", "camera_url" : "rtsp://10.41.25.10:30554/webrtc/1380cd96-aa97-41b4-8f4f-f64f00fc6568", "change" : "camera_streaming" }, "source" : "vst" }

[2024-12-20T9:50:45.946Z:137989615257152:redis_publisher.cpp:227: sendToRedis] Event sent to Redis Successfully
FPS of avatar & microphone stream: This log indicates fps of avatar and microphone stream. The log which has UUID as “_out” at end is for avatar stream and with “_in” at end is for WebCam stream. Note that fps for WebCam will be displayed only when video is enabled. If only microphone stream is enabled, then fps will not be printed. Check the sample logs below for more context.
[2024-12-20T12:32:50.739Z:137325361235520:fps_display.cpp:80: displayFPS] Unique ID = 7c4e2774-e3c2-415c-8c8b-ab3d420b92c9_1:7c4e2774-e3c2-415c-8c8b-ab3d420b92c9_1_out FPS = { 29.988873, 29.988873, 29.994843, 30.249584, 29.916251, 29.994792, 30.061507, 29.988936, 29.994792, 29.988936, 29.994843, 30.153816 }

[2024-12-20T12:33:50.7490Z:137325361235520:fps_display.cpp:80: displayFPS] Unique ID = 7c4e2774-e3c2-415c-8c8b-ab3d420b92c9_1:7c4e2774-e3c2-415c-8c8b-ab3d420b92c9_in FPS = { 29.988873, 29.988873, 29.994843, 30.249584, 29.916251, 29.994792, 30.061507, 29.988936, 29.994792, 29.988936, 29.994843, 30.153816 }
Stalled pipeline: When VST is not receiving data in UDP connection it will print stalled pipeline logs. A stalled pipeline means that avatar stream data is not being received by VST in its UDP connection. This means that GRPC call for UDP was successful, but VST is not receiving any data on that connection.
[2024-5-17T6:34:0.614Z:134091898877504:gstnvvideoudpclient.cpp:1192: checkVideoDataFlowStatus] Video data flow is stalled, attempt rest pipeline
GRPC Call: To check if GRPC call was successful or not below logs can used. VST receives the avatar stream data via this GRPC connection.
[2024-12-20T9:50:43.508Z:137988407297600:nvgrpc.cpp:217: CreateUDPConnection]   GRPC call CreateUDPConnection

[2024-12-20T9:50:43.508Z:137988407297600:nvgrpc.cpp:304: addDevice]     addDevice

[2024-12-20T9:50:43.508Z:137988407297600:nvgrpc.cpp:141: parseFromClientRequest]        GRPC Client video params codec:h264, fps:30

[2024-12-20T9:50:43.508Z:137988407297600:nvgrpc.cpp:149: parseFromClientRequest]        GRPC Client audio params codec:pcm, sample_rate:16000, bps:32

[2024-12-20T9:50:43.508Z:137988407297600:nvgrpc.cpp:407: addDevice]     audio_enable:1, audio_codec = pcm, sample_rate = 16000, bps = 32
Reporting unresolved issues#
Attach Tokkio UI logs#
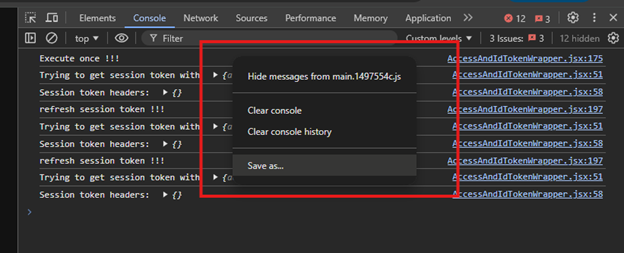
To collect Tokkio UI logs open the developer tools of chrome and go to console. Right click anywhere on the console and save the console logs. Make sure all log levels are enabled before saving the logs as mentioned earlier.
Attach WebRTC stats dump file#
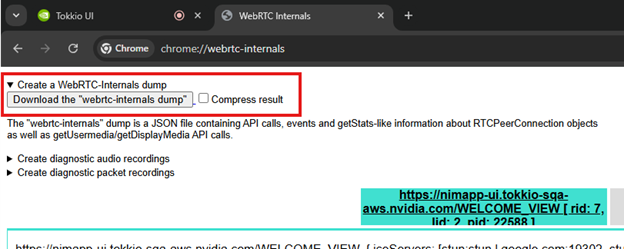
To collect WebRTC stats for logging and reporting an issue you can download a dump of all WebRTC stats using create a WebRTC internal dump option. This will download a JSON file that can be used for debugging purposes. Make sure to let the stats run for a few minutes so that it can collect enough data points.
Attach VST logs file#
Collect VST logs for the session. The VST log file can be found in the logging volume where all services dump their logs, or it can be collected by kubectl logs command. Below script can collect logs from all running containers. Refer to Tokkio Doc troubleshoot section to know more about collecting logs of pods.
#!/bin/bash
for pod in $(kubectl get pods -o go-template --template '{{range .items}}{{.metadata.name}}{{"\n"}}{{end}}')
do
   #depending on logs, this may take a while
   kubectl logs --all-containers $pod > $pod.txt
done
Attach nvidia-smi output#
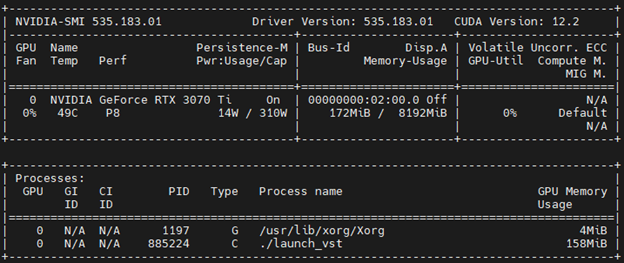
Run nvidia-smi command in terminal and copy its output. This has information about GPU drivers and utilization. The typical output of nvidia-smi will look like the sample log.
Deployment Troubleshooting#
General Troubleshooting#
Using default K8s Namespace#
While bringing up the Tokkio Workflow, if you had set spec.app.configs.app_settings.k8s_namespace = default, in the config file, Application comes up fine. However, during uninstallation of the app only component (–component app), Uninstallation script throws below error.
fatal: [app-master]: FAILED! => {"changed": false, "error": 403, "msg": "Namespace default: Failed to delete object: b'{\"kind\":\"Status\",\"apiVersion\":\"v1\",\"metadata\":{},\"status\":\"Failure\",\"message\":\"namespaces \\\\\"default\\\\\" is forbidden: this namespace may not be deleted\",\"reason\":\"Forbidden\",\"details\":{\"name\":\"default\",\"kind\":\"namespaces\"},\"code\":403}\\n'", "reason": "Forbidden", "status": 403}
As a recommendation, avoid using default kubernetes namespace for spec.app.configs.app_settings.k8s_namespace.
BareMetal#
Certain model deployment happens in ONNX format instead of TRT#
While re-deploying the Tokkio Back-end application only, at times it is observed that some Models get converted into ONNX format instead of TRT format. This can cause issues such as Avatar showing up on UI but not responding to any message. This issue can be confirmed by navigating to triton pod logs and observing the below.
Check the logs of init container riva-model-init under triton pod. Example below:
kubectl logs triton0-7ccdd556bc-62qrr -c riva-model-init -n app

TensorRT is not available! Will use ONNX backend instead
Also, you can scroll through the triton pods’ logs and notice the below lines indicating the incorrect conversion.
kubectl logs triton0-7ccdd556bc-62qrr -n app

.
.
.
.

I0117 17:07:16.983936 30 server.cc:674]
+--------------------------------------------------------------+---------+--------+
| Model                                                        | Version | Status |
+--------------------------------------------------------------+---------+--------+
| fastpitch_hifigan_ensemble-English-US                        | 1       | READY  |
| parakeet-1.1b-en-US-asr-streaming-asr-bls-ensemble           | 1       | READY  |
| riva-onnx-fastpitch_encoder-English-US                       | 1       | READY  |
| riva-onnx-hifigan-English-US                                 | 1       | READY  |
| riva-onnx-parakeet-1.1b-en-US-asr-streaming-am-streaming     | 1       | READY  |
| riva-onnx-parakeet-1.1b-en-US-asr-streaming-vad-nn-streaming | 1       | READY  |
| spectrogram_chunker-English-US                               | 1       | READY  |
| tts_postprocessor-English-US                                 | 1       | READY  |
| tts_preprocessor-English-US                                  | 1       | READY  |
+--------------------------------------------------------------+---------+--------+
When the correct conversion took place, triton pod logs would look like below:
I0114 22:01:19.422007 30 server.cc:674]
+-------------------------------------------------------------+---------+--------+
| Model                                                       | Version | Status |
+-------------------------------------------------------------+---------+--------+
| fastpitch_hifigan_ensemble-English-US                       | 1       | READY  |
| parakeet-1.1b-en-US-asr-streaming-asr-bls-ensemble          | 1       | READY  |
| riva-onnx-fastpitch_encoder-English-US                      | 1       | READY  |
| riva-trt-hifigan-English-US                                 | 1       | READY  |
| riva-trt-parakeet-1.1b-en-US-asr-streaming-am-streaming     | 1       | READY  |
| riva-trt-parakeet-1.1b-en-US-asr-streaming-vad-nn-streaming | 1       | READY  |
| spectrogram_chunker-English-US                              | 1       | READY  |
| tts_postprocessor-English-US                                | 1       | READY  |
| tts_preprocessor-English-US                                 | 1       | READY  |
+-------------------------------------------------------------+---------+--------+
To fix this, un-install the entire setup and re-install.
Microsoft Azure#
Old UI cache from CDN#
At times, re-installation of UI with config changes or reinstallation of new UI on existing UI, does not reflect when browsed through UI endpoint. This happens because Azure CDN caches UI content, causing old UI content still visible on browsing. If you want to forcefully clear the cache of Azure CDN, you need to invalidate the cache of Azure CDN using below commands.
source my-env-file.env

az cdn endpoint purge --resource-group '<replace-with-actual-rg-name>' --profile-name '<replace-with-cdn-profile-name>' --name '<replace-with-actual-cdn-endpoint-hostname>' --content-paths '/*'
Once the above command runs successfully, you can try accessing the UI endpoint and it should reflect the latest UI changes.