

Benchmarks
BioNeMo Inference Runtime (BioIR) measured against two OSS PyTorch baselines on every GPU it is tested on. These are the numbers a run of the published procedure should reproduce; they are not peak performance, and no attempt was made to tune any configuration per GPU.
Both baselines are reported for every measurement, and the pair is the point. Against OSS PyTorch eager, BioIR leads on every datacentre GPU and model here — 2.4x at worst. On GB10 it leads overall on every model, 1.14x at worst, but Protenix there falls to parity above 512 residues (0.98x and 0.99x). Against OSS torch.compile the answer depends on the architecture: 2.3-6.3x on Ampere, Hopper and Ada, 2.3-5.2x on Blackwell, and 1.4-2.4x on GB10. Either baseline quoted alone overstates the result in one direction or understates it in the other, so figures below 1.00x are printed rather than dropped.
torch.compile is ahead on one individual measurement: the largest OpenFold2
multimer input, 1734 residues on GB10, at 0.94x. On Boltz-2, OpenFold3 and
OpenFold2 multimer the margin narrows with length on GB10, and on Boltz-2 and
OpenFold3 on Blackwell too, so long inputs there are the case to check before
quoting a single figure.
GB10 is a desktop part and reads like one: 128 GB of LPDDR5x at 273 GB/s shared between CPU and GPU, an order of magnitude under HBM. It runs the same spec 13-26x slower than an H100, and BioIR’s lead over both baselines is narrowest there. It is reported because it is a supported target, not as a comparison against the datacentre parts above it.
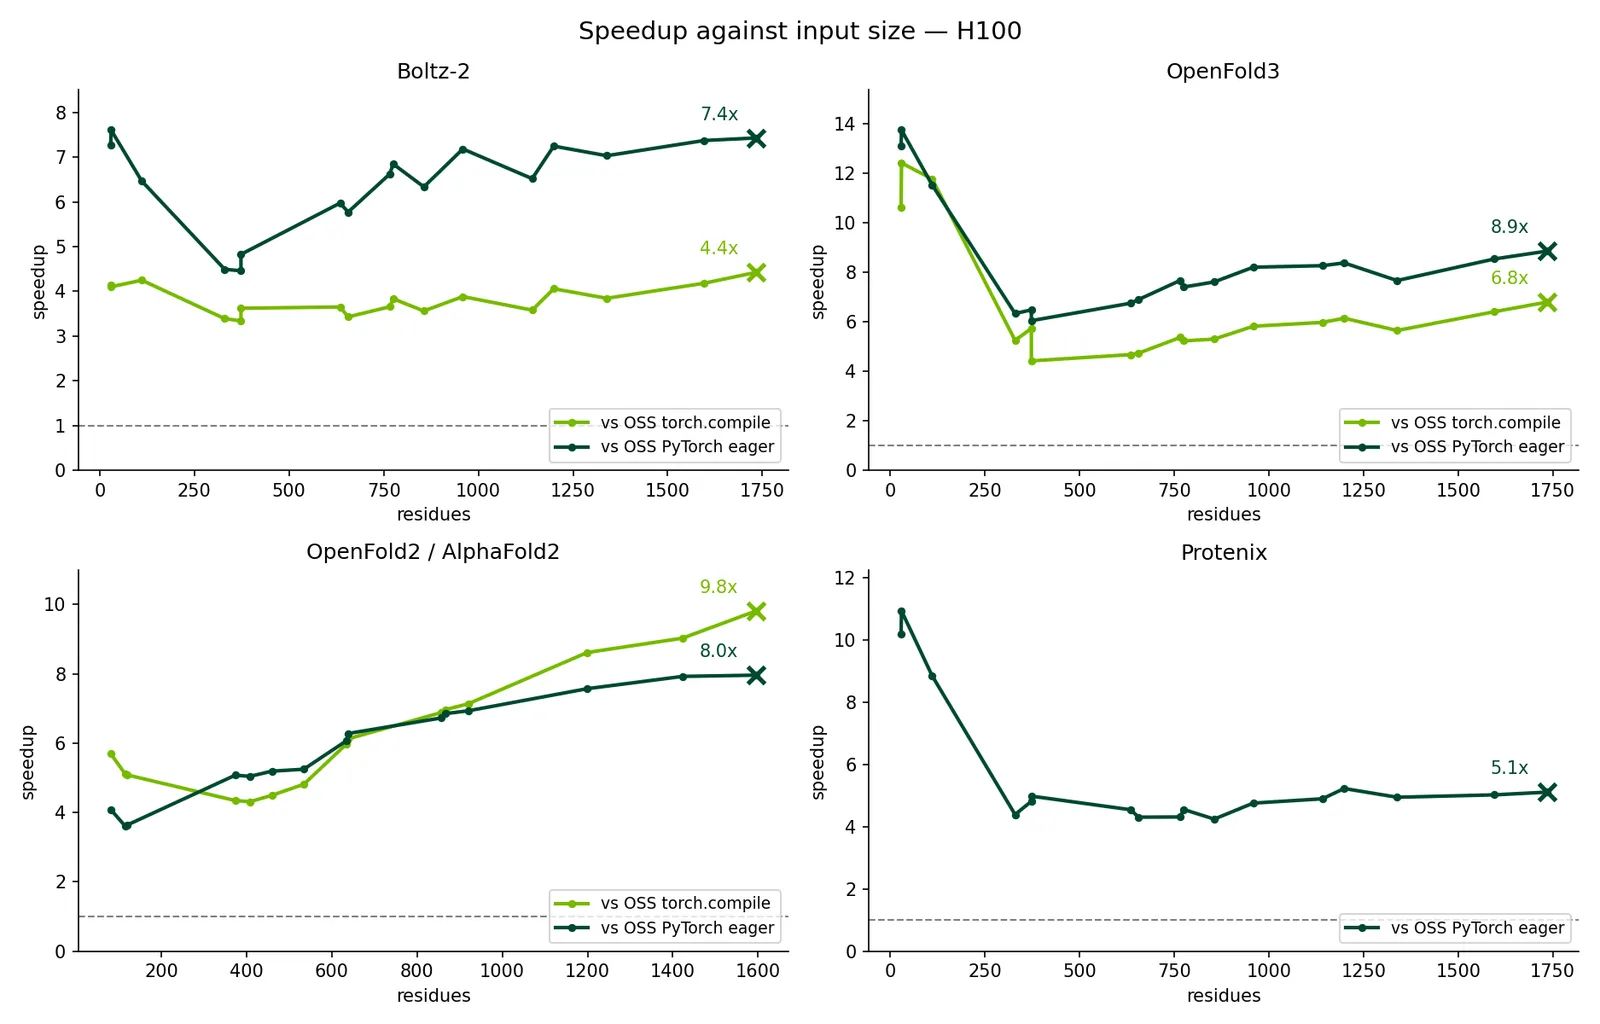
Per-sample speedup against input size, all four models on H100. The dashed line is parity; crosses mark the largest input measured. The curves are far from flat — high on the smallest inputs, where launch and dispatch overhead dominates and BioIR has less of it, lowest in the few-hundred-residue range, then climbing with length as the fused kernels start to matter. That shape is why every table below is broken out by residue count, and why an overall geomean alone is not enough to quote.
Contents
Measurements
Hardware
One GPU per measurement, one process, no replicas. Absolute latencies move with clocks, power limit and thermal headroom; the ratios are what should be comparable. Below 256 residues, host-side launch and dispatch dominate OSS latency, so OSS results there, and the speedups against them, also vary with CPU speed.
What Is Compared
Three backends fold the same inputs on the same GPU in the same container:
The OSS side runs its own inference script: eager always, and torch.compile
additionally when it passes a dynamic-shape probe. Protenix has no compile path,
which is why its compile column is empty.
Units
Speedup is OSS forward / BioIR forward per sample; above 1 favours BioIR.
Every figure is a geometric mean of per-sample speedups, not a ratio of
totals, so each sample counts equally regardless of how long it runs. n is the
sample count and differs by model.
Speedups are broken out by input size in residues because the spread is wide — Boltz-2 on GB200 is 3.72x below 512 residues and 1.82x above 1024 against OSS torch.compile. The overall geomean alone hides a factor of two.
Peak memory is torch.cuda.max_memory_allocated over the run. Accuracy is
OpenStructure lDDT over every sample and DockQ over the subset with a supported
protein interface.
Boltz-2
Bucket cells are OSS torch.compile / OSS PyTorch eager. Below 1.00x means the
baseline was faster.
Forward Latency
Geomean of the per-sample forward time, over the samples the ratios above are taken over. Quote these when comparing two releases: a ratio that moved does not say which side did.
Peak Allocated Memory
Below 1.00x means BioIR allocates less than the baseline; above 1.00x means it allocates more.
Accuracy
Each cell is BioIR / OSS torch.compile / OSS PyTorch eager. lDDT is scored
over every sample; DockQ covers the subset with a supported protein interface,
which is why its count is lower. The three should agree — a speedup that moved
them would not be the same answer.
OpenFold3
Bucket cells are OSS torch.compile / OSS PyTorch eager. Below 1.00x means the
baseline was faster.
Forward Latency
Geomean of the per-sample forward time, over the samples the ratios above are taken over. Quote these when comparing two releases: a ratio that moved does not say which side did.
Peak Allocated Memory
Below 1.00x means BioIR allocates less than the baseline; above 1.00x means it allocates more.
Accuracy
Each cell is BioIR / OSS torch.compile / OSS PyTorch eager. lDDT is scored
over every sample; DockQ covers the subset with a supported protein interface,
which is why its count is lower. The three should agree — a speedup that moved
them would not be the same answer.
OpenFold2 / AlphaFold2
Monomer
Bucket cells are OSS torch.compile / OSS PyTorch eager. Below 1.00x means the
baseline was faster.
Forward Latency
Geomean of the per-sample forward time, over the samples the ratios above are taken over. Quote these when comparing two releases: a ratio that moved does not say which side did.
Peak Allocated Memory
Below 1.00x means BioIR allocates less than the baseline; above 1.00x means it allocates more.
Accuracy
Each cell is BioIR / OSS torch.compile / OSS PyTorch eager. lDDT is scored
over every sample; DockQ covers the subset with a supported protein interface,
which is why its count is lower. The three should agree — a speedup that moved
them would not be the same answer.
Multimer
Bucket cells are OSS torch.compile / OSS PyTorch eager. Below 1.00x means the
baseline was faster.
Forward Latency
Geomean of the per-sample forward time, over the samples the ratios above are taken over. Quote these when comparing two releases: a ratio that moved does not say which side did.
Peak Allocated Memory
Below 1.00x means BioIR allocates less than the baseline; above 1.00x means it allocates more.
Accuracy
Each cell is BioIR / OSS torch.compile / OSS PyTorch eager. lDDT is scored
over every sample; DockQ covers the subset with a supported protein interface,
which is why its count is lower. The three should agree — a speedup that moved
them would not be the same answer.
Protenix
Bucket cells are OSS torch.compile / OSS PyTorch eager. Below 1.00x means the
baseline was faster.
Forward Latency
Geomean of the per-sample forward time, over the samples the ratios above are taken over. Quote these when comparing two releases: a ratio that moved does not say which side did.
Peak Allocated Memory
Below 1.00x means BioIR allocates less than the baseline; above 1.00x means it allocates more.
Accuracy
Each cell is BioIR / OSS torch.compile / OSS PyTorch eager. lDDT is scored
over every sample; DockQ covers the subset with a supported protein interface,
which is why its count is lower. The three should agree — a speedup that moved
them would not be the same answer.
RFProteína
RFProteína is a design model rather than a folding model, so it runs on its own
harness and these figures are not comparable with the tables above. The unit is
milliseconds per sampling step on one h100, batch 1, 50 sampling steps, a
mid-peak recycling schedule for 170 trunk passes, and self-conditioning
disabled, across thirty sequence lengths from 64 to 1024 residues.
Each side is configured as it would be deployed rather than forced into a common
mould: the OSS implementation uses static torch.compile and pads every input
up to a released compile anchor, while BioIR runs the native length unpadded,
with exact-shape CUDA graphs through 512 residues and eager execution above.
Compilation, capture and warmup are outside the timed region.
BioIR is faster at all thirty shapes, with a median speedup of 2.03x over a range of 1.28x to 3.35x.
Fourteen of the thirty measured shapes carry the pattern; six representative
rows are shown. Read the extremes with care. The largest speedups sit
immediately after an OSS compile anchor — 769 residues padded to 896 gives
3.35x — where much of the gain is padding waste on the OSS side rather than
BioIR being faster. Each row is a single timed rollout after warmup rather than
a median of repeats, so individual rows carry run-to-run noise. The sweep also
predates the removal of a short-sequence triangle-multiplication path, so rows
below 384 residues understate current BioIR performance, and it predates the
upstream thinking-mode schedules, so its fixed 50-step, 170-pass budget is not
what a default run executes today: the default is thinking_medium, 60 steps
over 185 trunk passes. Latency per sampling step stays the comparable unit;
total design time scales with the mode’s trunk-pass count.
Peak allocated memory is lower for BioIR at long lengths, 10.74 against 15.56 GiB at 1024 residues, while peak reserved memory is higher, 38.69 against 33.62 GiB. That reflects caching-allocator behaviour under graph capture rather than live tensor footprint, so deployments sized on reserved memory should note the difference.
Design quality is reported separately in RFProteína architecture, because the comparison is distributional rather than a per-sample score.
Reproducing
These numbers are not tied to a build artifact: they come from main, on one
GPU, with public inputs and upstream baselines at pinned tags. The procedure is
the bench-perf-oss agent skill
— point an agent at it rather than following steps by hand. It installs BioIR
and each pinned baseline in isolation, runs one warmup and one timed forward per
sample, scores the output, and aggregates the geomeans above.
Have these ready first; the skill cannot supply them:
- One NVIDIA GPU on driver 580 or newer. The container ships a CUDA 13.2
build of PyTorch. On a 535 driver it runs only through the
forward-compatibility shim, and measuring on that path produced silent hangs
and
SIGFPEcrashes part-way through a sweep — wrong numbers, not merely slow ones. Check the ECC counters are zero while you are there. NGC_API_KEYexported, for the MSA Search NIM.rebuild_dataset.pybuilds thedataset-0.3.0inputs from RCSB and that endpoint rather than downloading a release; the structures need no credential at all (--structures-only). Free key at build.nvidia.com. Every structure is checked against the coordinates that were measured. When RCSB has since revised an entry’s coordinates (7PV5 in September 2026), the script takes the measured version from the wwPDB versioned archive instead.HF_TOKENexported. OpenFold3’s checkpoint is gated and an anonymous fetch returns401. Registering is free. Checkpoint staging generally is Model Weights.- A built extension, per Development Workflow.
When a ratio does not match, suspect the baseline environment before the code.
The most common cause by far is an upstream package resolved against a different
torch than BioIR’s, at which point the ratio compares two PyTorch builds
rather than two implementations.
Container nvcr.io/nvidia/pytorch:26.05-py3 · driver 580.105.08–610.57.04 ·
measured 2026-10-14