Feature Overview#
The following sections review key DCGM features, along with examples of input and output
using the dcgmi CLI. Common usage scenarios and suggested best practices are included as well.
Starting with v1.3, DCGM is supported on non-Tesla branded GPUs. The following table lists the features
available on different GPU products.
Feature Group |
Tesla |
Titan |
Quadro |
GeForce |
|---|---|---|---|---|
Field Value Watches (GPU metrics) |
X |
X |
X |
X |
Configuration Management |
X |
X |
X |
X |
Active Health Checks (GPU subsystems) |
X |
X |
X |
X |
Job Statistics |
X |
X |
X |
X |
Topology |
X |
X |
X |
X |
Introspection |
X |
X |
X |
X |
Policy Notification |
X |
|||
GPU Diagnostics (Diagnostic Levels - 1, 2, 3) |
All Levels |
Level 1 |
Level 1 |
Level 1 |
Note
While DCGM interfaces are shown, all functionality below is accessible via the C, Python and Go APIs as well.
Groups#
Almost all DCGM operations take place on groups. Users can create, destroy and modify collections of GPUs on the local node, using these constructs to control all subsequent DCGM activities.
Groups are intended to help the user manage collections of GPUs as a single abstract resource, usually correlated to the scheduler’s notion of a node-level job. By working in this way clients can ask question about the entire job, such as job-level health, without needing to track the individual resources.
Note
Today DCGM does not enforce group behavior beyond itself, e.g. through OS isolation mechanisms like cgroups. It is expected that clients do this externally. The ability for clients to opt-in to DCGM enforcement of this state is likely in the future.
In machines with only one GPU the group concept can be ignored altogether, as all DCGM operations that require a group can use one containing that sole GPU. For convenience, at init, DCGM creates a default group representing all supported GPUs in the system. Groups in DCGM need not be disjoint. In many cases it may make sense to maintain overlapping groups for different needs. Global groups, consisting of all GPUs in the system, are useful for node-level concepts such as global configuration or global health. Partitioned groups, consisting of only a subset of GPUs, are useful for job-level concepts such as job stats and health.
As of DCGM 4, a total of 64 groups, including the 2 system groups, can be supported. Each group can support up to 1024 entities.
Tip
It is recommended that the client maintain one long-lived global group for node-level activities. For systems with multiple transient concurrent workloads it is recommended that additional partitioned groups be maintained on a per-job basis.
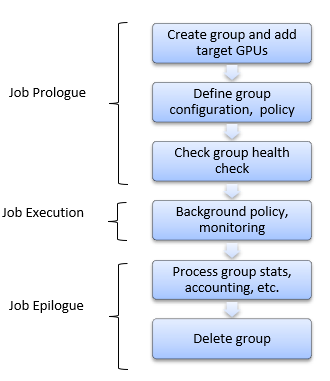
For example, a group created to manage the GPUs associated with a single job might have the following lifecycle. During prologue operations the group is created, configured, and used to verify the GPUs are ready for work. During epilogue operations the groups is used to extract target information. And while the job is running, DCGM works in the background to handle the requested behaviors.
Managing groups is very simple. Using the dcgmi group subcommand, the following example shows how to create, list and delete a group.
$ dcgmi group -c GPU_Group
Successfully created group "GPU_Group" with a group ID of 1
$ dcgmi group -l
1 group found.
+----------------------------------------------------------------------------+
| GROUPS                                                                     |
+============+===============================================================+
| Group ID   | 1                                                             |
| Group Name | GPU_Group                                                     |
| GPU ID(s)  | None                                                          |
+------------+---------------------------------------------------------------+
$ dcgmi group -d 1
Successfully removed group 1
To add GPUs to a group it is first necessary to identify them. This can be done by first asking DCGM for all supported GPUs in the system.
By default, dcgmi discovery -l shows only active GPUs. If there are inactive GPUs (e.g., detached),
a note is displayed:
$ dcgmi discovery -l
2 GPUs found (Active).
Note: Use -a flag to show all GPUs, including those that are not active.
+--------+-------------------------------------------------------------------+
| GPU ID | Device Information                                                |
+========+===================================================================+
| 0      | Name: Tesla K80                                                   |
|        | PCI Bus ID: 0000:07:00.0                                          |
|        | Device UUID: GPU-000000000000000000000000000000000000             |
+--------+-------------------------------------------------------------------+
| 2      | Name: Tesla K80                                                   |
|        | PCI Bus ID: 0000:09:00.0                                          |
|        | Device UUID: GPU-222222222222222222222222222222222222             |
+--------+-------------------------------------------------------------------+
To display all GPUs including inactive ones (e.g., detached, lost, or inaccessible), use the -a or --all flag:
$ dcgmi discovery -l -a
3 GPUs found (All).
+--------+-------------------------------------------------------------------+
| GPU ID | Device Information                                                |
+========+===================================================================+
| 0      | Name: Tesla K80                                                   |
|        | PCI Bus ID: 0000:07:00.0                                          |
|        | Device UUID: GPU-000000000000000000000000000000000000             |
+--------+-------------------------------------------------------------------+
| 1      | Status: DETACHED                                                  |
|        | Name: Tesla K80 (last known)                                      |
|        | PCI Bus ID: 0000:08:00.0 (last known)                             |
|        | Device UUID: GPU-111111111111111111111111111111111111             |
+--------+-------------------------------------------------------------------+
| 2      | Name: Tesla K80                                                   |
|        | PCI Bus ID: 0000:09:00.0                                          |
|        | Device UUID: GPU-222222222222222222222222222222222222             |
+--------+-------------------------------------------------------------------+
When the -a flag is used, inactive GPUs display their status (e.g., DETACHED, LOST, INACCESSIBLE)
and cached attribute values are marked with (last known).
$ dcgmi group -g 1 -a 0,1
Add to group operation successful.
$ dcgmi group -g 1 -i
+----------------------------------------------------------------------------+
| GROUPS                                                                     |
+============+===============================================================+
| Group ID   | 1                                                             |
| Group Name | GPU_Group                                                     |
| GPU ID(s)  | 0, 1                                                          |
+------------+---------------------------------------------------------------+
When adding or removing entities from a group, bare numbers are interpreted as GPU IDs, so 0,1
is equivalent to gpu:0,gpu:1. Entity prefixes can be mixed when managing groups that contain
more than one entity type:
$ dcgmi group -g 1 -a gpu:0,instance:1,cpu:3
For command-specific entity syntax, see the --help output for the relevant dcgmi subcommand.
Configuration#
An important aspect of managing GPUs, especially in multi-node environments, is ensuring consistent configuration across workloads and across devices. In this context the term configuration` refers to the set of administrative parameters exposed by NVIDIA to tune GPU behavior. DCGM makes it easier for clients to define target configurations and ensure those configurations are maintained over time.
It is important to note that different GPU properties have different levels of persistence. There are two broad categories:
Device InfoROM lifetime
Non-volatile memory on each board, holding certain configurable firmware settings.
Persists indefinitely, though firmware can be flashed.
GPU initialization lifetime
Driver level data structures, holding volatile GPU runtime information.
Persists until the GPU is de-initialized by the kernel mode driver.
DCGM is primarily focused on maintaining configuration settings that fall into the second category. These settings are normally volatile, potentially resetting each time a GPU becomes idle or is reset. By using DCGM a client can ensure that these settings persist over the desired lifetime.
In most common situations the client should be expected to define a configuration for all GPUs in the system (global group) at system initialization, or define individual partitioned group settings on a per-job basis. Once a configuration has been defined DCGM will enforce that configuration, for example across driver restarts, GPU resets or at job start.
DCGM currently supports the follows configuration settings:
Setting |
Description |
Defaults |
|---|---|---|
Sync Boost |
Coordinate Auto Boost across GPUs in the group |
None |
Target Clocks |
Attempt to maintain fixed clocks at the target values |
None |
ECC Mode |
Enable ECC protection throughout the GPU’s memory |
Usually On |
Power Limit |
Set the maximum allowed power consumption |
Varies |
Compute Mode |
Limit concurrent process access to the GPU |
No restrictions |
Workload Power Profiles |
Enable and disable workload power profiles |
None |
To define a target configuration for a group, use the dcgmi config subcommand. Using the group created in the section above, the following example shows how to set a compute mode target and then list the current configuration state.
$ dcgmi config -g 1 --set -c 2
Configuration successfully set.
$ dcgmi config -g 1 --get
+--------------------------+------------------------+------------------------+
| GPU_Group                |                        |                        |
| Group of 2 GPUs          | TARGET CONFIGURATION   | CURRENT CONFIGURATION  |
+==========================+========================+========================+
| Sync Boost               | Not Specified          | Disabled               |
| SM Application Clock     | Not Specified          | ****                   |
| Memory Application Clock | Not Specified          | ****                   |
| ECC Mode                 | Not Specified          | ****                   |
| Power Limit              | Not Specified          | ****                   |
| Compute Mode             | E. Process             | E. Process             |
| Power Profile            | Not Specified          | Not Specified          |
+--------------------------+------------------------+------------------------+
**** Non-homogenous settings across group. Use with -v flag to see details.
$ dcgmi config -g 1 --get --verbose
+--------------------------+------------------------+------------------------+
| GPU ID: 0                |                        |                        |
| Tesla K20c               | TARGET CONFIGURATION   | CURRENT CONFIGURATION  |
+==========================+========================+========================+
| Sync Boost               | Not Specified          | Disabled               |
| SM Application Clock     | Not Specified          | 705                    |
| Memory Application Clock | Not Specified          | 2600                   |
| ECC Mode                 | Not Specified          | Disabled               |
| Power Limit              | Not Specified          | 225                    |
| Compute Mode             | E. Process             | E. Process             |
| Power Profile            | Not Specified          | Not Specified          |
+--------------------------+------------------------+------------------------+
+--------------------------+------------------------+------------------------+
| GPU ID: 1                |                        |                        |
| GeForce GT 430           | TARGET CONFIGURATION   | CURRENT CONFIGURATION  |
+==========================+========================+========================+
| Sync Boost               | Not Specified          | Disabled               |
| SM Application Clock     | Not Specified          | 562                    |
| Memory Application Clock | Not Specified          | 2505                   |
| ECC Mode                 | Not Specified          | Enabled                |
| Power Limit              | Not Specified          | 200                    |
| Compute Mode             | E. Process             | E. Process             |
| Power Profile            | Not Specified          | Not Specified          |
+--------------------------+------------------------+------------------------+
Once a configuration is set, DCGM maintains the notion of Target and Current state. Target tracks the user’s request for configuration state while Current tracks the actual state of the GPU and group. These are generally maintained such that they are equivalent with DCGM restoring current state to target in situations where that state is lost or changed. This is common in situations where DCGM has executed some invasive policy like a health check or GPU reset.
Workload Power Profile Configuration#
The dcgmi config command provides functionality to configure and query workload power profiles for NVIDIA GPUs.
Workload power profiles allow you to optimize GPU power consumption based on specific workload characteristics.
The supported workload power profiles are specific to the GPU architecture. Use nvidia-smi power-profiles -l to
see the names and indexes of the supported profiles for the current GPU. The index values used in DCGM are the same
as NVML.
Getting Workload Power Profile Configuration#
The dcgmi config --get command retrieves both the current and target configuration for workload power profile settings.
Get configuration for all GPUs:
$ dcgmi config --get
Get configuration for specific GPU group with verbose output:
$ dcgmi config --get -g 1 -v
Setting Workload Power Profile Configuration#
The dcgmi config --set -o command controls the workload power profile settings for GPUs.
$ dcgmi config --set -o <profile_index> -w <action> [OPTIONS]
Required Options for Workload Power Profiles:
- -o <profile index>, --workloadpowerprofile=<profile index>#
- Description:
Device-specific profile index.
- Values:
Integer (0-n) or -1 to clear all.
- -w <action>, --workloadpowerprofileaction=<action>#
- Description:
Action to perform on profile.
- Values:
a(add/set)- Description:
Adds the specified profile to the existing profile mask
- Use Case:
Enabling additional profiles while preserving existing ones
- Behavior:
Sets the bit corresponding to the profile index in the profile mask
c(clear)- Description:
Clears the specified profile from the profile mask
- Use Case:
Disabling specific profiles
- Behavior:
Clears the bit corresponding to the profile index
o(overwrite)- Description:
Overwrites the entire profile mask with only the specified profile
- Use Case:
Setting a single profile and clearing all others
- Behavior:
Replaces the entire profile mask with only the specified profile bit set
Special Index Value#
Index -1: Clears all workload power profiles regardless of the action specified
When using
-o -1, all profiles are clearedThe action parameter (
-w) is ignored when index is -1
Workload Power Profile Examples#
Set a specific workload power profile (add to existing)#
$ dcgmi config --set -o 2 -w a
Sets profile index 2, adding it to any existing profiles.
Clear a specific workload power profile#
$ dcgmi config --set -o 2 -w c
Clears profile index 2 from the profile mask.
Overwrite with a specific profile#
$ dcgmi config --set -o 3 -w o
Sets profile index 3 and clears all other profiles.
Clear all workload power profiles#
$ dcgmi config --set -o -1
Clears all workload power profiles. The -w action is not required when using -1.
Set profile for specific GPU group#
$ dcgmi config --set -o 2 -w a -g 5
Sets profile index 2 for GPU group 5.
Verification Workflow#
Check current configuration:
$ dcgmi config --get -v
Set desired workload power profile:
$ dcgmi config --set -o 3 -w o
Verify the change:
$ dcgmi config --get -v
Querying Supported Workload Power Profiles#
To see which workload power profiles are supported on your GPUs, use:
$ dcgmi discovery -i w
$ nvidia-smi power-profiles -l
This displays:
Supported Profiles: Profiles available on the GPU hardware
Requested Profiles: Profiles currently requested via configuration
Enforced Profiles: Profiles actually enforced by the driver
Persistence#
Workload power profile settings are applied immediately
Settings may not persist across system reboots depending on GPU and driver configuration
Use DCGM policies to maintain persistent configurations
Troubleshooting#
If a profile shows in “Requested” but not “Enforced”:
The driver may not support the profile on this GPU architecture
Another power management policy may be taking precedence
GPU may be in a state that prevents profile changes
If you cannot clear profiles, use the special index -1 to clear all profiles:
$ dcgmi config --set -o -1
For programmatic access, see the following DCGM API functions:
dcgmConfigSetWorkloadPowerProfile()dcgmGetDeviceWorkloadPowerProfileInfo()dcgmConfigGet()
Refer to the DCGM API documentation for detailed function signatures and usage.
Policy#
DCGM provides a way for clients to configure automatic GPU behaviors in response to various conditions. This is useful for event->action situations, such as GPU recovery in the face of serious errors. It’s also useful for event->notification situations, such as when a client wants to be warned if a RAS event occurs. In both scenarios the client must define a condition on which to trigger further behavior. These conditions are specified from a predefined set of possible metrics. In some cases the client must also provide a threshold above/below which the metric condition is triggered. Generally, conditions are fatal and non-fatal RAS events, or performance-oriented warnings. These include the following examples:
Condition |
Type |
Threshold |
Description |
|---|---|---|---|
PCIe/NVLINK Errors |
Fatal |
Hardcoded |
Uncorrected, or corrected above SDC threshold |
ECC Errors |
Fatal |
Hardcoded |
Single DBE, multiple co-located SBEs |
Page Retirement Limit |
Non-Fatal |
Settable |
Lifetime limit for ECC errors, or above RMA rate |
Power Excursions |
Performance |
Settable |
Excursions above specified board power threshold |
Thermal Excursions |
Performance |
Settable |
Excursions above specified GPU thermal threshold |
XIDs |
All |
Hardcoded |
XIDs represent several kinds of events within the NVIDIA driver such as pending page retirements or GPUs falling off the bus. See https://docs.nvidia.com/deploy/xid-errors/index.html for details. |
Notifications#
The simplest form of a policy is to instruct DCGM to notify a client when the target condition is met. No further action is performed beyond this. This is primarily interesting as a callback mechanism within the programmatic interfaces, as a way to avoid polling.
When running DCGM in embedded mode such callbacks are invoked automatically by DCGM each time a registered condition is hit, at which point the client can deal with that event as desired. The client must register through the appropriate API calls to receive these callbacks. Doing so transparently instructs DCGM to track the conditions that trigger those results.
Note
Once a callback has been received for a particular condition, that notification registration is terminated. If the client wants repeated notifications for a condition it should re-register after processing each callback.
The dcgmi policy subcommand does allow access to some of this functionality from the command line via setting of
conditions and via a blocking notification mechanism. This can be useful when watching for a particular problem,
e.g. during a debugging session.
As an example, the following shows setting a notification policy for PCIe fatal and non-fatal events:
$ dcgmi policy -g 2 --set 0,0 -p
Policy successfully set.
$ dcgmi policy -g 2 --get
Policy information
+---------------------------+------------------------------------------------+
| GPU_Group                 | Policy Information                             |
+===========================+================================================+
| Violation conditions      | PCI errors and replays                         |
| Isolation mode            | Manual                                         |
| Action on violation       | None                                           |
| Validation after action   | None                                           |
| Validation failure action | None                                           |
+---------------------------+------------------------------------------------+
**** Non-homogenous settings across group. Use with -v flag to see details.
$ dcgmi policy -g 2 --get --verbose
Policy information
+---------------------------+------------------------------------------------+
| GPU ID: 0                 | Policy Information                             |
+===========================+================================================+
| Violation conditions      | PCI errors and replays                         |
| Isolation mode            | Manual                                         |
| Action on violation       | None                                           |
| Validation after action   | None                                           |
| Validation failure action | None                                           |
+---------------------------+------------------------------------------------+
+---------------------------+------------------------------------------------+
| GPU ID: 1                 | Policy Information                             |
+===========================+================================================+
| Violation conditions      | PCI errors and replays                         |
| Isolation mode            | Manual                                         |
| Action on violation       | None                                           |
| Validation after action   | None                                           |
| Validation failure action | None                                           |
+---------------------------+-----------------------------------------------
Once such a policy is set the client will receive notifications accordingly. While this is primarily
interesting for programmatic use cases, dcgmi policy can be invoked to wait for policy notifications:
$ dcgmi policy -g 2 --reg
Listening for violations
...
A PCIe error has violated policy manager values.
...
Actions#
Action policies are a superset of the notification policies above.
Some clients may find it useful to tie a condition to an action that DCGM performs automatically as soon as the condition is met. This is most pertinent when the condition is a RAS event that prevents the GPU from otherwise operating normally.
Policies that are defined as actions include three additional components:
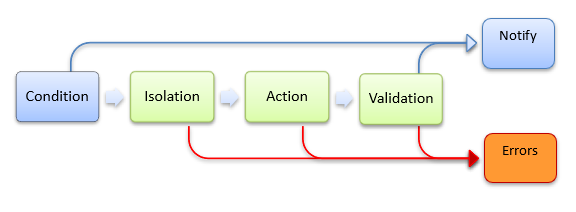
Isolation mode - whether DCGM grabs exclusive access to the GPU before performing the subsequent policy steps.
Action - The DCGM invasive behavior to perform.
Validation - Any follow-up validation of GPU state, post action.
A common action based policy is to configure DCGM to automatically retire a memory page after an ECC DBE has occurred. By retiring the page and re-initializing the GPU, DCGM can isolate the hardware fault and prepare the GPU for the next job. Since this operation involves resetting the GPU, a quick system validation is a follow-up step to ensure the GPU is healthy.
Clients setting action policies receive two notifications each time the policy is run.
Notification callback when condition is hit and policy enacted.
Notification callback when action completes, i.e. after validation step.
Using the dcgmi policy subcommand, this kind of action-based policy can be configured as follows:
$ dcgmi policy -g 1 --set 1,1 -e
Policy successfully set.
$ dcgmi policy -g 1 --get
Policy information for group 1
+----------------------------------------------------------------------------+
| GPU ID: 0                 | Policy Information                             |
+===========================+================================================+
| Violation Conditions      | Double-bit ECC errors                          |
| Isolation mode            | Manual                                         |
| Action on violation       | Reset GPU                                      |
| Validation after action   | NVVS (Short)                                   |
| Validation failure action | None                                           |
+---------------------------+------------------------------------------------+
...
As shown in the previous section, dcgmi policy can also be used to watch for notifications associated with this policy.
Job Statistics#
DCGM provides background data gathering and analysis capabilities, including the ability to aggregate data across the lifetime of a target workload and across the GPUs involved. This makes it easy for clients to gather job level data, such as accounting, in a single request.
To request this functionality a client must first enable stats recording for the target group. This tells DCGM that all relevant metrics must be periodically watched for those GPUs, along with process activity on the devices. This need only be done once at initialization for each job-level group.
$ dcgmi stats -g 1 --enable
Successfully started process watches on group 1.
Stats recording must be enabled prior to the start of the target workload(s) for reliable information to be available.
Once a job has completed DCGM can be queried for information about that job, both at the summary level of a group and, if needed, broken down individually between the GPUs within that group. The suggested behavior is that clients perform this query in epilogue scripts as part of job cleanup.
An example of group-level data provided by dcgmi stats. Note: the -v flag, which adds fields that offer additional detail, is required to get all of the details seen in the output below.
$ dcgmi stats --pid 1234 -v
Successfully retrieved process info for pid: 1234. Process ran on 1 GPUs.
+----------------------------------------------------------------------------+
| GPU ID: 0                                                                  |
+==================================+=========================================+
|------- Execution Stats ----------+-----------------------------------------|
| Start Time *                     | Tue Nov 3 17:36:43 2015                 |
| End Time *                       | Tue Nov 3 17:38:33 2015                 |
| Total Execution Time (sec) *     | 110.33                                  |
| No. of Conflicting Processes *   | 0                                       |
+------- Performance Stats --------+-----------------------------------------+
| Energy Consumed (Joules)         | 15758                                   |
| Power Usage (Watts)              | Avg: 150, Max: 250, Min: 100            |
| Max GPU Memory Used (bytes) *    | 213254144                               |
| SM Clock (MHz)                   | Avg: 837, Max: 875, Min: 679            |
| Memory Clock (MHz)               | Avg: 2505, Max: 2505, Min: 2505         |
| SM Utilization (%)               | Avg: 99, Max: 100, Min: 99              |
| Memory Utilization (%)           | Avg: 2, Max: 3, Min: 0                  |
| PCIe Rx Bandwidth (megabytes)    | Avg: N/A, Max: N/A, Min: N/A            |
| PCIe Tx Bandwidth (megabytes)    | Avg: N/A, Max: N/A, Min: N/A            |
+------- Event Stats --------------+-----------------------------------------+
| Single Bit ECC Errors            | 0                                       |
| Double Bit ECC Errors            | 0                                       |
| PCIe Replay Warnings             | 0                                       |
| Critical XID Errors              | 0                                       |
+------- Slowdown Stats -----------+-----------------------------------------+
| Due to - Power (%)               | 0                                       |
| - Thermal (%)                    | 0                                       |
| - Reliability (%)                | 0                                       |
| - Board Limit (%)                | 0                                       |
| - Low Utilization (%)            | 0                                       |
| - Sync Boost (%)                 | Not Supported                           |
+----------------------------------+-----------------------------------------+
(*) Represents a process statistic. Otherwise device statistic during process lifetime listed.
For certain frameworks the processes and their PIDs cannot be associated with a job directly, and the process associated with a job may spawn many children. In order to get job-level stats for such a scenario, DCGM must be notified when a job starts and stops. It is required that the client notifies DCGM with the user defined job id and the corresponding GPU group at job prologue, and notifies with the job id at the job epilogue. The user can query the job stats using the job id and get aggregated stats across all the pids during the window of interest.
An example of notifying DCGM at the beginning and end of the job using dcgmi:
$ dcgmi stats -g 1 -s <user-provided-jobid>
Successfully started recording stats for <user-provided-jobid>
$ dcgmi stats -x <user-provided-jobid>
Successfully stopped recording stats for <user-provided-jobid>
The stats corresponding to the job id already watched can be retrieved using dcgmi. Note: the -v flag is required to get all of the details seen in the output below.
$ dcgmi stats -j <user-provided-jobid> -v
For dcgmi stats, -j is the short option for --job. It does not request JSON output.
Successfully retrieved statistics for <user-provided-jobid>
+----------------------------------------------------------------------------+
| GPU ID: 0                                                                  |
+==================================+=========================================+
|------- Execution Stats ----------+-----------------------------------------|
| Start Time                       | Tue Nov 3 17:36:43 2015                 |
| End Time                         | Tue Nov 3 17:38:33 2015                 |
| Total Execution Time (sec)       | 110.33                                  |
| No. of Processes                 | 0                                       |
+----- Performance Stats ----------+-----------------------------------------+
| Energy Consumed (Joules)         | 15758                                   |
| Power Usage (Watts)              | Avg: 150, Max: 250, Min 100             |
| Max GPU Memory Used (bytes)      | 213254144                               |
| SM Clock (MHz)                   | Avg: 837, Max: 875, Min: 679            |
| Memory Clock (MHz)               | Avg: 2505, Max: 2505, Min: 2505         |
| SM Utilization (%)               | Avg: 99, Max: 100, Min: 99              |
| Memory Utilization (%)           | Avg: 2, Max: 3, Min: 0                  |
| PCIe Rx Bandwidth (megabytes)    | Avg: N/A, Max: N/A, Min: N/A            |
| PCIe Tx Bandwidth (megabytes)    | Avg: N/A, Max: N/A, Min: N/A            |
+----- Event Stats ----------------+-----------------------------------------+
| Single Bit ECC Errors            | 0                                       |
| Double Bit ECC Errors            | 0                                       |
| PCIe Replay Warnings             | 0                                       |
| Critical XID Errors              | 0                                       |
+----- Slowdown Stats -------------+-----------------------------------------+
| Due to - Power (%)               | 0                                       |
| - Thermal (%)                    | 0                                       |
| - Reliability (%)                | 0                                       |
| - Board Limit (%)                | 0                                       |
| - Low Utilization (%)            | 0                                       |
| - Sync Boost (%)                 | Not Supported                           |
+----------------------------------+-----------------------------------------+
Health and Diagnostics#
DCGM provides several mechanisms for understanding GPU health, each targeted at different needs. By leveraging each of these interfaces it is easy for clients to determine overall GPU health non-invasively – while workloads are running, and actively – when the GPU(s) can run dedicated tests. A new major feature of DCGM is the ability to run online hardware diagnostics.
More detailed targeted use cases are as follows:
Background health checks.
These are non-invasive monitoring operations that occur while jobs are running, and can be queried at any time. There is no impact on application behavior or performance.
Prologue health checks.
Quick, invasive health checks that take a few seconds and are designed to verify that a GPU is ready for work prior to job submission.
Epilogue health checks.
Medium duration invasive health checks, taking a few minutes, that can be run when a job has failed or a GPU’s health is otherwise suspect
Full system validation.
Long duration invasive health checks, taking tens of minutes, that can be run when a system is being active investigated for hardware problems or other serious issues.
Warning
All of these are online diagnostics, meaning they run within the current environment. There is potential for factors beyond the GPU to influence behavior in negative ways. While these tools try to identify those situations, full offline diagnostics delivered via a different NVIDIA tool are required for complete hardware validation, and are required for RMA.
Background Health Checks#
This form of health check is based on passive, background monitoring of various hardware and software components. The objective is to identify problems in key areas without impact on application behavior or performance. These kinds of checks can catch serious problems, such as unresponsive GPUs, corrupted firmware, thermal escapes, etc.
When such issues are identified they are reported by DCGM as warnings or errors. Each situation can require different client responses, but the following guidelines are usually true:
Warning - an issue has been detected that won’t prevent current work from completing, but the issue should be examined and potentially addressed in the future.
Error - a critical issue has been detected and the current work is likely compromised or interrupted. These situations typically correspond to fatal RAS events and usually indicate the need for job termination and GPU health analysis.
Background health checks can be set and watched via simple DCGM interfaces. Using dcgmi health as the interface, the following code sets several health checks for a group and then verifies that those checks are currently enabled:
$ dcgmi health -g 1 -s mpi
Health monitor systems set successfully.
The available health watch flags are:
p- PCIe watchesm- Memory watchesi- InfoROM watchest- Thermal and power watchesn- NVLink watchesd- Driver watchesx- ConnectX watchesa- All watches
To view the current status of all GPUs in the group the client can simply query for the overall group health. The result is an overall health score for the group as well as individual results for each impacted GPU, identifying key problems.
For example, DCGM would show the following when excessive PCIe replay events or InfoROM issues are detected:
$ dcgmi health -g 1 -c
Health Monitor Report
+----------------------------------------------------------------------------+
| Group 1          | Overall Health: Warning                                 |
+==================+=========================================================+
| GPU ID: 0        | Warning                                                 |
|                  | PCIe system: Warning - Detected more than 8 PCIe        |
|                  | replays per minute for GPU 0: 13                        |
+------------------+---------------------------------------------------------+
| GPU ID: 1        | Warning                                                 |
|                  | InfoROM system: Warning - A corrupt InfoROM has been    |
|                  | detected in GPU 1.                                      |
+------------------+---------------------------------------------------------+
System |
Error Code |
Cause |
|---|---|---|
Any |
DCGM_FR_FALLEN_OFF_BUS |
A GPU has fallen off the bus. |
Any |
DCGM_FR_XID_ERROR |
One or more “devastating” XIDs associated with a critical hardware error has occurred. |
Driver |
DCGM_FR_GPU_RECOVERY_DRAIN_P2P |
A GPU requires peer-to-peer traffic to be quiesced. |
Driver |
DCGM_FR_GPU_RECOVERY_DRAIN_RESET |
A GPU is operating at reduced capacity due to a fault. |
Driver |
DCGM_FR_GPU_RECOVERY_REBOOT |
A GPU fault may have left the operating system in an inconsistent state. |
Driver |
DCGM_FR_GPU_RECOVERY_RESET |
A GPU requires a reset to recover from a fault. |
PCIe |
DCGM_FR_PCI_REPLAY_RATE |
There were more than 8 PCIe replays in the last minute. |
PCIe |
DCGM_FR_XID_ERROR |
One or more XIDs associated with bus or fabric errors were reported. |
Memory |
DCGM_FR_FAULTY_MEMORY |
Faulty memory elements were detected on a GPU. |
Memory |
DCGM_FR_VOLATILE_DBE_DETECTED |
One or more volatile DBEs are reported (non-recoverable memory errors since the last GPU reset) |
Memory |
DCGM_FR_PENDING_PAGE_RETIREMENTS |
There is one or more pending page retirement. |
Memory |
DCGM_FR_RETIRED_PAGES_LIMIT |
63 or more retired pages have occurred on one GPU. |
Memory |
DCGM_FR_RETIRED_PAGES_DBE_LIMIT |
There have been more than 15 total retired pages due to DBEs and at least one in the last week. |
Memory |
DCGM_FR_ROW_REMAP_FAILURE |
One or more row remapping failures occurred (XID 64 occurred). |
Memory |
DCGM_FR_UNCONTAINED_ERROR |
A GPU experienced an uncontained error (XID 95 occurred). |
Memory |
DCGM_FR_CONTAINED_ERROR |
A GPU reported a contained error (XID 94 occurred). |
Memory |
DCGM_FR_XID_ERROR |
One or more XIDs associated with memory management units (MMU), push buffer direct management access (PBDMA) units, or Reset Channel Verification were reported. |
Inforom |
DCGM_FR_CORRUPT_INFOROM |
Inforom corruption detected (XID 93). DCGM raises this warning only when XID 93 is observed on Volta GPUs; on all other architectures DCGM ignores XID 93 and does not raise this health warning. |
Thermal |
DCGM_FR_CLOCKS_EVENT_THERMAL |
A thermal violation was detected on a GPU in the last minute. |
Thermal |
DCGM_FR_FIELD_THRESHOLD_DBL |
A CPU’s temperature one minute ago and its current temperature are both above the warning temperature. |
Thermal |
DCGM_FR_FIELD_THRESHOLD_DBL |
A CPU’s current temperature is above the critical temperature. |
Thermal |
DCGM_FR_THERMAL_VIOLATIONS |
Thermal violations were detected on a GPU. |
Thermal |
DCGM_FR_XID_ERROR |
One or more XIDs associated with EDPP Power Brake Thermal Limit were reported. |
Power |
DCGM_FR_CLOCKS_EVENT_POWER |
A GPU had a power violation detected in the last minute. |
Power |
DCGM_FR_FIELD_THRESHOLD_DBL |
A CPU’s power usage is above its power limit. |
Power |
DCGM_FR_POWER_UNREADABLE |
Cannot reliably read the power usage for a GPU. |
Power |
DCGM_FR_XID_ERROR |
One or more XIDs associated with power state change or clock change was reported. |
NVLink |
DCGM_FR_FABRIC_PROBE_STATE |
A GPU has a non-ready fabric state. |
NVLink |
DCGM_FR_FIELD_VIOLATION |
The fabric health mask reports an unhealthy state. |
NVLink |
DCGM_FR_IMEX_UNHEALTHY |
Internode Memory Exchange (IMEX) domain or daemon status is unhealthy. |
NVLink |
DCGM_FR_NVLINK_ERROR_CRITICAL |
An NVLink reported 1 or more errors. This includes datalink CRC, recovery, and replay errors (pre-Blackwell GPUs) and link recovery events (Blackwell+ GPUs). |
NVLink |
DCGM_FR_NVLINK_ERROR_THRESHOLD |
An NVLink reported a rate of errors which exceeds the minimum threshold. |
NVLink |
DCGM_FR_NVLINK_CRC_ERROR_THRESHOLD |
An NVLink reported more than 100 CRC errors per second. |
NVLink |
DCGM_FR_NVLINK_EFFECTIVE_BER_THRESHOLD |
An NVLink reported effective bit error rate which exceeds the minimum threshold. |
NVLink |
DCGM_FR_NVLINK_SYMBOL_BER_THRESHOLD |
An NVLink reported symbol bit error rate which exceeds the minimum threshold. |
NVLink |
DCGM_FR_XID_ERROR |
One or more XIDs associated with NVLink flow control, chip-to-chip (C2C) link correction, or fabric linear addressing (FLA) privilege were reported. |
NVSWitch Fatal |
DCGM_FR_NVSWITCH_FATAL_ERROR |
An NVSwitch reported one or more fatal errors. |
NVSWitch Fatal |
DCGM_FR_NVLINK_DOWN |
One or more NVLinks is being reported as down. |
NVSWitch Non-Fatal |
DCGM_FR_NVSWITCH_NON_FATAL_ERROR |
An NVSwitch reported one or more non-fatal errors. |
ConnectX |
DCGM_FR_FIELD_VIOLATION |
A ConnectX device reported an unhealthy status. |
ConnectX |
DCGM_FR_FIELD_VIOLATION |
A ConnectX device reported PCIe Advanced Error Reporting (AER) uncorrectable errors (fatal or non-fatal). |
Note
The dcgmi interfaces above only report current health status. The underlying data, exposed via other interfaces, captures
more information about the timeframe of the events and their connections to executing processes on the GPU.
Active Health Checks#
This form of health check is invasive, requiring exclusive access to the target GPUs. By running real workloads and analyzing the results, DCGM is able to identify common problems of a variety of types. These include:
Deployment and Software Issues
NVIDIA library access and versioning
3rd-party software conflicts
Integration Issues
Correctable/uncorrectable issues on PCIe/NVLINK busses
Topological limitations
OS-level device restrictions, cgroups checks
Basic power and thermal constraint checks
Stress Checks
Power and thermal stress
PCIe/NVLINK throughput stress
Constant relative system performance
Maximum relative system performance
Hardware Issues and Diagnostics
GPU hardware and SRAMs
Computational robustness
Memory
PCIe/NVLINK busses
DCGM exposes these health checks through its diagnostic and policy interfaces. DCGM provides three levels of diagnostic capability (see dcgmi diag help on the command line). DCGM runs more in-depth tests to verify the health of the GPU at each level. The test names and tests run at each level are provided in the table below:
Test Suite Name |
Run Level |
Test Duration |
Test Classes |
||||
|---|---|---|---|---|---|---|---|
Software |
Hardware |
Integration |
Stress |
||||
Quick |
-r 1 |
~ seconds |
Deployment |
– |
– |
||
Medium |
-r 2 |
~ 2 minutes |
Deployment |
Memory Test |
PCIe/NVLink |
– |
|
Long |
-r 3 |
~ 15 minutes |
Deployment |
|
PCIe/NVLink |
|
|
While simple tests of runtime libraries and configuration are possible on non-Tesla GPUs (Run Level 1), DCGM is also able to perform hardware diagnostics, connectivity diagnostics, and a suite of stress tests on Tesla GPUs to help validate health and isolate problems. The actions in each test type are further described in the section GPU Parameters.
For example, running the full system validation (long test):
$ dcgmi diag -r 3
Successfully ran diagnostic for group.
+---------------------------+------------------------------------------------+
| Diagnostic                | Result                                         |
+===========================+================================================+
|-----  Metadata  ----------+------------------------------------------------|
| DCGM Version              | 4.0.0                                          |
| Driver Version Detected   | 550.90.07                                      |
| GPU Device IDs Detected   | 25b6, 25b6, 25b6, 25b6                         |
|-----  Deployment  --------+------------------------------------------------|
| software                  | Pass                                           |
|                           | GPU0: Pass                                     |
|                           | GPU1: Pass                                     |
|                           | GPU2: Pass                                     |
|                           | GPU3: Pass                                     |
+-----  Hardware  ----------+------------------------------------------------+
| memory                    | Pass                                           |
|                           | GPU0: Pass                                     |
|                           | GPU1: Pass                                     |
|                           | GPU2: Pass                                     |
|                           | GPU3: Pass                                     |
| diagnostic                | Pass                                           |
|                           | GPU0: Pass                                     |
|                           | GPU1: Pass                                     |
|                           | GPU2: Pass                                     |
|                           | GPU3: Pass                                     |
+-----  Integration  -------+------------------------------------------------+
| pcie                      | Pass                                           |
|                           | GPU0: Pass                                     |
|                           | GPU1: Pass                                     |
|                           | GPU2: Pass                                     |
|                           | GPU3: Pass                                     |
+-----  Stress  ------------+------------------------------------------------+
| memory_bandwidth          | Pass                                           |
|                           | GPU0: Pass                                     |
|                           | GPU1: Pass                                     |
|                           | GPU2: Pass                                     |
|                           | GPU3: Pass                                     |
| targeted_stress           | Pass                                           |
|                           | GPU0: Pass                                     |
|                           | GPU1: Pass                                     |
|                           | GPU2: Pass                                     |
|                           | GPU3: Pass                                     |
| targeted_power            | Pass                                           |
|                           | GPU0: Pass                                     |
|                           | GPU1: Pass                                     |
|                           | GPU2: Pass                                     |
|                           | GPU3: Pass                                     |
+---------------------------+------------------------------------------------+
The diagnostic tests can also be run as part of the validation phase of action-based policies. A common scenario, for example, would be to run the short version of the test as a validation to a DBE page retirement action.
DCGM will store logs from these tests on the host file system. Two types of logs exist:
Hardware diagnostics include an encrypted binary log, only viewable by NVIDIA.
System validation and stress checks provide additional time series data via JSON text files. These can be viewed in numerous programs to see much more detailed information about GPU behavior during each test.
Topology#
DCGM provides several mechanisms for understanding GPU topology both at a verbose device-level view and non-verbose group-level view. These views are designed to give a user information about connectivity to other GPUs in the system as well as NUMA/affinity information.
For the device-level view:
$ dcgmi topo --gpuid 0
+-------------------+--------------------------------------------------------+
| GPU ID: 0         | Topology Information                                   |
+===================+========================================================+
| CPU Core Affinity | 0 - 11                                                 |
+-------------------+--------------------------------------------------------+
| To GPU 1          | Connected via an on-board PCIe switch                  |
| To GPU 2          | Connected via a PCIe host bridge                       |
+-------------------+--------------------------------------------------------+
And for the group-level view:
$ dcgmi topo -g 1
+-------------------+--------------------------------------------------------+
| MyGroup           | Topology Information                                   |
+===================+========================================================+
| CPU Core Affinity | 0 - 11                                                 |
+-------------------+--------------------------------------------------------+
| NUMA Optimal      | True                                                   |
+-------------------+--------------------------------------------------------+
| Worst Path        | Connected via a PCIe host bridge                       |
+-------------------+--------------------------------------------------------+
.........
NVLink Counters#
DCGM provides a way to check the nvlink error counters for various links in the system. This makes it easy for clients to catch abnormalities and watch the health of the communication over nvlink. There are multiple types of nvlink errors that are accounted for by DCGM as follows:
CRC FLIT Error: Data link receive flow control digit CRC error
CRC Data Error: Data link receive data CRC error.
Replay Error: Transmit replay error.
Recovery Error: Transmit recovery error.
To check the nvlink counters for all the nvlink present in gpu with gpu Id 0:
$ dcgmi nvlink --errors -g 0
+-------------------------------------------------------------+
| GPU ID: 0 | NVLINK Error Counts                             |
+-------------------------------------------------------------+
|Link 0     | CRC FLIT Error      | 0                         |
|Link 0     | CRC Data Error      | 0                         |
|Link 0     | Replay Error        | 0                         |
|Link 0     | Recovery Error      | 0                         |
|Link 1     | CRC FLIT Error      | 0                         |
|Link 1     | CRC Data Error      | 0                         |
|Link 1     | Replay Error        | 0                         |
|Link 1     | Recovery Error      | 0                         |
|Link 2     | CRC FLIT Error      | 0                         |
|Link 2     | CRC Data Error      | 0                         |
|Link 2     | Replay Error        | 0                         |
|Link 2     | Recovery Error      | 0                         |
|Link 3     | CRC FLIT Error      | 0                         |
|Link 3     | CRC Data Error      | 0                         |
|Link 3     | Replay Error        | 0                         |
|Link 3     | Recovery Error      | 0                         |
+-------------------------------------------------------------+
NVLink COUNT Fields#
Starting with NVLink5 (Blackwell architecture and later), DCGM supports querying NVLink COUNT fields at two granularities:
Aggregate (GPU entity) — returns the sum across all active NVLink ports on a GPU. This is the default and is backward-compatible with all NVLink generations.
Per-link (Link entity) — returns the value for a single NVLink port. Requires NVLink5+ hardware; returns
N/Aon older generations.
NVLink COUNT fields span IDs 1200–1219 (packet/byte/error counters) and 1404–1419 (FEC history buckets). Representative fields:
Field Name |
Field ID |
Description |
|---|---|---|
|
1200 |
Transmitted packets |
|
1201 |
Received packets |
|
1202 |
Transmitted bytes |
|
1203 |
Received bytes |
|
1204 |
Transmit errors |
|
1205 |
Receive errors |
|
1219 |
Effective errors (post-FEC) |
|
1404–1419 |
FEC symbol error history buckets (0 = lowest error rate) |
Per-Link Queries with dcgmi dmon#
Use the gpu_link entity prefix to target a specific NVLink port:
gpu_link:<gpuId>:<linkIndex>
Both <gpuId> and <linkIndex> support range syntax ({N-M}).
Monitor transmitted packets on GPU 0, link 5:
$ dcgmi dmon -e 1200 -i gpu_link:0:5
Monitor links 0–5 on GPU 0:
$ dcgmi dmon -e 1200,1201 -i gpu_link:0:{0-5}
Monitor links 0–3 across GPUs 0 and 1 (Cartesian product):
$ dcgmi dmon -e 1200 -i gpu_link:{0-1}:{0-3}
Sample output:
#Entity          NLXMITP              NLRCVP
GPU 0 LINK 0     1234567              1234321
GPU 0 LINK 1     9876543              9876789
Aggregate (GPU-Level) Queries#
Querying NVLink COUNT fields with a GPU entity returns the aggregate value (sum of all active links). This is the default behavior and works on all NVLink generations:
$ dcgmi dmon -e 1200,1201 -i gpu:0
#Entity    NLXMITP              NLRCVP
GPU 0      22111110             22111110
Per-Link API Usage#
Per-link queries use the DCGM_FE_LINK entity group with an entity ID encoded as a
dcgm_link_t (defined in dcgm_structs.h). The index field maps directly to the
NVML scopeId used to select the NVLink port:
dcgm_link_t link;
link.parsed.type  = DCGM_FE_GPU;  /* GPU NVLink (not a switch link) */
link.parsed.gpuId = 0;            /* GPU ID */
link.parsed.index = 5;            /* Link index (0-based, maps to NVML scopeId) */

dcgmGroupEntityPair_t entity;
entity.entityGroupId = DCGM_FE_LINK;
entity.entityId      = link.raw;
Pass this entity to dcgmEntitiesGetLatestValues() with the desired NVLink COUNT field IDs.
Note
On NVLink4 and earlier hardware, DCGM_FE_LINK queries for COUNT fields return N/A.
Aggregate DCGM_FE_GPU queries continue to work on all supported NVLink generations.
Field Groups#
DCGM provides predefined groups of fields like job statistics, process statistics, and health for ease of use. Additionally, DCGM allows users to create their own custom groups of fields called field groups. Users can watch a group of fields on a group of GPUs and then retrieve either the latest values or a range of values of every field in a field group for every GPU in a group.
Field groups are not used directly in DCGMI, but you can still look at them and manage them from DCGMI.
To see all of the active field groups on a system, run:
$ dcgmi fieldgroup -l
4 field groups found.
+----------------------------------------------------------------------------+
| FIELD GROUPS                                                               |
+============+===============================================================+
| ID         | 1                                                             |
| Name       | DCGM_INTERNAL_1SEC                                            |
| Field IDs  | 38, 73, 86, 112, 113, 119, 73, 51, 47, 46, 66, 72, 61, 118,...|
+------------+---------------------------------------------------------------+
| ID         | 2                                                             |
| Name       | DCGM_INTERNAL_30SEC                                           |
| Field IDs  | 124, 125, 126, 130, 131, 132, 133, 134, 135, 136, 137, 138,...|
+------------+---------------------------------------------------------------+
| ID         | 3                                                             |
| Name       | DCGM_INTERNAL_HOURLY                                          |
| Field IDs  | 117, 55, 56, 64, 62, 63, 6, 5, 26, 8, 17, 107, 22, 108, 30, 31|
+------------+---------------------------------------------------------------+
| ID         | 4                                                             |
| Name       | DCGM_INTERNAL_JOB                                             |
| Field IDs  | 111, 65, 36, 37, 38, 101, 102, 77, 78, 40, 41, 121, 115, 11...|
+------------+---------------------------------------------------------------+
If you want to create your own field group, pick a unique name for it, decide which field IDs you want inside of it, and run:
$ dcgmi fieldgroup -c mygroupname -f 50,51,52
Successfully created field group "mygroupname" with a field group ID of 5
Note that field IDs come from dcgm_fields.h and are the macros that start with DCGM_FI_.
Once you have created a field group, you can query its info:
$ dcgmi fieldgroup -i --fieldgroup 5
+----------------------------------------------------------------------------+
| FIELD GROUPS                                                               |
+============+===============================================================+
| ID         | 5                                                             |
| Name       | mygroupname                                                   |
| Field IDs  | 50, 51, 52                                                    |
+------------+---------------------------------------------------------------+
If you want to delete a field group, run the following command:
$ dcgmi fieldgroup -d -g 5
Successfully removed field group 5
Note that DCGM creates a few field groups internally. Field groups that are created internally, like the ones above, cannot be removed. Here is an example of trying to delete a DCGM-internal field group:
$ dcgmi fieldgroup -d -g 1
Error: Cannot destroy field group 1. Return: No permission.
A custom field group can be used with dcgmi dmon to stream the selected fields:
$ dcgmi dmon --field-group-id 5
Link Status#
Starting with DCGM 1.5, you can query the status of the NVLinks of the GPUs and NVSwitches attached to the system with the following command:
$ dcgmi nvlink --link-status

+----------------------+
|  NvLink Link Status  |
+----------------------+
GPUs:
    gpuId 0:
        U U U U U U
    gpuId 1:
        U U U U U U
    gpuId 2:
        U U U U U U
    gpuId 3:
        U U U U U U
    gpuId 4:
        U U U U U U
    gpuId 5:
        U U U U U U
    gpuId 6:
        U U U U U U
    gpuId 7:
        U U U U U U
    gpuId 8:
        U U U U U U
    gpuId 9:
        U U U U U U
    gpuId 10:
        U U U U U U
    gpuId 11:
        U U U U U U
    gpuId 12:
        U U U U U U
    gpuId 13:
        U U U U U U
    gpuId 14:
        U U U U U U
    gpuId 15:
        U U U U U U
NvSwitches:
    physicalId 8:
        U U U U U U X X U U U U U U U U U U
    physicalId 9:
        U U U U U U U U U U U U U U X X U U
    physicalId 10:
        U U U U U U U U U U U U X U U U X U
    physicalId 11:
        U U U U U U X X U U U U U U U U U U
    physicalId 12:
        U U U U X U U U U U U U U U U U X U
    physicalId 13:
        U U U U X U U U U U U U U U U U X U
    physicalId 24:
        U U U U U U X X U U U U U U U U U U
    physicalId 25:
        U U U U U U U U U U U U U U X X U U
    physicalId 26:
        U U U U U U U U U U U U X U U U X U
    physicalId 27:
        U U U U U U X X U U U U U U U U U U
    physicalId 28:
        U U U U X U U U U U U U U U U U X U
    physicalId 29:
        U U U U X U U U U U U U U U U U X U

Key: Up=U, Down=D, Disabled=X, Not Supported=_
To show the packed dcgm_link_t entity IDs for supported links, add the
--show-entity-ids option:
$ dcgmi nvlink --link-status --show-entity-ids
The Link Entities output lists each supported link as
<linkIndex>:<entityId>. These entity IDs can be passed to dcgmi dmon -i
as raw decimal link IDs. Hex link IDs with a 0x prefix are also supported,
which is useful when copying a hex link ID from dcgmi dmon output.
$ dcgmi dmon -i link:259 -e 8
$ dcgmi dmon -i link:0x103 -e 8
For NvSwitch links, dcgmi dmon -i also accepts the human-readable
switch_link:<switchId>:<linkIndex> form. For example, link:259,
link:0x103, and switch_link:0:1 all select the same DCGM_FE_LINK
entity. Range syntax is supported for the NvSwitch ID and for the link index.
$ dcgmi dmon -i switch_link:{0-1}:{0-3} -e 8
Detached GPUs#
Overview#
Beginning with DCGM 4.5 and driver 590, DCGM supports GPU binding and unbinding. DCGM can launch even when no GPU is detected and admin can attach GPUs to the system on the fly. It monitors events and automatically recognizes any newly attached GPUs or detached GPUs. In addition, DCGM supports dynamic attach and detach of driver, allowing driver updates without stopping DCGM.
Ways to Detach GPUs#
Use DCGM Public APIs#
DCGM offers two public APIs for detaching and attaching drivers: dcgmDetachDriver and dcgmAttachDriver.
When dcgmDetachDriver is called, it detaches NVML from DCGM and sets all GPUs to a detached state. When dcgmAttachDriver is called, DCGM attaches NVML, setting all found GPUs to an OK state and removing any still-detached GPUs from groups along with their watched fields.
dcgmi offers command-line interfaces for these two APIs.
$ dcgmi set --attach-driver
$ dcgmi set --detach-driver
Use sysfs#
# echo "<PCI Bus ID>" > /sys/bus/pci/devices/<PCI Bus ID>/driver/unbind
# echo "<PCI Bus ID>" > /sys/bus/pci/drivers/nvidia/bind
We can use these sysfs entries to detach and attach a GPU.
For example:
# echo "0000:65:00.0" > /sys/bus/pci/devices/0000\:65\:00.0/driver/unbind
# echo "0000:65:00.0" > /sys/bus/pci/drivers/nvidia/bind
Behavior of Detached GPUs#
GPU Entity Id#
The DCGM GPU ID stays the same throughout the entire life cycle of the DCGM main process (nv‑hostengine), even after attach and detach operations.
Group#
The detached GPUs and their associated MIG instances will be removed from the groups.
It is not allowed to add detached GPUs to a group.
Configuration#
The DCGM applied configuration will be reset upon GPU detachment. Therefore, the config will not be automatically reapplied upon reattachment.
DCGM cannot set configuration on detached GPUs.
DCGM cannot acquire configuration on detached GPUs.
Watches and Monitoring#
DCGM cannot watch fields on detached GPUs.
All cached values and watched fields are removed from detached GPUs.
Watched fields on group
DCGM_GROUP_ALL_GPUSwill be automatically apply to newly attached GPUs.
Topology#
dcgmGetDeviceTopologyOn detached GPU: The returns will include 0 GPUs that is reachable.
On normal GPU: The detached GPU will be excluded from the paths.
dcgmSelectGpusByTopologywill not include detached GPUs in the output.
Policy#
Policies for group
DCGM_GROUP_ALL_GPUSwill be automatically applied to newly attached GPUs.Registered policies will not be triggered on detached GPUs.
Registered policies will be removed from detached GPUs.
Policy is unable to be set on detached GPUs.
Profiling#
DCGM cannot watch profiling fields on detached GPUs.
On profiling module, all watches on detached GPUs will be removed.
Watched profiling fields on group
DCGM_GROUP_ALL_GPUSwill be automatically applied to newly attached GPUs.
Diagnostic#
Running diagnostic will be stopped during attach and detach process.
When specifying a group, only active GPUs will be tested.
Detached GPUs will not be tested.
If only detached GPUs are specified, the diag will fail directly.
If including both detached GPUs and active GPUs, only active GPUs will be tested.
Multi-Node Diagnostics#
When detaching or attaching GPUs during MnDiag operation, the attach and detach processes will wait until MnDiag is complete.
Health#
Health watches on group
DCGM_GROUP_ALL_GPUSwill be automatically applied to newly attached GPUs.Health checks will not report incidents on detached GPUs.
CPU Monitoring#
Overview#
DCGM supports CPU monitoring for NVIDIA datacenter CPUs. In general, CPU fields are treated the same way as other NVIDIA hardware entities. This section includes additional information to help you get started.
Requirements#
The features described here are only supported for NVIDIA Grace CPUs, and support for these features begins with DCGM 3.3.
Introduction#
The two entity groups for CPUs in DCGM are DCGM_FE_CPU and DCGM_FE_CPU_CORE, corresponding to the CPUs and cores in Grace. Some fields are only measured at the level of CPUs, while others have measurements for each core.
CPU And Core Fields#
Field Name |
Description |
Field ID |
Measured at |
|---|---|---|---|
DCGM_FI_DEV_CPU_UTIL_TOTAL |
The total percentage of time in use |
1100 |
Core |
DCGM_FI_DEV_CPU_UTIL_USER |
The percentage of time in use by the user |
1101 |
Core |
DCGM_FI_DEV_CPU_UTIL_NICE |
The percentage of time in use by low priority (high nice score) programs |
1102 |
Core |
DCGM_FI_DEV_CPU_UTIL_SYS |
The percentage of time in use by the system |
1103 |
Core |
DCGM_FI_DEV_CPU_UTIL_IRQ |
The percentage of time in use by interrupts |
1104 |
Core |
DCGM_FI_DEV_CPU_TEMP_CURRENT |
Instantaneous temperature (Celsius) |
1110 |
CPU |
DCGM_FI_DEV_CPU_CLOCK_CURRENT |
Instantaneous clock speed (KHz) |
1120 |
Core |
DCGM_FI_DEV_CPU_POWER_UTIL_CURRENT |
Instantaneous power usage (watts) |
1130 |
CPU |
DCGM_FI_DEV_CPU_POWER_LIMIT |
Instantaneous power limit (watts) |
1131 |
CPU |
DCGM_FI_DEV_CPU_VENDOR |
The name of the vendor |
1140 |
CPU |
DCGM_FI_DEV_CPU_MODEL |
The name of the model |
1141 |
CPU |
Examples#
Create a group and add some CPUs and cores to it
$ dcgmi group -c cpu_group1 -a cpu:{0-3},core:{0-287}
Watch field temperatures using dcgmi dmon
$ dcgmi dmon --entity-id cpu:{0-3} -e 1130
Profiling Metrics#
As GPU-enabled servers become more common in the datacenter, it becomes important to better understand applications’ performance and the utilization of GPU resources in the cluster. Profiling metrics in DCGM enables the collection of a set of metrics using the hardware counters on the GPU. DCGM provides access to device-level metrics at low performance overhead in a continuous manner. This feature is supported in production starting with DCGM 1.7.
DCGM includes a new profiling module to provide access to these metrics. The new metrics are available
as new fields (i.e. new IDs) via the regular DCGM APIs (such as the C, Python, Go bindings or the dcgmi
command line utility). The installer packages also include an example CUDA based test load generator
(called dcgmproftester) to demonstrate the new capabilities.
Metrics#
The following new device-level profiling metrics are supported. The definitions and corresponding DCGM field
IDs are listed. By default, DCGM provides the metrics at a sample rate of 1Hz (every 1000ms). Users can query
the metrics at any configurable frequency (minimum is 100ms) from DCGM (for example, see dcgmi dmon -d).
Metric |
Definition |
DCGM Field Name (DCGM_FI_*) and ID |
|---|---|---|
Graphics Engine Activity |
The fraction of time any portion of the graphics or compute engines were active. The graphics engine is active if a graphics/compute context is bound and the graphics/compute pipe is busy. The value represents an average over a time interval and is not an instantaneous value. |
PROF_GR_ENGINE_ACTIVE (ID: 1001) |
SM Activity |
The fraction of time at least one warp was active on a multiprocessor, averaged over all multiprocessors. Note that “active” does not necessarily mean a warp is actively computing. For instance, warps waiting on memory requests are considered active. The value represents an average over a time interval and is not an instantaneous value. A value of 0.8 or greater is necessary, but not sufficient, for effective use of the GPU. A value less than 0.5 likely indicates ineffective GPU usage. Given a simplified GPU architectural view, if a GPU has N SMs then a kernel using N blocks that runs over the entire
time interval will correspond to an activity of 1 (100%). A kernel using N/5 blocks that runs over the entire time
interval will correspond to an activity of 0.2 (20%). A kernel using N blocks that runs over one fifth of the time
interval, with the SMs otherwise idle, will also have an activity of 0.2 (20%). The value is insensitive to the number
of threads per block (see |
PROF_SM_ACTIVE (ID: 1002) |
SM Occupancy |
The fraction of resident warps on a multiprocessor, relative to the maximum number of concurrent warps supported on
a multiprocessor. The value represents an average over a time interval and is not an instantaneous value. Higher occupancy
does not necessarily indicate better GPU usage. For GPU memory bandwidth limited workloads (see Calculating occupancy is not simple and depends on factors such as the GPU properties, the number of threads per block, registers per thread, and shared memory per block. Use the CUDA Occupancy Calculator to explore various occupancy scenarios. |
PROF_SM_OCCUPANCY (ID: 1003) |
Tensor Activity |
The fraction of cycles the tensor (HMMA / IMMA) pipe was active. The value represents an average over a time interval
and is not an instantaneous value. Higher values indicate higher utilization of the Tensor Cores. An activity of 1 (100%) is
equivalent to issuing a tensor instruction every other cycle for the entire time interval. An activity of 0.2 (20%) could
indicate 20% of the SMs are at 100% utilization over the entire time period, 100% of the SMs are at 20% utilization over the
entire time period, 100% of the SMs are at 100% utilization for 20% of the time period, or any combination in between
(see |
PROF_PIPE_TENSOR_ACTIVE (ID: 1004) |
FP64 Engine Activity |
The fraction of cycles the FP64 (double precision) pipe was active. The value represents an average over a time interval and is not an instantaneous value. Higher values indicate higher utilization of the FP64 cores. An activity of 1 (100%) is equivalent to a FP64 instruction on every SM every fourth cycle on Volta over the entire time interval. An activity of 0.2 (20%) could indicate 20% of the SMs are at 100% utilization over the entire time period, 100% of the SMs are at 20% utilization over the entire time period, 100% of the SMs are at 100% utilization for 20% of the time period, or any combination in between (see DCGM_FI_PROF_SM_ACTIVE to help disambiguate these possibilities). |
PROF_PIPE_FP64_ACTIVE (ID: 1006) |
FP32 Engine Activity |
The fraction of cycles the FMA (FP32 (single precision), and integer) pipe was active. The value represents an average over a time
interval and is not an instantaneous value. Higher values indicate higher utilization of the FP32 cores. An activity of 1 (100%) is
equivalent to a FP32 instruction every other cycle over the entire time interval. An activity of 0.2 (20%) could indicate 20% of the
SMs are at 100% utilization over the entire time period, 100% of the SMs are at 20% utilization over the entire time period, 100% of
the SMs are at 100% utilization for 20% of the time period, or any combination in between (see |
PROF_PIPE_FP32_ACTIVE (ID: 1007) |
FP16 Engine Activity |
The fraction of cycles the FP16 (half precision) pipe was active. The value represents an average over a time interval and is
not an instantaneous value. Higher values indicate higher utilization of the FP16 cores. An activity of 1 (100%) is equivalent
to a FP16 instruction every other cycle over the entire time interval. An activity of 0.2 (20%) could indicate 20% of the SMs
are at 100% utilization over the entire time period, 100% of the SMs are at 20% utilization over the entire time period, 100% of
the SMs are at 100% utilization for 20% of the time period, or any combination in between (see |
PROF_PIPE_FP16_ACTIVE (ID: 1008) |
Memory BW Utilization |
The fraction of cycles where data was sent to or received from device memory. The value represents an average over a time interval and is not an instantaneous value. Higher values indicate higher utilization of device memory. An activity of 1 (100%) is equivalent to a DRAM instruction every cycle over the entire time interval (in practice a peak of ~0.8 (80%) is the maximum achievable). An activity of 0.2 (20%) indicates that 20% of the cycles are reading from or writing to device memory over the time interval. |
PROF_DRAM_ACTIVE (ID: 1005) |
NVLink Bandwidth |
The rate of data transmitted / received over NVLink, not including protocol headers, in bytes per second. The value represents an average over a time interval and is not an instantaneous value. The rate is averaged over the time interval. For example, if 1 GB of data is transferred over 1 second, the rate is 1 GB/s regardless of the data transferred at a constant rate or in bursts. The theoretical maximum NVLink Gen2 bandwidth is 25 GB/s per link per direction. |
PROF_NVLINK_TX_BYTES (1011) and PROF_NVLINK_RX_BYTES (1012) |
PCIe Bandwidth |
The rate of data transmitted / received over the PCIe bus, including both protocol headers and data payloads, in bytes per second. The value represents an average over a time interval and is not an instantaneous value. The rate is averaged over the time interval. For example, if 1 GB of data is transferred over 1 second, the rate is 1 GB/s regardless of the data transferred at a constant rate or in bursts. The theoretical maximum PCIe Gen3 bandwidth is 985 MB/s per lane. |
PROF_PCIE_[T|R]X_BYTES (ID: 1009 (TX); 1010 (RX)) |
Profiling of the GPU counters requires administrator privileges starting with Linux drivers 418.43 or later. This is documented here. When using profiling metrics from DCGM, ensure that nv-hostengine is started with superuser privileges.
Multiplexing of Profiling Counters#
Some metrics require multiple passes to be collected and therefore all metrics cannot be collected together. Due to hardware limitations on the GPUs, only certain groups of metrics can be read together. For example, SM Activity | SM Occupancy cannot be collected together with Tensor Utilization on V100 but can be done on T4. To overcome these hardware limitations, DCGM supports automatic multiplexing of metrics by statistically sampling the requested metrics and performing the groupings internally. This may be transparent to users who requested metrics that may not have been able to be collected together.
A side-effect of multiplexing is that collection at higher frequencies will result in zeroes returned as DCGM attempts to group metrics together for collection.
The metrics that can be collected together for a specific GPU can be determined by running the following command:
$ dcgmi profile -l -i 0
+----------------+----------+------------------------------------------------------+
| Group.Subgroup | Field ID | Field Tag                                            |
+----------------+----------+------------------------------------------------------+
| A.1            | 1002     | sm_active                                            |
| A.1            | 1003     | sm_occupancy                                         |
| A.1            | 1004     | tensor_active                                        |
| A.1            | 1007     | fp32_active                                          |
| A.2            | 1006     | fp64_active                                          |
| A.3            | 1008     | fp16_active                                          |
| B.0            | 1005     | dram_active                                          |
| C.0            | 1009     | pcie_tx_bytes                                        |
| C.0            | 1010     | pcie_rx_bytes                                        |
| D.0            | 1001     | gr_engine_active                                     |
| E.0            | 1011     | nvlink_tx_bytes                                      |
| E.0            | 1012     | nvlink_rx_bytes                                      |
+----------------+----------+------------------------------------------------------+
From the output above, we can determine that for this GPU (in this example, an NVIDIA T4), a metric from each letter group
can be collected without multiplexing. From this example, a metric from A.1 can be collected with another metric from A.1
without multiplexing. A metric from A.1 will be multiplexed with another metric from A.2 or A.3. Metrics from different
letter groups can be combined for concurrent collection (without requiring multiplexing by DCGM).
Building on this example further, on T4 these metrics can be collected together without multiplexing:
sm_active + sm_occupancy + tensor_active + fp32_active
The above DCGM command will show what groupings are supported by the hardware for concurrent collection.
Concurrent Usage of NVIDIA Profiling Tools#
Due to current hardware limitations, collection of profiling metrics with DCGM will conflict with usage of other developer
tools from NVIDIA such as Nsight Systems or Nsight Compute. Users may encounter an error from DCGM
(either with dcgmi or when using the APIs) such as:
Error setting watches. Result: The requested operation could not be completed because the affected resource is in use.
To allow DCGM to co-exist with the usage of other profiling tools, it is recommended to pause metrics collection with DCGM when the tools are in use and then resume after the usage of the tools is complete.
With dcgmi profile, the --pause and --resume options can be used:
$ dcgmi profile --pause
$ dcgmi profile --resume
When using DCGM APIs, the following APIs can be called from the monitoring process: dcgmProfPause() and dcgmProfResume()
When paused, DCGM will publish BLANK values for profiling metrics. These BLANK values can be tested with DCGM_FP64_IS_BLANK(value) in the
C or Python bindings.
CUDA Test Generator (dcgmproftester)#
dcgmproftester is a CUDA load generator. It can be used to generate deterministic CUDA workloads for reading and
validating GPU metrics. The tool is shipped as a simple x86_64 Linux binary along with the CUDA kernels compiled to PTX.
Customers can use the tool in conjunction with dcgmi to quickly generate a load on the GPU and view the metrics reported by DCGM via dcgmi dmon on stdout.
dcgmproftester takes two important arguments as input: -t for generating load for a particular metric
(for example use 1004 to generate a half-precision matrix-multiply-accumulate for the Tensor Cores) and -d for specifying the test duration.
Add --no-dcgm-validation to let dcgmproftester generate test loads only.
For a list of all the field IDs that can be used to generate specific test loads, see the table in the Profiling Metrics section. The rest of this section
includes some examples using the dcgmi command line utility.
For example in a console, generate a load for the TensorCores on A100 for 30seconds. As can be seen, the A100 is able to achieve close to 253TFLops of FP16 performance using the TensorCores.
$ /usr/bin/dcgmproftester11 --no-dcgm-validation -t 1004 -d 10
Skipping CreateDcgmGroups() since DCGM validation is disabled
Skipping CreateDcgmGroups() since DCGM validation is disabled
Skipping WatchFields() since DCGM validation is disabled
Skipping CreateDcgmGroups() since DCGM validation is disabled
Worker 0:0[1004]: TensorEngineActive: generated ???, dcgm 0.000 (250362.2 gflops)
Worker 0:0[1004]: TensorEngineActive: generated ???, dcgm 0.000 (252917.0 gflops)
Worker 0:0[1004]: TensorEngineActive: generated ???, dcgm 0.000 (253971.7 gflops)
Worker 0:0[1004]: TensorEngineActive: generated ???, dcgm 0.000 (253700.2 gflops)
Worker 0:0[1004]: TensorEngineActive: generated ???, dcgm 0.000 (252599.0 gflops)
Worker 0:0[1004]: TensorEngineActive: generated ???, dcgm 0.000 (253134.6 gflops)
Worker 0:0[1004]: TensorEngineActive: generated ???, dcgm 0.000 (252676.7 gflops)
Worker 0:0[1004]: TensorEngineActive: generated ???, dcgm 0.000 (252861.4 gflops)
Worker 0:0[1004]: TensorEngineActive: generated ???, dcgm 0.000 (252764.1 gflops)
Worker 0:0[1004]: TensorEngineActive: generated ???, dcgm 0.000 (253109.4 gflops)
Worker 0:0[1004]: Message: Bus ID 00000000:00:04.0 mapped to cuda device ID 0
DCGM CudaContext Init completed successfully.

CU_DEVICE_ATTRIBUTE_MAX_THREADS_PER_MULTIPROCESSOR: 2048
CUDA_VISIBLE_DEVICES:
CU_DEVICE_ATTRIBUTE_MULTIPROCESSOR_COUNT: 108
CU_DEVICE_ATTRIBUTE_MAX_SHARED_MEMORY_PER_MULTIPROCESSOR: 167936
CU_DEVICE_ATTRIBUTE_COMPUTE_CAPABILITY_MAJOR: 8
CU_DEVICE_ATTRIBUTE_COMPUTE_CAPABILITY_MINOR: 0
CU_DEVICE_ATTRIBUTE_GLOBAL_MEMORY_BUS_WIDTH: 5120
CU_DEVICE_ATTRIBUTE_MEMORY_CLOCK_RATE: 1215
Max Memory bandwidth: 1555200000000 bytes (1555.2 GiB)
CU_DEVICE_ATTRIBUTE_ECC_SUPPORT: true
In another console, use the dcgmi dmon -e command to view the various performance metrics (streamed to stdout) reported by
DCGM as the CUDA workload runs on the GPU. In this example, DCGM reports the GPU activity, TensorCore activity and Memory utilization
at a frequency of 1Hz (or 1000ms). As can be seen, the GPU is busy doing work (~99% of Graphics Activity showing that the SMs are busy),
with the TensorCore activity pegged to ~93%. Note that dcgmi is currently returning the metrics for GPU ID: 0. On a multi-GPU system,
you can specify the GPU ID for which DCGM should return the metrics. By default, the metrics are returned for all the GPUs in the system.
$ dcgmi dmon -e 1001,1004,1005
# Entity  GRACT  TENSO  DRAMA
      Id
    GPU 0  0.000  0.000  0.000
    GPU 0  0.000  0.000  0.000
    GPU 0  0.000  0.000  0.000
    GPU 0  0.552  0.527  0.000
    GPU 0  0.969  0.928  0.000
    GPU 0  0.973  0.931  0.000
    GPU 0  0.971  0.929  0.000
    GPU 0  0.969  0.927  0.000
    GPU 0  0.971  0.929  0.000
    GPU 0  0.971  0.930  0.000
    GPU 0  0.973  0.931  0.000
    GPU 0  0.974  0.931  0.000
    GPU 0  0.971  0.930  0.000
    GPU 0  0.974  0.932  0.000
    GPU 0  0.972  0.930  0.000
Metrics on Multi-Instance GPU#
The Multi-Instance GPU (MIG) feature allows supported NVIDIA GPUs to be securely partitioned into up to seven separate GPU Instances for CUDA applications, providing multiple users with separate GPU resources for optimal GPU utilization. This feature is particularly beneficial for workloads that do not fully saturate the GPU’s compute capacity and therefore users may want to run different workloads in parallel to maximize utilization. For more information on MIG, refer to the MIG User Guide.
DCGM can provide metrics for workloads that are running on MIG devices. DCGM offers two views of the metrics for MIG:
GPU device-level metrics
MIG device (either GPU Instance or Compute Instance) granularity of the metrics
Example 1#
In this example, let’s generate a CUDA workload using dcgmproftester and observe metrics using dcgmi dmon.
In this example, we follow these steps to demonstrate the collection of metrics for MIG devices:
Create MIG devices (assumes that the GPU has MIG mode enabled)
Verify DCGM can list the devices
Create a group of devices for DCGM to monitor
Run CUDA workloads on the desired MIG device(s)
Use dcgmi dmon to stream metrics
$ sudo nvidia-smi mig -cgi 9,9 -C
...
+-----------------------------------------------------------------------------+
| MIG devices:                                                                |
+------------------+----------------------+-----------+-----------------------+
| GPU  GI  CI  MIG |         Memory-Usage |        Vol|         Shared        |
|      ID  ID  Dev |           BAR1-Usage | SM     Unc| CE  ENC  DEC  OFA  JPG|
|                  |                      |        ECC|                       |
|==================+======================+===========+=======================|
|  0    1   0   0  |     11MiB / 20096MiB | 42      0 |  3   0    2    0    0 |
|                  |      0MiB / 32767MiB |           |                       |
+------------------+----------------------+-----------+-----------------------+
|  0    2   0   1  |     11MiB / 20096MiB | 42      0 |  3   0    2    0    0 |
|                  |      0MiB / 32767MiB |           |                       |
+------------------+----------------------+-----------+-----------------------+
$ dcgmi discovery -c
+-------------------+--------------------------------------------------------------------+
| Instance Hierarchy                                                                     |
+===================+====================================================================+
| GPU 0             | GPU GPU-5fd15f35-e148-2992-4ecb-9825e534f253 (EntityID: 0)         |
| -> I 0/1          | GPU Instance (EntityID: 0)                                         |
|    -> CI 0/1/0    | Compute Instance (EntityID: 0)                                     |
| -> I 0/2          | GPU Instance (EntityID: 1)                                         |
|    -> CI 0/2/0    | Compute Instance (EntityID: 1)                                     |
+-------------------+--------------------------------------------------------------------+
$ dcgmi group -c mig-ex1 -a 0,i:0,i:1
Successfully created group "mig-ex1" with a group ID of 8
Specified entity ID is valid but unknown: i:0. ParsedResult: ParsedGpu(i:0)
Specified entity ID is valid but unknown: i:1. ParsedResult: ParsedGpu(i:1)
Add to group operation successful.
Now, we can list the devices added to the group and see that the group contains the GPU (GPU:0), GPU Instances (0 and 1):
$ dcgmi group -l
+-------------------+----------------------------------------------------------+
| GROUPS                                                                       |
| 1 group found.                                                               |
+===================+==========================================================+
| Groups            |                                                          |
| -> 8              |                                                          |
|    -> Group ID    | 8                                                        |
|    -> Group Name  | mig-ex1                                                  |
|    -> Entities    | GPU 0, GPU_I 0, GPU_I 1                                  |
+-------------------+----------------------------------------------------------+
dcgmproftester. Note that dcgmproftester will run on all GPU instances available on the GPU.
There is currently no way to limit the GPU instances from dcgmproftester (though one could do this by running a dcgmproftester container,
which we will see in the next example).$ sudo dcgmproftester11 --no-dcgm-validation -t 1004 -d 120
Skipping CreateDcgmGroups() since DCGM validation is disabled
Skipping CreateDcgmGroups() since DCGM validation is disabled
Skipping CreateDcgmGroups() since DCGM validation is disabled
Skipping WatchFields() since DCGM validation is disabled
Skipping CreateDcgmGroups() since DCGM validation is disabled
Worker 0:0[1004]: TensorEngineActive: generated ???, dcgm { GPU: 0.000, GI: 0.000, CI: 0.000 } (102659.5 gflops)
Worker 0:1[1004]: TensorEngineActive: generated ???, dcgm { GPU: 0.000, GI: 0.000, CI: 0.000 } (102659.8 gflops)
Worker 0:0[1004]: TensorEngineActive: generated ???, dcgm { GPU: 0.000, GI: 0.000, CI: 0.000 } (107747.3 gflops)
Worker 0:1[1004]: TensorEngineActive: generated ???, dcgm { GPU: 0.000, GI: 0.000, CI: 0.000 } (107787.3 gflops)
Worker 0:0[1004]: TensorEngineActive: generated ???, dcgm { GPU: 0.000, GI: 0.000, CI: 0.000 } (108107.6 gflops)
Worker 0:1[1004]: TensorEngineActive: generated ???, dcgm { GPU: 0.000, GI: 0.000, CI: 0.000 } (108102.3 gflops)
Worker 0:0[1004]: TensorEngineActive: generated ???, dcgm { GPU: 0.000, GI: 0.000, CI: 0.000 } (108001.2 gflops)

snip...snip

Worker 0:0[1004]: Message: DCGM CudaContext Init completed successfully.

CU_DEVICE_ATTRIBUTE_MAX_THREADS_PER_MULTIPROCESSOR: 2048
CUDA_VISIBLE_DEVICES: MIG-GPU-5fd15f35-e148-2992-4ecb-9825e534f253/1/0
CU_DEVICE_ATTRIBUTE_MULTIPROCESSOR_COUNT: 42
CU_DEVICE_ATTRIBUTE_MAX_SHARED_MEMORY_PER_MULTIPROCESSOR: 167936
CU_DEVICE_ATTRIBUTE_COMPUTE_CAPABILITY_MAJOR: 8
CU_DEVICE_ATTRIBUTE_COMPUTE_CAPABILITY_MINOR: 0
CU_DEVICE_ATTRIBUTE_GLOBAL_MEMORY_BUS_WIDTH: 5120
CU_DEVICE_ATTRIBUTE_MEMORY_CLOCK_RATE: 1215
Max Memory bandwidth: 1555200000000 bytes (1555.2 GiB)
CU_DEVICE_ATTRIBUTE_ECC_SUPPORT: true

Worker 0:1[1004]: Message: DCGM CudaContext Init completed successfully.

CU_DEVICE_ATTRIBUTE_MAX_THREADS_PER_MULTIPROCESSOR: 2048
CUDA_VISIBLE_DEVICES: MIG-GPU-5fd15f35-e148-2992-4ecb-9825e534f253/2/0
CU_DEVICE_ATTRIBUTE_MULTIPROCESSOR_COUNT: 42
CU_DEVICE_ATTRIBUTE_MAX_SHARED_MEMORY_PER_MULTIPROCESSOR: 167936
CU_DEVICE_ATTRIBUTE_COMPUTE_CAPABILITY_MAJOR: 8
CU_DEVICE_ATTRIBUTE_COMPUTE_CAPABILITY_MINOR: 0
CU_DEVICE_ATTRIBUTE_GLOBAL_MEMORY_BUS_WIDTH: 5120
CU_DEVICE_ATTRIBUTE_MEMORY_CLOCK_RATE: 1215
Max Memory bandwidth: 1555200000000 bytes (1555.2 GiB)
CU_DEVICE_ATTRIBUTE_ECC_SUPPORT: true

Skipping UnwatchFields() since DCGM validation is disabled
dcgmi dmondcgmi dmon.
Notice that in this example, we show the GPU Activity (1001) and the Tensor Core Utilization (1004) for the group 8 that we created in Step 3.$ dcgmi dmon -e 1001,1004 -g 8
# Entity  GRACT  TENSO
      Id
    GPU 0  0.000  0.000
  GPU-I 0  0.000  0.000
  GPU-I 1  0.000  0.000
    GPU 0  0.000  0.000
  GPU-I 0  0.000  0.000
  GPU-I 1  0.000  0.000
    GPU 0  0.457  0.442
  GPU-I 0  0.534  0.516
  GPU-I 1  0.533  0.515
    GPU 0  0.845  0.816
  GPU-I 0  0.986  0.953
  GPU-I 1  0.985  0.952
    GPU 0  0.846  0.817
  GPU-I 0  0.987  0.953
  GPU-I 1  0.986  0.953
    GPU 0  0.846  0.817
  GPU-I 0  0.987  0.954
  GPU-I 1  0.986  0.953
    GPU 0  0.843  0.815
  GPU-I 0  0.985  0.951
  GPU-I 1  0.983  0.950
    GPU 0  0.845  0.817
  GPU-I 0  0.987  0.953
  GPU-I 1  0.985  0.952
    GPU 0  0.844  0.816
  GPU-I 0  0.985  0.952
  GPU-I 1  0.984  0.951
    GPU 0  0.845  0.816
  GPU-I 0  0.986  0.952
  GPU-I 1  0.985  0.952
Understanding Metrics#
To understand the metrics attribution, GRACT is calculated based on the number of allocated compute resources to
the total number of compute resources available on the GPU. We can see the total number of compute resources (SMs)
using the nvidia-smi command:
$ sudo nvidia-smi mig -lgip
+--------------------------------------------------------------------------+
| GPU instance profiles:                                                   |
| GPU   Name          ID    Instances   Memory     P2P    SM    DEC   ENC  |
|                           Free/Total   GiB              CE    JPEG  OFA  |
|==========================================================================|
|   0  MIG 1g.5gb     19     0/7        4.75       No     14     0     0   |
|                                                          1     0     0   |
+--------------------------------------------------------------------------+
|   0  MIG 2g.10gb    14     0/3        9.75       No     28     1     0   |
|                                                          2     0     0   |
+--------------------------------------------------------------------------+
|   0  MIG 3g.20gb     9     0/2        19.62      No     42     2     0   |
|                                                          3     0     0   |
+--------------------------------------------------------------------------+
|   0  MIG 4g.20gb     5     0/1        19.62      No     56     2     0   |
|                                                          4     0     0   |
+--------------------------------------------------------------------------+
|   0  MIG 7g.40gb     0     0/1        39.50      No     98     5     0   |
|                                                          7     1     1   |
+--------------------------------------------------------------------------+
Because the MIG geometry in this example is 3g.20gb, the compute resources are = 2*42/98 or 85.71%. We can now interpret GRACT from the dcgmi dmon output:
  GPU 0  0.845  0.816
GPU-I 0  0.986  0.952
GPU-I 1  0.985  0.952
Since each GPU instance is 98.6% active, the entire GPU = 0.8571*0.986 or 84.5% utilized. The same interpretation can be extended to Tensor Core utilization.
Platform Support#
Profiling metrics are currently supported on datacenter products starting with the Volta architecture on Linux x86_64, Arm64 (aarch64) and POWER (ppc64le) platforms.
Hang Detection#
In DCGM 4.4.2 and later, nv-hostengine supports hang detection. See the Host Engine Environment Variables Affecting Hang Detection section for configuration details.
The diagnostic also supports hang detection (since DCGM 4.4). See the dcgm-diagnostics-hangdetect-environment section for configuration details.