DGX Dashboard#
Overview#
The DGX Spark comes with a built-in dashboard that provides an overview of the system’s current operational metrics, the ability to apply updates, change some system settings, and access local Jupyter Notebooks.
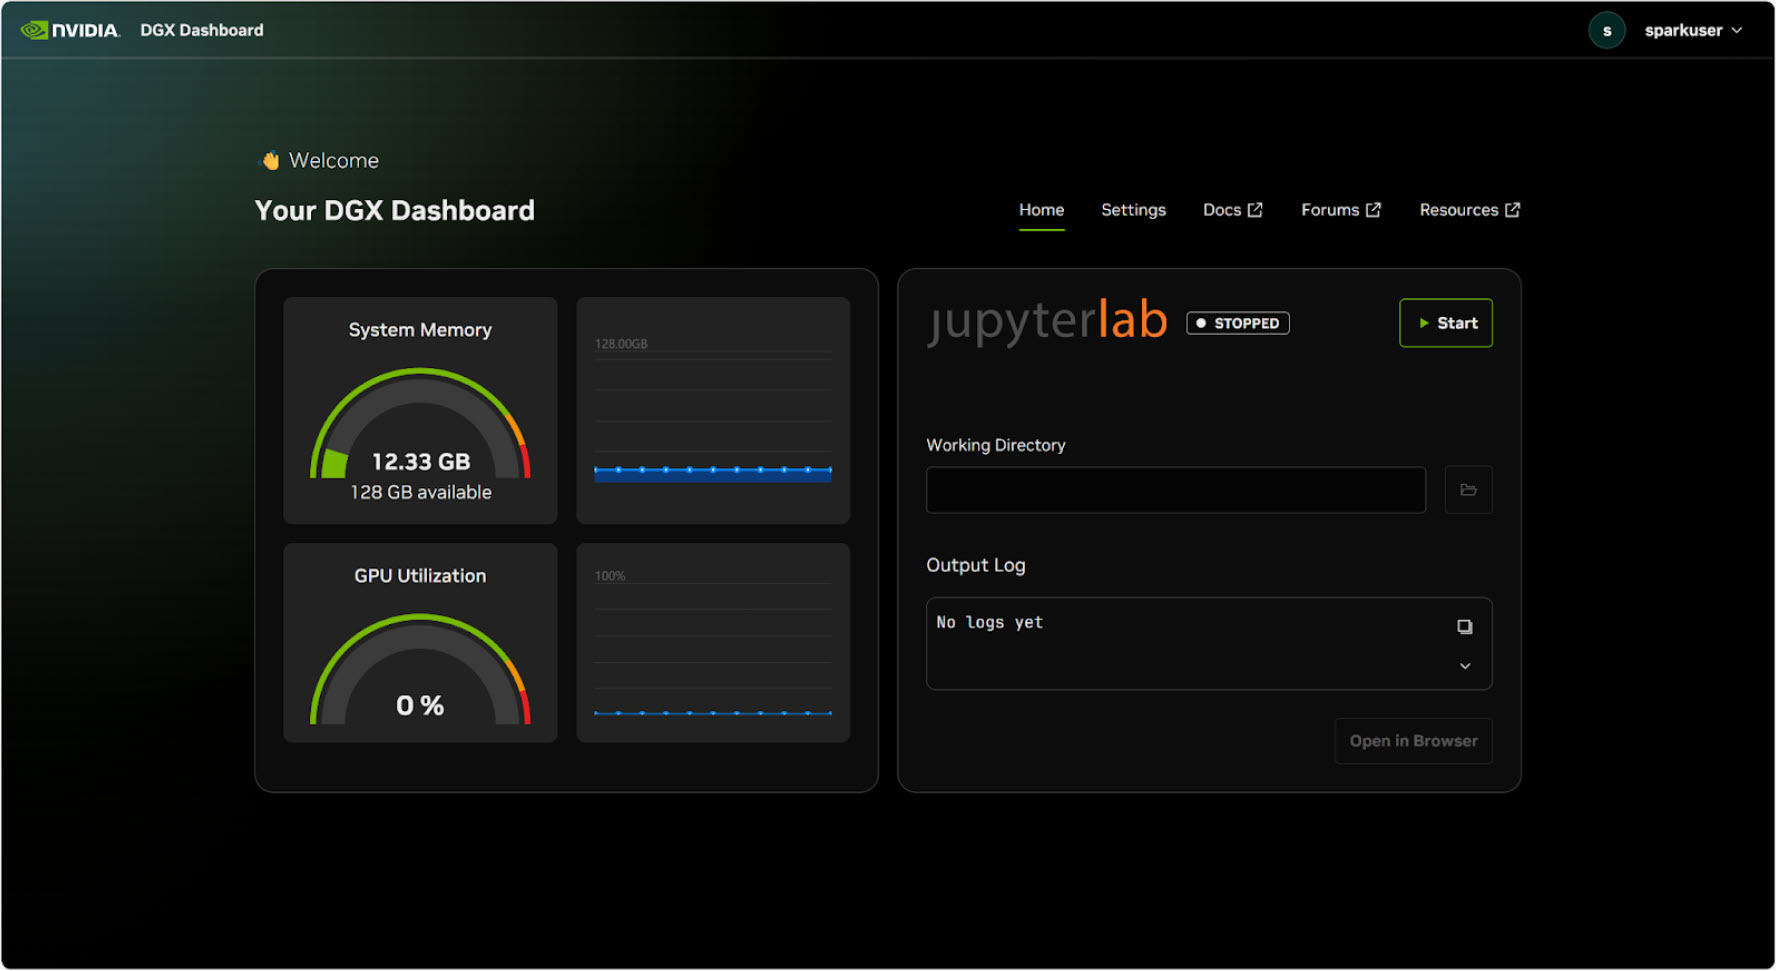
The DGX Dashboard provides real-time system monitoring and integrated JupyterLab access#
Note
To run updates and change the device name, you must have sudo access. The account created during initial setup will have access.
Integrated JupyterLab#
The dashboard includes an integrated JupyterLab instance that provides a convenient development environment:
When started, JupyterLab creates a virtual environment in the specified working directory and automatically installs a set of recommended packages
If you enter a new working directory and start JupyterLab, a new environment will be created
Each user account on the device is assigned a port located in
/opt/nvidia/dgx-dashboard-service/jupyterlab_ports.yamlTo access JupyterLab remotely, you must tunnel it just like the dashboard itself. The port to tunnel is in the ports file. Using NVIDIA Sync, this tunnel is managed for you automatically and just works
Accessing the Dashboard#
The dashboard can be accessed locally by clicking on the “Show Apps” button in the bottom left corner of the Ubuntu desktop. Then, in the app grid, select the “DGX Dashboard” shortcut to open the dashboard in your default web browser.
Remotely, the dashboard can be accessed using NVIDIA Sync or through a manually created SSH tunnel. If using NVIDIA Sync, after connecting, simply click on the “DGX Dashboard” button and the dashboard will open in your default web browser at http://localhost:11000.
To manually access over SSH, first open a tunnel, e.g., ssh -L 11000:localhost:11000 <username>@<IP or spark-abcd.local>. Then, open the dashboard in your web browser at http://localhost:11000.