DOCA P4 Developer Tools
This section descries the NVIDIA DOCA P4 Developer Tools, used to inspect and debug P4 programs that have been loaded to the NVIDIA® BlueField®.
Developers that develop P4 (Programming Protocol-independent Packet Processors) applications require tools to validate and debug their work.
NVIDIA P4 contains the following developer tools:
P4nspect
P4Debugger
The developer tools interact with a P4 program running on BlueField.
This technical document outlines the usage and options available in the P4 developer tools, including commands, options, and their descriptions.
The P4 Agent (
nvp4agent) daemon must be up and running on BlueField (which is the host machine). Thenvp4agentloads thep4nspect-serverrequired by the tools.Compiling the P4 program using NVIDIA's P4 Compiler with debug enabled (
nvp4c -g).Loading the nvp4c compilation output to the
nvp4agent.InfoFor more, refer to section Compiling P4 Applications.
The tools provided are packed in a single python wheel package (e.g., p4devtools-1.0.whl).
Installing the package requires pip and can be done easily using:
pip install p4devtools-1.0.whl
After installation the tools will be available through the p4nspect and p4debugger commands in the python environment.
P4Nspect is a Command-Line Interface (CLI) with many use cases, some of which are:
Viewing the dynamic state of a P4 program components - tables, entries, keys and actions, counters and values.
Recording of a debug session and generating an archive that can be opened by the P4Debugger.
Dumping the state of a P4 program to an archive for offline analysis.
Running p4nspect with no additional arguments will show the basic usage of the CLI tool.
To see a more detailed usage use the -h/--help argument, this argument is also used to get detailed usage of commands. e.g, p4nspect [command] -h
Running commands requires a connection to the local/remote host where p4nspect-server is running, the address host and port are configurable and are 127.0.0.1:9560 by default.
The executed command's output format varies between executed commands and can sometimes be modified by providing additional arguments.
A common use case for modifying a command output is to be able use it as part of some automatic scripting.
The P4nspect offers various commands for interacting with the P4 program and BlueField:
system-info– Displays BlueField system information, including HW Model, OS name and version, OFED version. Retrieve information regarding the system specifications such as the OS version, OFED version, etc.devices– Display information about all the configured devices on BlueField: ID, name, virtual devices, loaded P4 program name, etc.
Software abstractions representing real or emulated hardware devices. They provide a standardized interface for applications to interact with BlueField's resources, regardless of underlying physical hardware.
Examples include:
Virtual Network Interfaces (VNIs) – Logical representations of physical NICs, allowing multiple virtual networks to share a single physical interface
Virtual Processing Units (VPUs) – Software-defined processing units within BlueField that can be allocated to applications for tasks like packet processing or security offloading
Virtual Storage Devices – Software-defined representations of physical storage, offering flexibility in managing and allocating storage resources
counters– Display P4 counters details and values. The details included are the table, offset and value.tables– Lists tables of P4 programs loaded on BlueField. each table will detail its keys, actions, counters and a reference to its (program’s) source locationquery– Lists P4 table entries, keys, and actions with the priority of each set of keys.graph– Displays a graph of the P4 pipeline using DOT language. This graph can be graphically rendered using DOT renderers.hw-steering– Displays HW Steering rules dump.debug– Starts a debug session.
Help Flags
To display details of p4nspect options usage:
help,-h,--help– Displays the help message and exits.
Output Control Flags
The following flags are optional and can be used independently:
-ll,--low-level– Display low level internal information (DOCA HAL Implementation) . (default: False)-ni,--non-interactive– Disable interactive output mode. (default: False).Interactive output mode dumps chunks of the output just as Linux's
less, designed for easier analysis of the output.Disabling may be required when running
p4nspectcommands from an automated script.-nh,--no-hints– Disable hints for further information.--csv– Set command output to use CSV format. (default: False)--json– Set command output to use JSON format. (default: False)p4nspect counterscommand specific:--top-packets TOP_PACKETS– ShowTOP_PACKETSentries with the highest counter packets values (default: None)--top-bytes TOP_BYTES– ShowTOP_PACKETSentries with the highest counter bytes values (default: None)
p4nspect graphcommand specific:--url– Encode the output as a URL that can be directly pasted in a web browser. This is useful for quick rendering using online render websites (default: False).--parser– Display a graph of the P4 pipeline or the Flex Parser (default: False)
Filter Control Flags
-d DEVICE_IDS,--device_ids DEVICE_IDS– Specifies a comma separated list of device ID's to be used, e.g. 1000,2000. Retrieves data for all devices if not specified. (default: None)--table_ids TABLE_IDS– Specify which table IDs to filter by. (default: [])--table_names TABLE_NAMES– Specify which table names to filter by (default: [])--counter-names COUNTER_NAMES– Specify which counter names to filter by (default: [])--indices INDICES– Specify which entries indices to filter by (default: [])
Control Flags for Connecting to BlueField
-a ADDRESS,--address ADDRESS–Specifies the
p4nspect-serversocket address of the form IPv4/IPv6*[address][:port]IPv6*: To use with a port the address must be enclosed in literal square brackets.
Example:
ipv6:[2607:f8b0:400e:c00::ef]:443oripv6:[::]:1234Not specifying an address/port will result in using the default address and port. (default: `127.0.0.1:9560`)
--timeout TIMEOUT– [Optional] Connectivity timeout. (default: 0)
Misc Flags
--version,-V– Displays the program's version number and exits.
System-info
p4nspect system-info
DESCRIPTION | VALUE |
DOCA HAL version | TODO |
Linux OS version | Ubuntu 22.04 LTS |
OFED Version | MLNX_OFED_LINUX-24.01-0.1.7.0: |
P4 Agent version | TODO |
Devices
p4nspect devices
ID | NAME | PCI ADDRESS | PORT ID | NAME | NUMBER | P4 PROGRAM | FW VERSION | HW MODEL |
1000 | br9 | 0000:65:00.0 | 0 | enp101s0f0np0 | 50 | alpha2_d2 | 32.38.0588 | BlueField-3 integrated ConnectX-7 network controller |
4 | eth3 | 5 | ||||||
1 | eth0 | 2 | ||||||
2 | eth1 | 3 | ||||||
3 | eth2 | 4 |
Counters
p4nspect counters
DEVICE: 1000, NV_COUNTER: alpha2_drop2.decap.decap_counter, SCOPE: alpha2_drop2, TYPE: Pkts/Bts, SIZE: 4, IN USE: 3 | |||
IDX | P4 | ENTRY OFFSET | VALUE |
0 |
| 1 | (2, 140) |
1 |
| 2 | (0, 0) |
2 |
| 0 | (0, 0) |
DEVICE: 1000, NV_COUNTER: alpha2_drop2.encap.encap_counter, SCOPE: alpha2_drop2, TYPE: Pkts/Bts, SIZE: 4, IN USE: 3 | |||
IDX | P4 | ENTRY OFFSET | VALUE |
0 |
| 0 | (0, 0) |
1 |
| 2 | (0, 0) |
2 |
| 1 | (0, 0) |
DEVICE: 1000, NV_DIRECT_COUNTER: alpha2_drop2.gtp.gtp_counter, SCOPE: alpha2_drop2, TYPE: Pkts/Bts, SIZE: 128, IN USE: 3 | |||
IDX | P4 | ENTRY OFFSET | VALUE |
0 |
| 2 | (0, 0) |
1 |
| 1 | (0, 0) |
2 |
| 0 | (0, 0) |
The value is in the following format: (number of packets, number of bytes)
Tables
p4nspect tables
DEVICE: 1000 | ||||||
ID | TABLE | KEYS | ACTIONS | COUNTER | ENTRIES | SOURCE |
44963766 |
|
|
NoAction | 4 |
| |
41521446 |
|
|
NoAction | 4 |
| |
34318161 |
|
|
|
| 3 |
|
Query
p4nspect query
DEVICE: 1000, TABLE: alpha2_drop2.gtp.gtp_table, ID: 34318161, SOURCE: alpha2_d2.p4:102 | |||||
PRIO | P4 KEY | VALUE | MASK | TYPE | P4 ACTION |
0 |
| 0x0 0x1 | exact exact |
| |
0 |
| 0x1 0x1 | exact exact |
| |
0 |
|
| |||
DEVICE: 1000, TABLE: alpha2_drop2.encap.encap_table, ID: 41521446, SOURCE: alpha2_d2.p4:173 | |||||
PRIO | P4 KEY | VALUE | MASK | TYPE | P4 ACTION |
3 |
| 0x0 0x10000000 | 0xff000000 | exact ternary |
|
2 |
| 0x0 0x20000000 | 0xff000000 | exact ternary |
|
1 |
| 0x0 0x20000000 | 0xff000000 | exact ternary |
|
0 |
|
| |||
DEVICE: 1000, TABLE: alpha2_drop2.decap.decap_table, ID: 44963766, SOURCE: alpha2_d2.p4:235 | |||||
PRIO | P4 KEY | VALUE | MASK | TYPE | P4 ACTION |
0 |
| 0x3 0x0 0x1 | exact exact exact |
| |
0 |
| 0x4 0x0 0x0 | exact exact exact |
| |
0 |
| 0x2 0x1 0x0 | exact exact exact |
| |
0 |
|
| |||
Different Output Option Flags
--cvsp4nspect --csv tables
"DEVICE: 1000""ID","TABLE","KEYS","ACTIONS","COUNTER","ENTRIES","SOURCE""44963766","alpha2_drop2.decap.decap_table","std_meta.ingress_port headers.gre.$valid$ headers.vxlan.$valid$","alpha2_drop2.decap.send_to_port alpha2_drop2.decap.decap_gre alpha2_drop2.decap.decap_vxlan NoAction","","4","alpha2_d2.p4:235""41521446","alpha2_drop2.encap.encap_table","std_meta.ingress_port headers.ipv4.src_addr","alpha2_drop2.encap.send_to_port alpha2_drop2.encap.encap_gre alpha2_drop2.encap.encap_vxlan NoAction","","4","alpha2_d2.p4:173""34318161","alpha2_drop2.gtp.gtp_table","std_meta.ingress_port headers.gtpv1.teid","alpha2_drop2.gtp.send_to_port alpha2_drop2.gtp.drop","alpha2_drop2.gtp.gtp_counter","3","alpha2_d2.p4:102"--jsonp4nspect --json tables
[ [ {
"DEVICE":1000}, {"ID":44963766,"TABLE":"alpha2_drop2.decap.decap_table","KEYS": ["std_meta.ingress_port","headers.gre.$valid$","headers.vxlan.$valid$"],"ACTIONS": ["alpha2_drop2.decap.send_to_port","alpha2_drop2.decap.decap_gre","alpha2_drop2.decap.decap_vxlan","NoAction"],"COUNTER":"","ENTRIES":4,"SOURCE": {"filename":"/tmp/p4src/alpha2_d2.p4","line":235,"column":11} }, {"ID":41521446,"TABLE":"alpha2_drop2.encap.encap_table","KEYS": ["std_meta.ingress_port","headers.ipv4.src_addr"],"ACTIONS": ["alpha2_drop2.encap.send_to_port","alpha2_drop2.encap.encap_gre","alpha2_drop2.encap.encap_vxlan","NoAction"],"COUNTER":"","ENTRIES":4,"SOURCE": {"filename":"/tmp/p4src/alpha2_d2.p4","line":173,"column":11} }, {"ID":34318161,"TABLE":"alpha2_drop2.gtp.gtp_table","KEYS": ["std_meta.ingress_port","headers.gtpv1.teid"],"ACTIONS": ["alpha2_drop2.gtp.send_to_port","alpha2_drop2.gtp.drop"],"COUNTER":"alpha2_drop2.gtp.gtp_counter","ENTRIES":3,"SOURCE": {"filename":"/tmp/p4src/alpha2_d2.p4","line":102,"column":11} } ] ]
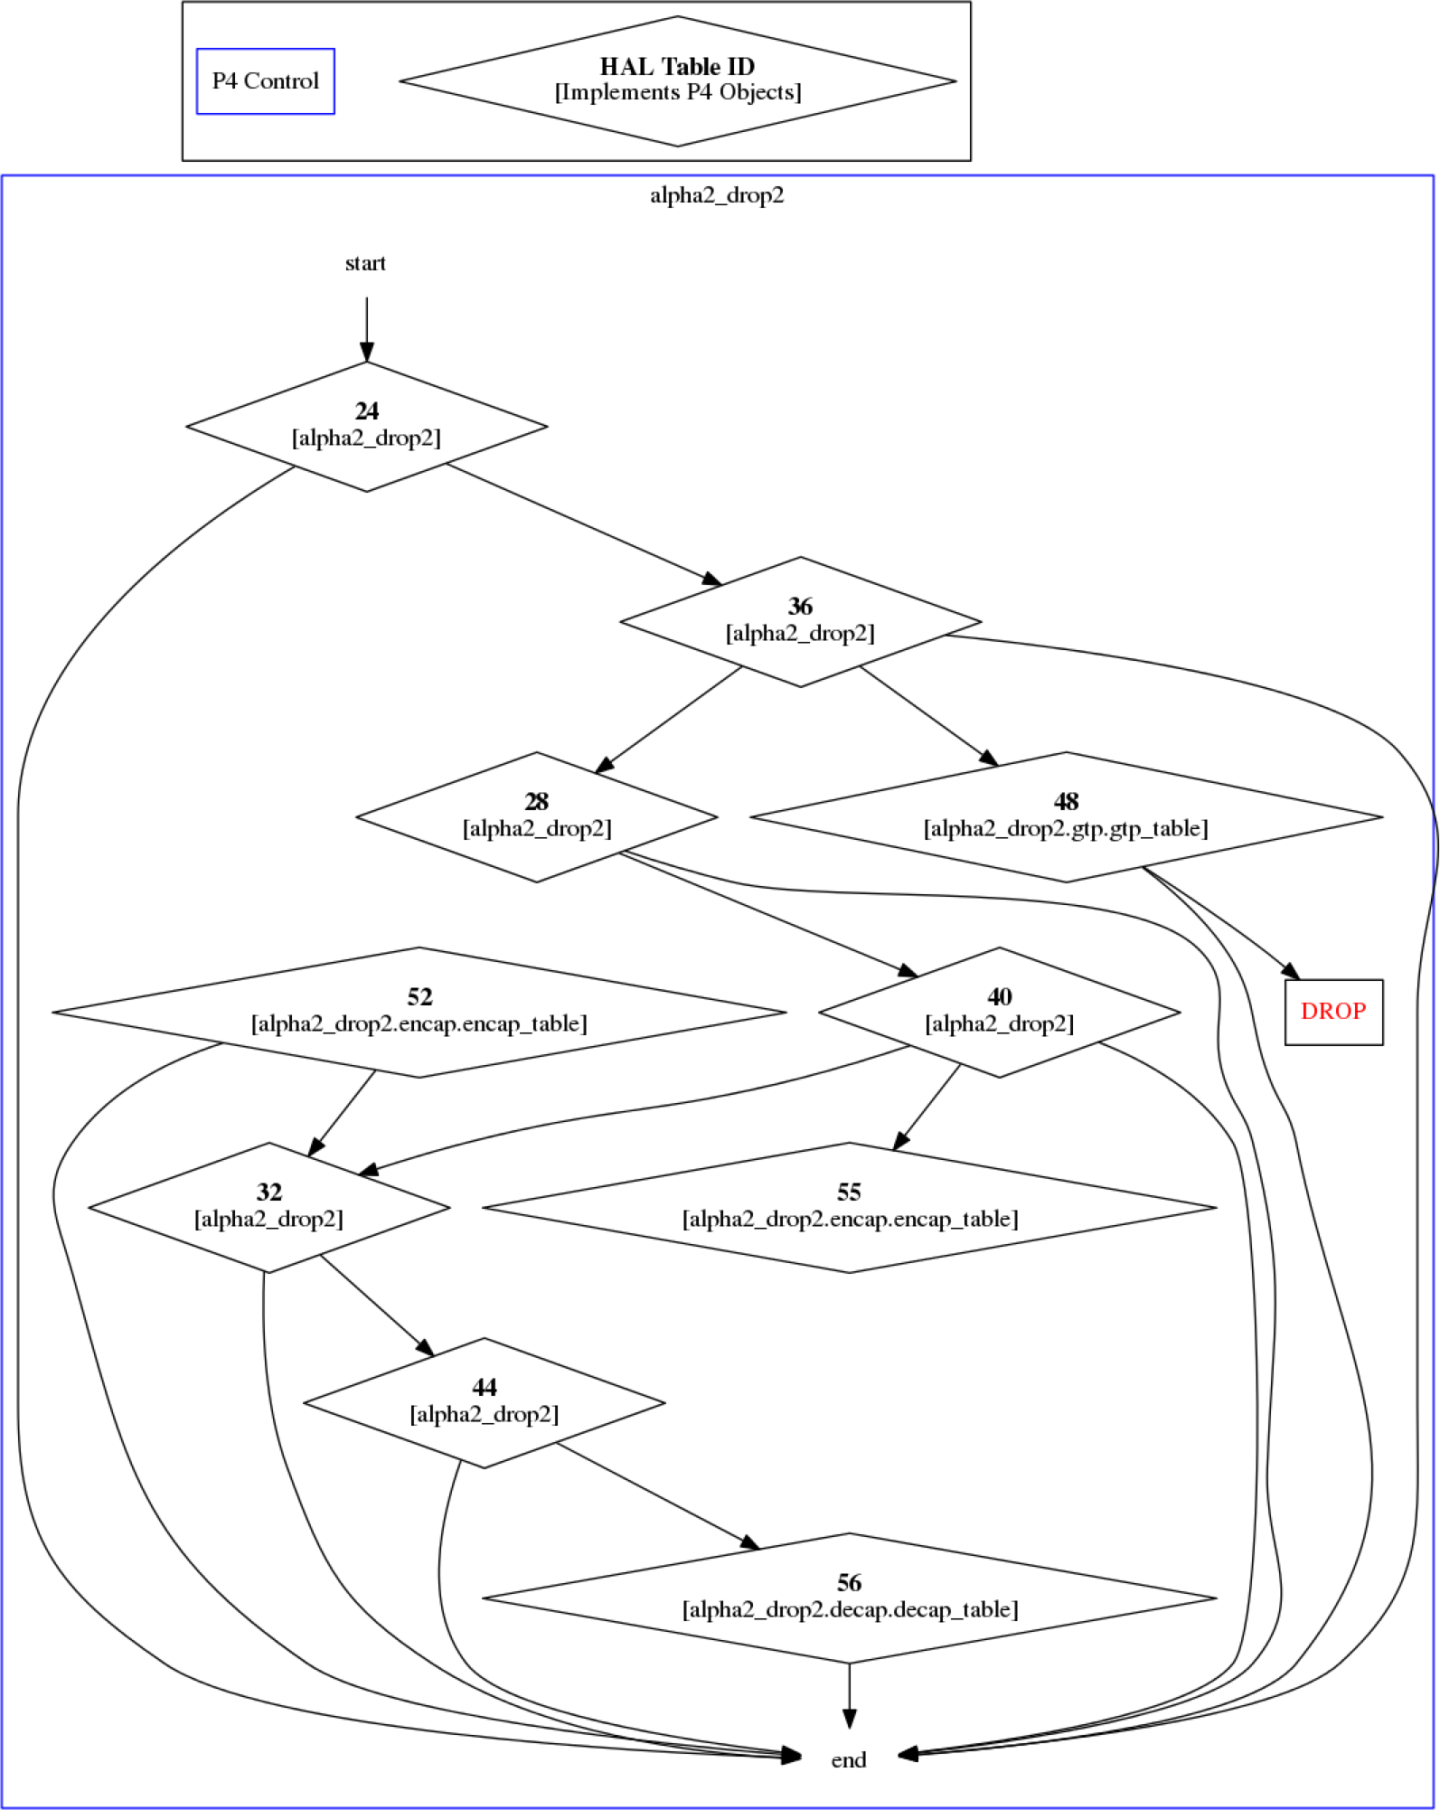
Graph (requires the --low-level flag)
No extra flags
p4nspect -ll graph
Device
1000: digraph hybrid_pipeline { graph [compound=true]// Legendsubgraph cluster_legend { hal_table [label=<<B>HAL Table ID</B><BR/>[Implements P4 Objects]> shape=diamond] legend_invis [label=legend_invis shape=point style=invis width=0] p4_control [label="P4 Control"color=blue shape=rectangle] } alpha2_drop2_start [label=start color=green shape=none] legend_invis -> alpha2_drop2_start [style=invis]// Pipeline Stage: mainsubgraph cluster_alpha2_drop2 { graph [color=blue label=alpha2_drop2 shape=rectangle]24[label=<<B>24</B><BR/>[alpha2_drop2]> shape=diamond] alpha2_drop2_start ->2448[label=<<B>48</B><BR/>[alpha2_drop2.gtp.gtp_table]> shape=diamond] DROP [label=DROP fontcolor=red shape=box]48-> DROP alpha2_drop2_end [label=end color=red shape=none]48-> alpha2_drop2_end36[label=<<B>36</B><BR/>[alpha2_drop2]> shape=diamond]36->4856[label=<<B>56</B><BR/>[alpha2_drop2.decap.decap_table]> shape=diamond]56-> alpha2_drop2_end44[label=<<B>44</B><BR/>[alpha2_drop2]> shape=diamond]44->5644-> alpha2_drop2_end32[label=<<B>32</B><BR/>[alpha2_drop2]> shape=diamond]32->4432-> alpha2_drop2_end52[label=<<B>52</B><BR/>[alpha2_drop2.encap.encap_table]> shape=diamond]52->3252-> alpha2_drop2_end40[label=<<B>40</B><BR/>[alpha2_drop2]> shape=diamond]55[label=<<B>55</B><BR/>[alpha2_drop2.encap.encap_table]> shape=diamond]40->5540->3240-> alpha2_drop2_end28[label=<<B>28</B><BR/>[alpha2_drop2]> shape=diamond]28->4028-> alpha2_drop2_end36->2836-> alpha2_drop2_end24->3624-> alpha2_drop2_end } }--url– generates an HTTP URL link to the program's control flow graph, in dot format, rendered using https://dreampuf.github.io/GraphvizOnline/.p4nspect -ll graph --url

--parser– generates output of the program's parser graph in dot formatp4nspect -ll graph --parser
Device
1000:// Parser packet_parserdigraph packet_parser { graph [concentrate=truesplines=compound]// Legendsubgraph cluster_legend { fixed_state [label="Fixed State"style=filled] legend_invis [label=legend_invis shape=point style=invis width=0] flex_state [label="Flex State"] default_transition_note [label="All states have an hidden transition to accept\nEdges are annotated with their match value."shape=none] legend_invis -> default_transition_note [style=invis] } start [label=start color=green shape=point] default_transition_note -> start [style=invis] nv_parse_ethernet [label=ethernet id=nv_parse_ethernet style=filled] start -> nv_parse_ethernet nv_parse_vlan [label=vlan id=nv_parse_vlan style=filled] nv_parse_ethernet -> nv_parse_vlan [label="0x8100"color=gray id="nv_parse_ethernet-nv_parse_vlan"] nv_parse_ipv4 [label=ipv4 id=nv_parse_ipv4 style=filled] nv_parse_ethernet -> nv_parse_ipv4 [label="0x800"color=gray id="nv_parse_ethernet-nv_parse_ipv4"] nv_parse_ipv6 [label=ipv6 id=nv_parse_ipv6 style=filled] nv_parse_ethernet -> nv_parse_ipv6 [label="0x86dd"color=gray id="nv_parse_ethernet-nv_parse_ipv6"] nv_parse_mpls [label=mpls id=nv_parse_mpls style=filled] nv_parse_ethernet -> nv_parse_mpls [label="0x8847"color=gray id="nv_parse_ethernet-nv_parse_mpls"] nv_parse_geneve [label=geneve id=nv_parse_geneve style=filled] nv_parse_inner_ipv4 [label=inner_ipv4 id=nv_parse_inner_ipv4 style=filled] nv_parse_geneve -> nv_parse_inner_ipv4 [label="0x800"color=gray id="nv_parse_geneve-nv_parse_inner_ipv4"] nv_parse_inner_ipv6 [label=inner_ipv6 id=nv_parse_inner_ipv6 style=filled] nv_parse_geneve -> nv_parse_inner_ipv6 [label="0x86dd"color=gray id="nv_parse_geneve-nv_parse_inner_ipv6"] nv_parse_inner_mpls [label=inner_mpls id=nv_parse_inner_mpls style=filled] nv_parse_geneve -> nv_parse_inner_mpls [label="0x8847"color=gray id="nv_parse_geneve-nv_parse_inner_mpls"] nv_parse_inner_ethernet [label=inner_ethernet id=nv_parse_inner_ethernet style=filled] nv_parse_geneve -> nv_parse_inner_ethernet [label="0x6558"color=gray id="nv_parse_geneve-nv_parse_inner_ethernet"] nv_parse_gre [label=gre id=nv_parse_gre style=filled] nv_parse_gre -> nv_parse_inner_ipv4 [label="0x800"color=gray id="nv_parse_gre-nv_parse_inner_ipv4"] nv_parse_gre -> nv_parse_inner_ipv6 [label="0x86dd"color=gray id="nv_parse_gre-nv_parse_inner_ipv6"] nv_parse_gre -> nv_parse_inner_mpls [label="0x8847"color=gray id="nv_parse_gre-nv_parse_inner_mpls"] nv_parse_nvgre_vsid [label=nvgre_vsid id=nv_parse_nvgre_vsid style=filled] nv_parse_gre -> nv_parse_nvgre_vsid [label="0x6558"color=gray id="nv_parse_gre-nv_parse_nvgre_vsid"] nv_parse_icmp [label=icmp id=nv_parse_icmp style=filled] nv_parse_icmpv6 [label=icmpv6 id=nv_parse_icmpv6 style=filled] nv_parse_inner_vlan [label=inner_vlan id=nv_parse_inner_vlan style=filled] nv_parse_inner_ethernet -> nv_parse_inner_vlan [label="0x8100"color=gray id="nv_parse_inner_ethernet-nv_parse_inner_vlan"] nv_parse_inner_ethernet -> nv_parse_inner_ipv4 [label="0x800"color=gray id="nv_parse_inner_ethernet-nv_parse_inner_ipv4"] nv_parse_inner_ethernet -> nv_parse_inner_ipv6 [label="0x86dd"color=gray id="nv_parse_inner_ethernet-nv_parse_inner_ipv6"] nv_parse_inner_ethernet -> nv_parse_inner_mpls [label="0x8847"color=gray id="nv_parse_inner_ethernet-nv_parse_inner_mpls"] nv_parse_inner_icmp [label=inner_icmp id=nv_parse_inner_icmp style=filled] nv_parse_inner_icmpv6 [label=inner_icmpv6 id=nv_parse_inner_icmpv6 style=filled] nv_parse_inner_ipv4 -> nv_parse_inner_icmp [label="0x1"color=gray id="nv_parse_inner_ipv4-nv_parse_inner_icmp"] nv_parse_inner_tcp [label=inner_tcp id=nv_parse_inner_tcp style=filled] nv_parse_inner_ipv4 -> nv_parse_inner_tcp [label="0x6"color=gray id="nv_parse_inner_ipv4-nv_parse_inner_tcp"] nv_parse_inner_udp [label=inner_udp id=nv_parse_inner_udp style=filled] nv_parse_inner_ipv4 -> nv_parse_inner_udp [label="0x11"color=gray id="nv_parse_inner_ipv4-nv_parse_inner_udp"] nv_parse_inner_ipv6 -> nv_parse_inner_icmpv6 [label="0x3a"color=gray id="nv_parse_inner_ipv6-nv_parse_inner_icmpv6"] nv_parse_inner_ipv6 -> nv_parse_inner_tcp [label="0x6"color=gray id="nv_parse_inner_ipv6-nv_parse_inner_tcp"] nv_parse_inner_ipv6 -> nv_parse_inner_udp [label="0x11"color=gray id="nv_parse_inner_ipv6-nv_parse_inner_udp"] nv_parse_inner_mpls1 [label=inner_mpls1 id=nv_parse_inner_mpls1 style=filled] nv_parse_inner_mpls -> nv_parse_inner_mpls1 [label="0x0"color=gray id="nv_parse_inner_mpls-nv_parse_inner_mpls1"] nv_parse_inner_mpls_next_header [label=nv_parse_inner_mpls_next_header id=nv_parse_inner_mpls_next_header style=filled] nv_parse_inner_mpls -> nv_parse_inner_mpls_next_header [label="0x1"color=gray id="nv_parse_inner_mpls-nv_parse_inner_mpls_next_header"] nv_parse_inner_mpls2 [label=inner_mpls2 id=nv_parse_inner_mpls2 style=filled] nv_parse_inner_mpls1 -> nv_parse_inner_mpls2 [label="0x0"color=gray id="nv_parse_inner_mpls1-nv_parse_inner_mpls2"] nv_parse_inner_mpls1 -> nv_parse_inner_mpls_next_header [label="0x1"color=gray id="nv_parse_inner_mpls1-nv_parse_inner_mpls_next_header"] nv_parse_inner_mpls3 [label=inner_mpls3 id=nv_parse_inner_mpls3 style=filled] nv_parse_inner_mpls2 -> nv_parse_inner_mpls3 [label="0x0"color=gray id="nv_parse_inner_mpls2-nv_parse_inner_mpls3"] nv_parse_inner_mpls2 -> nv_parse_inner_mpls_next_header [label="0x1"color=gray id="nv_parse_inner_mpls2-nv_parse_inner_mpls_next_header"] nv_parse_inner_mpls4 [label=inner_mpls4 id=nv_parse_inner_mpls4 style=filled] nv_parse_inner_mpls3 -> nv_parse_inner_mpls4 [label="0x0"color=gray id="nv_parse_inner_mpls3-nv_parse_inner_mpls4"] nv_parse_inner_mpls3 -> nv_parse_inner_mpls_next_header [label="0x1"color=gray id="nv_parse_inner_mpls3-nv_parse_inner_mpls_next_header"] nv_parse_inner_mpls4 -> nv_parse_inner_mpls_next_header [label="0x1"color=gray id="nv_parse_inner_mpls4-nv_parse_inner_mpls_next_header"] nv_parse_inner_mpls_next_header -> nv_parse_inner_ipv4 [label="0x4"color=gray id="nv_parse_inner_mpls_next_header-nv_parse_inner_ipv4"] nv_parse_inner_mpls_next_header -> nv_parse_inner_ipv6 [label="0x6"color=gray id="nv_parse_inner_mpls_next_header-nv_parse_inner_ipv6"] nv_parse_inner_vlan -> nv_parse_inner_ipv4 [label="0x800"color=gray id="nv_parse_inner_vlan-nv_parse_inner_ipv4"] nv_parse_inner_vlan -> nv_parse_inner_ipv6 [label="0x86dd"color=gray id="nv_parse_inner_vlan-nv_parse_inner_ipv6"] nv_parse_inner_vlan -> nv_parse_inner_mpls [label="0x8847"color=gray id="nv_parse_inner_vlan-nv_parse_inner_mpls"] nv_parse_ipsec_esp [label=esp id=nv_parse_ipsec_esp style=filled] nv_parse_ipv4 -> nv_parse_inner_ipv4 [label="0x4"color=gray id="nv_parse_ipv4-nv_parse_inner_ipv4"] nv_parse_ipv4 -> nv_parse_inner_ipv6 [label="0x29"color=gray id="nv_parse_ipv4-nv_parse_inner_ipv6"] nv_parse_ipv4 -> nv_parse_icmp [label="0x1"color=gray id="nv_parse_ipv4-nv_parse_icmp"] nv_parse_tcp [label=tcp id=nv_parse_tcp style=filled] nv_parse_ipv4 -> nv_parse_tcp [label="0x6"color=gray id="nv_parse_ipv4-nv_parse_tcp"] nv_parse_udp [label=udp id=nv_parse_udp style=filled] nv_parse_ipv4 -> nv_parse_udp [label="0x11"color=gray id="nv_parse_ipv4-nv_parse_udp"] nv_parse_ipv4 -> nv_parse_gre [label="0x2f"color=gray id="nv_parse_ipv4-nv_parse_gre"] nv_parse_ipv4 -> nv_parse_ipsec_esp [label="0x32"color=gray id="nv_parse_ipv4-nv_parse_ipsec_esp"] nv_parse_ipv6 -> nv_parse_inner_ipv4 [label="0x4"color=gray id="nv_parse_ipv6-nv_parse_inner_ipv4"] nv_parse_ipv6 -> nv_parse_inner_ipv6 [label="0x29"color=gray id="nv_parse_ipv6-nv_parse_inner_ipv6"] nv_parse_ipv6 -> nv_parse_icmpv6 [label="0x3a"color=gray id="nv_parse_ipv6-nv_parse_icmpv6"] nv_parse_ipv6 -> nv_parse_tcp [label="0x6"color=gray id="nv_parse_ipv6-nv_parse_tcp"] nv_parse_ipv6 -> nv_parse_udp [label="0x11"color=gray id="nv_parse_ipv6-nv_parse_udp"] nv_parse_ipv6 -> nv_parse_gre [label="0x2f"color=gray id="nv_parse_ipv6-nv_parse_gre"] nv_parse_ipv6 -> nv_parse_ipsec_esp [label="0x32"color=gray id="nv_parse_ipv6-nv_parse_ipsec_esp"] nv_parse_mpls1 [label=mpls1 id=nv_parse_mpls1 style=filled] nv_parse_mpls -> nv_parse_mpls1 [label="0x0"color=gray id="nv_parse_mpls-nv_parse_mpls1"] nv_parse_mpls_next_header [label=nv_parse_mpls_next_header id=nv_parse_mpls_next_header style=filled] nv_parse_mpls -> nv_parse_mpls_next_header [label="0x1"color=gray id="nv_parse_mpls-nv_parse_mpls_next_header"] nv_parse_mpls2 [label=mpls2 id=nv_parse_mpls2 style=filled] nv_parse_mpls1 -> nv_parse_mpls2 [label="0x0"color=gray id="nv_parse_mpls1-nv_parse_mpls2"] nv_parse_mpls1 -> nv_parse_mpls_next_header [label="0x1"color=gray id="nv_parse_mpls1-nv_parse_mpls_next_header"] nv_parse_mpls3 [label=mpls3 id=nv_parse_mpls3 style=filled] nv_parse_mpls2 -> nv_parse_mpls3 [label="0x0"color=gray id="nv_parse_mpls2-nv_parse_mpls3"] nv_parse_mpls2 -> nv_parse_mpls_next_header [label="0x1"color=gray id="nv_parse_mpls2-nv_parse_mpls_next_header"] nv_parse_mpls4 [label=mpls4 id=nv_parse_mpls4 style=filled] nv_parse_mpls3 -> nv_parse_mpls4 [label="0x0"color=gray id="nv_parse_mpls3-nv_parse_mpls4"] nv_parse_mpls3 -> nv_parse_mpls_next_header [label="0x1"color=gray id="nv_parse_mpls3-nv_parse_mpls_next_header"] nv_parse_mpls4 -> nv_parse_mpls_next_header [label="0x1"color=gray id="nv_parse_mpls4-nv_parse_mpls_next_header"] nv_parse_mpls_next_header -> nv_parse_ipv4 [label="0x4"color=gray id="nv_parse_mpls_next_header-nv_parse_ipv4"] nv_parse_mpls_next_header -> nv_parse_ipv6 [label="0x6"color=gray id="nv_parse_mpls_next_header-nv_parse_ipv6"] nv_parse_nvgre_vsid -> nv_parse_inner_ethernet [label="0x0"color=gray id="nv_parse_nvgre_vsid-nv_parse_inner_ethernet"] nv_parse_psp [label=psp id=nv_parse_psp style=filled] parse_gtp [label=gtpv1 id=parse_gtp style=""] nv_parse_udp -> parse_gtp [label="0x868"color=black id="nv_parse_udp-parse_gtp"] nv_parse_vxlan [label=vxlan id=nv_parse_vxlan style=filled] nv_parse_udp -> nv_parse_vxlan [label="0x12b5"color=gray id="nv_parse_udp-nv_parse_vxlan"] nv_parse_vxlan_gpe [label=vxlan_gpe id=nv_parse_vxlan_gpe style=filled] nv_parse_udp -> nv_parse_vxlan_gpe [label="0x12b6"color=gray id="nv_parse_udp-nv_parse_vxlan_gpe"] nv_parse_udp -> nv_parse_geneve [label="0x17c1"color=gray id="nv_parse_udp-nv_parse_geneve"] nv_parse_udp -> nv_parse_inner_mpls [label="0x19eb"color=gray id="nv_parse_udp-nv_parse_inner_mpls"] nv_parse_udp -> nv_parse_ipsec_esp [label="0x1194"color=gray id="nv_parse_udp-nv_parse_ipsec_esp"] nv_parse_udp -> nv_parse_psp [label="0x3e8"color=gray id="nv_parse_udp-nv_parse_psp"] nv_parse_vlan -> nv_parse_ipv4 [label="0x800"color=gray id="nv_parse_vlan-nv_parse_ipv4"] nv_parse_vlan -> nv_parse_ipv6 [label="0x86dd"color=gray id="nv_parse_vlan-nv_parse_ipv6"] nv_parse_vlan -> nv_parse_mpls [label="0x8847"color=gray id="nv_parse_vlan-nv_parse_mpls"] nv_parse_vxlan -> nv_parse_inner_ethernet [label="0x0"color=gray id="nv_parse_vxlan-nv_parse_inner_ethernet"] nv_parse_vxlan_gpe -> nv_parse_inner_ipv4 [label="0x1"color=gray id="nv_parse_vxlan_gpe-nv_parse_inner_ipv4"] nv_parse_vxlan_gpe -> nv_parse_inner_ipv6 [label="0x2"color=gray id="nv_parse_vxlan_gpe-nv_parse_inner_ipv6"] nv_parse_vxlan_gpe -> nv_parse_inner_ethernet [label="0x3"color=gray id="nv_parse_vxlan_gpe-nv_parse_inner_ethernet"] }--url --parserp4nspect -ll graph --url --parser

Illustration
It is possible to render the graph to get the following picture:
Some of the flags are universally applicable to all of the commands, but some are applicable to only specific commands.
The following table outlines which commands and which flags relate
system-info | devices | counters | tables | query | graph | hw-steering | debug | |
--address | ✔ | ✔ | ✔ | ✔ | ✔ | ✔ | ✔ | ✔ |
--time-out | ✔ | ✔ | ✔ | ✔ | ✔ | ✔ | ✔ | ✔ |
--non-interactive | ✔ | ✔ | ✔ | ✔ | ✔ | ✔ | ✔ | ✔ |
--no-hints | ✔ | ✔ | ✔ | ✔ | ✔ | ✔ | ✔ | ✔ |
--csv | ✔ | ✔ | ✔ | ✔ | ✔ | ✔ | ✔ | ✔ |
--json | ✔ | ✔ | ✔ | ✔ | ✔ | ✔ | ✔ | ✔ |
--device-ids | ✔ | ✔ | ✔ | ✔ | ✔ | ✔ | ✔ | ✔ |
--low-level | ✔ | ✔ | ✔ | ✔ | ✔ | ✔ | ✔ | ✔ |
--table-ids | ✔ | ✔ | ✔ | |||||
--table_names | ✔ | ✔ | ✔ | |||||
--counter-names | ✔ | |||||||
--indices | ✔ | |||||||
--top-packets | ✔ | |||||||
--top-bytes | ✔ | |||||||
--url | ✔ | |||||||
--parser | ✔ | |||||||
--output-file | ✔ | |||||||
--debug-device-id | ✔ |
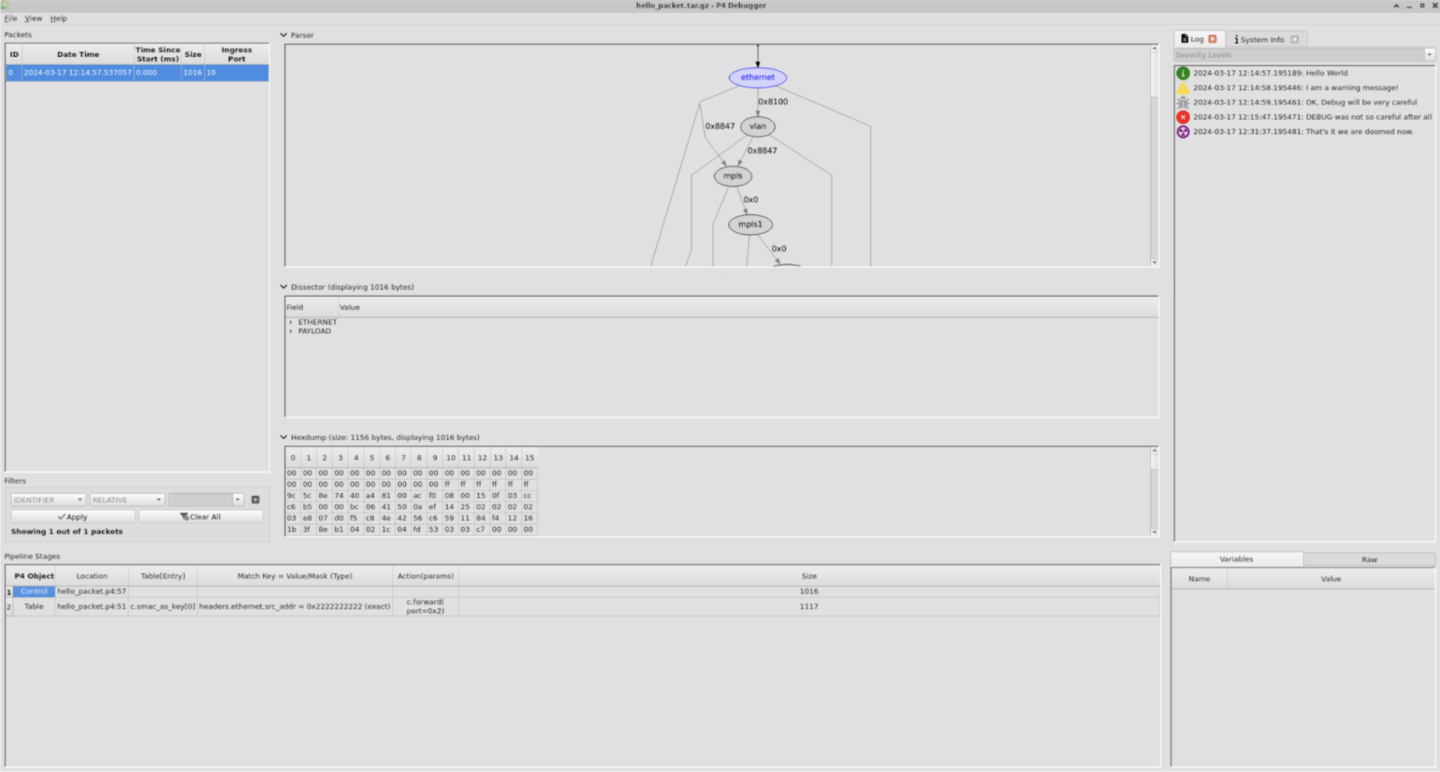
The P4Debugger is a GUI application that can run a debug session or open a pre recorded (through p4nspect debug ) debug session file.
Debug session shows the passage of traffic packets throughout a P4 program's pipeline and lets the developer trace the details of each packet's course.
Running p4debugger with no additional arguments will open the GUI application.
Opening and debugging a pre recorded debug session can be done using the File menu of by specifying the debug session file in the program execution command as follows:
p4debugger my-debug-archive.tar.gz
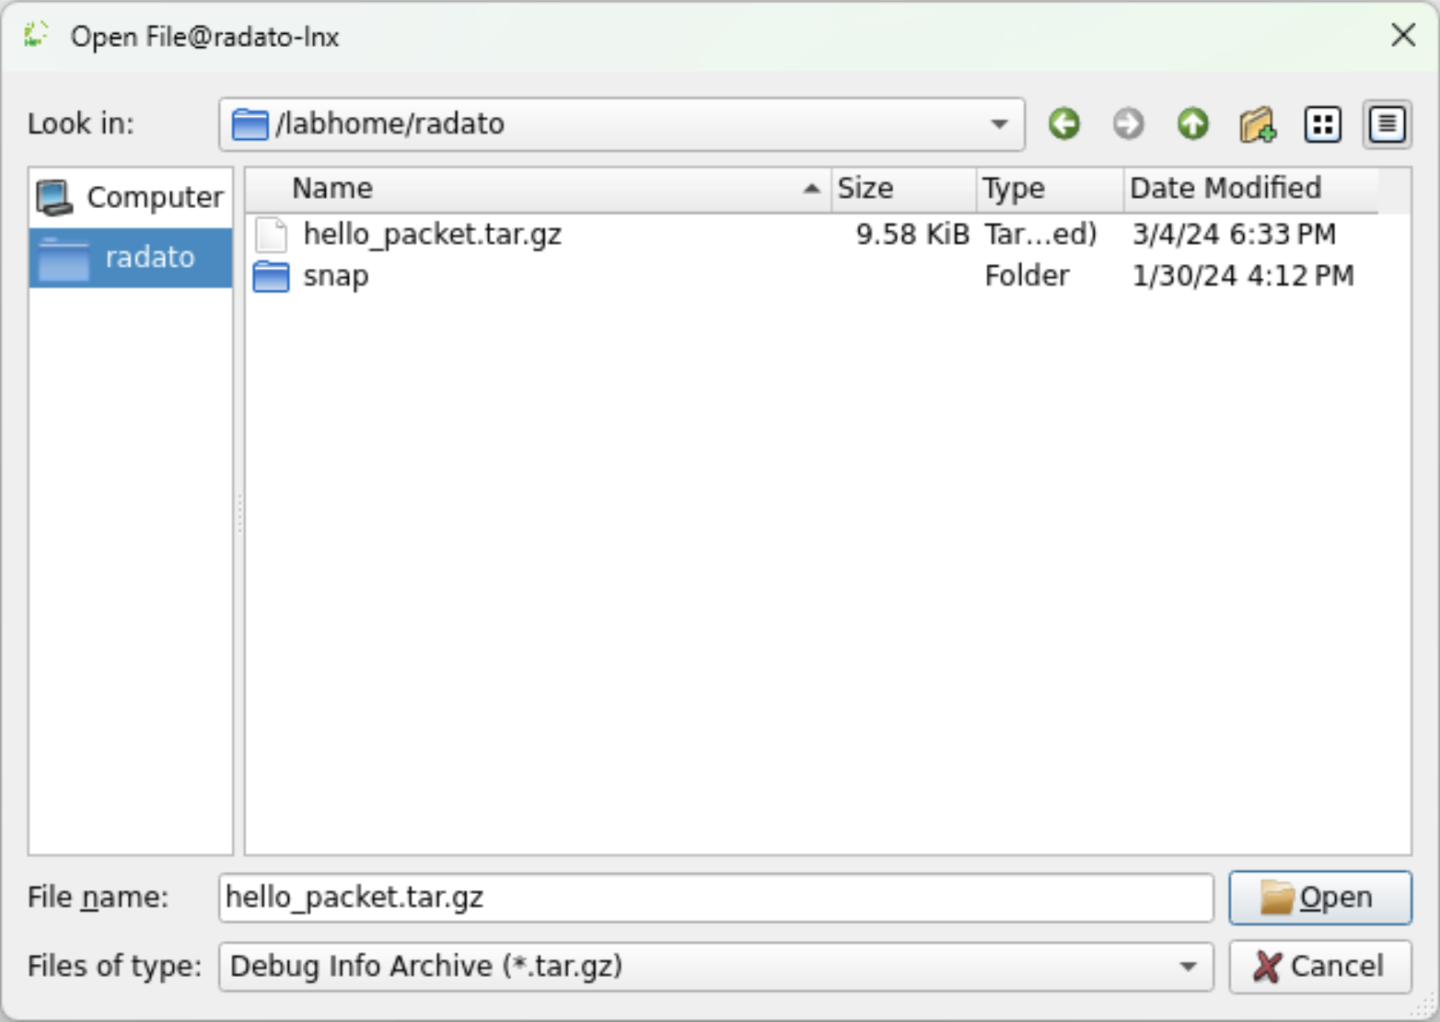
Open Debug Session File
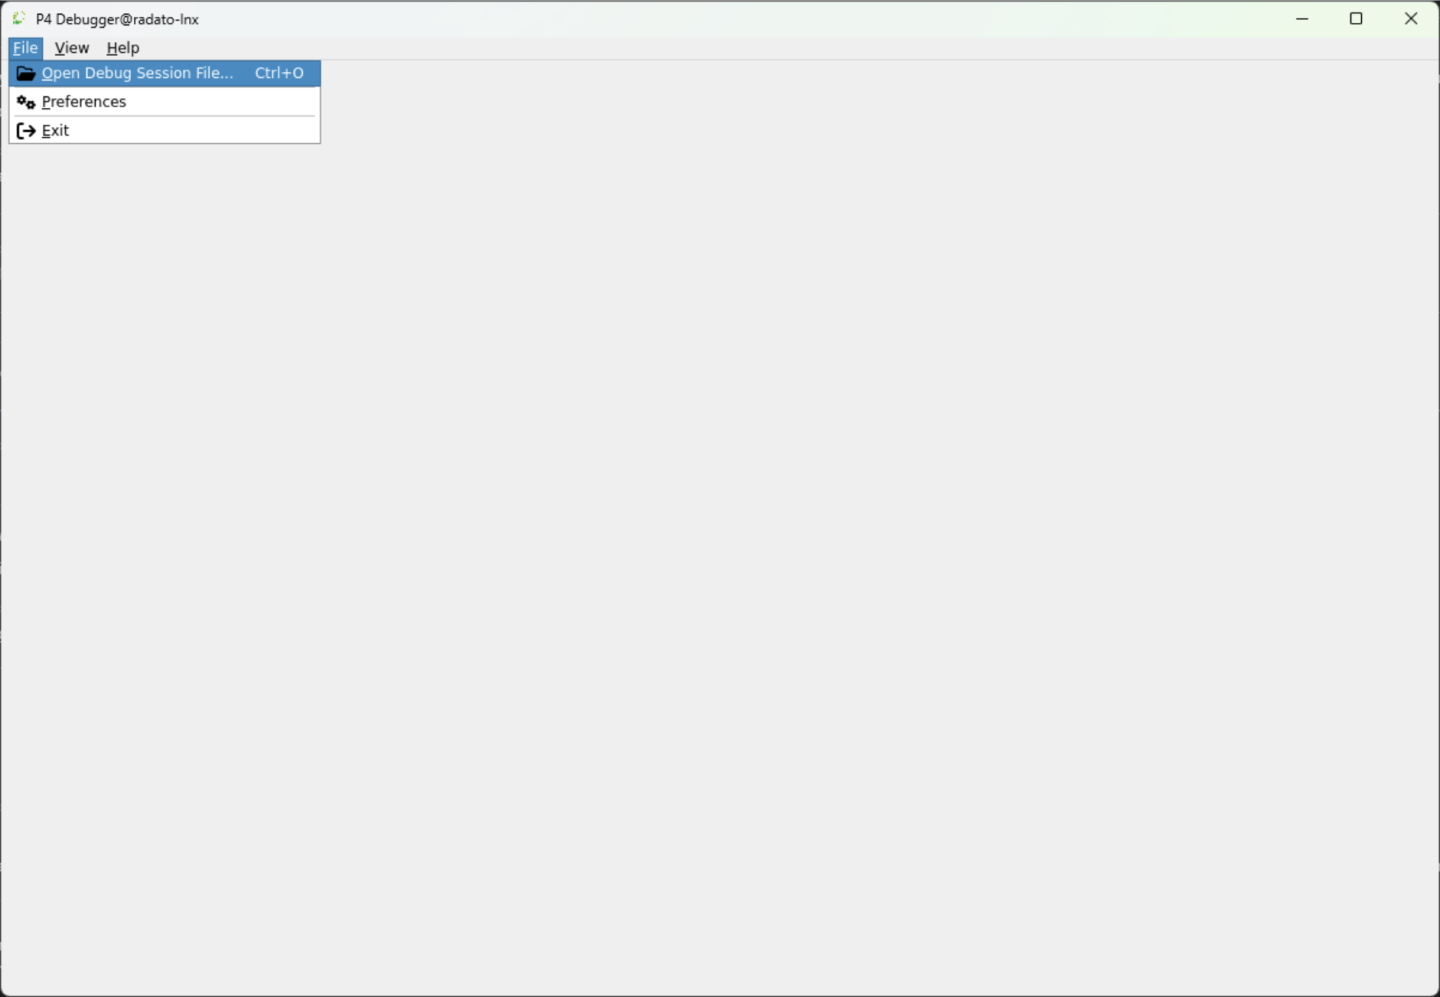
Select the File → Open Debug Session File and choose the appropriate <p4-debug-file>.tar.gz in this example hello_packet.tar.gz.
The tar.gz archive should be the output of a recorded debug session created with p4nspect debug.
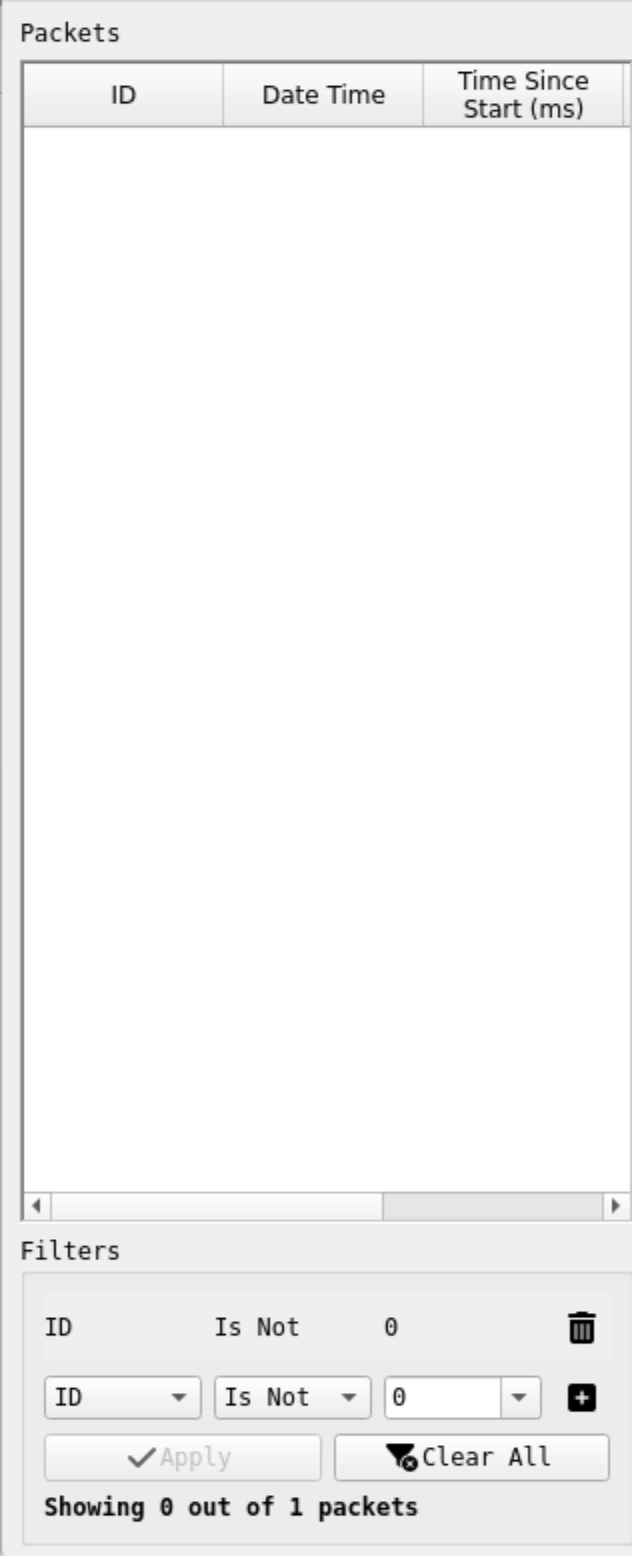
Packet List
On the left pane users can see the Packets list. The packet list exposes the following fields:
ID – this is the packet's unique identifier.
Date Time – the time it entered the p4 pipeline.
Time Since Start – time since the first packet entered the p4 pipeline.
Size – packet size
Ingress Port
Filter
To filter out packets use the fields at the bottom left of the screen.
For example: "packet ID is not 0".
Press the + button and then the Apply button
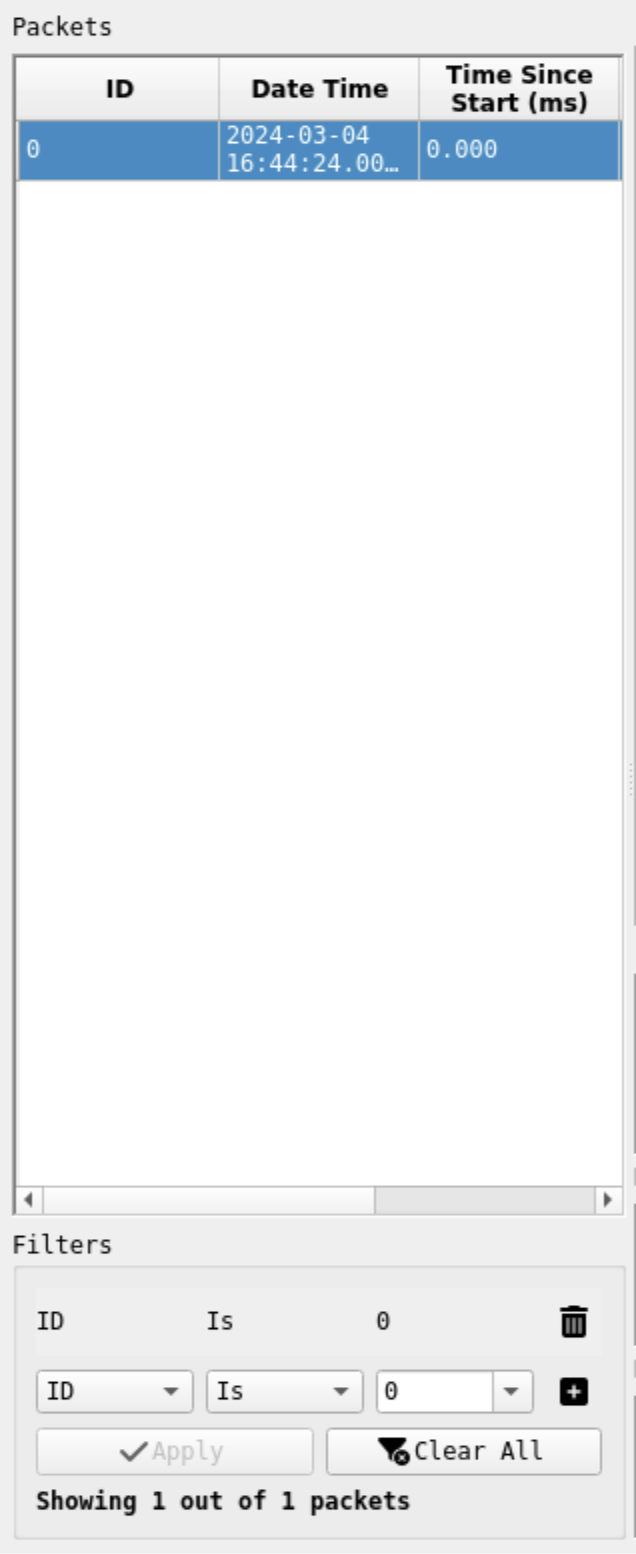
Press the "Clear All" button.
A converse filter example: "packet ID is 0" again pressing the + and then the Apply buttons
Parser Graph
The middle section of the screen there is the parser graph
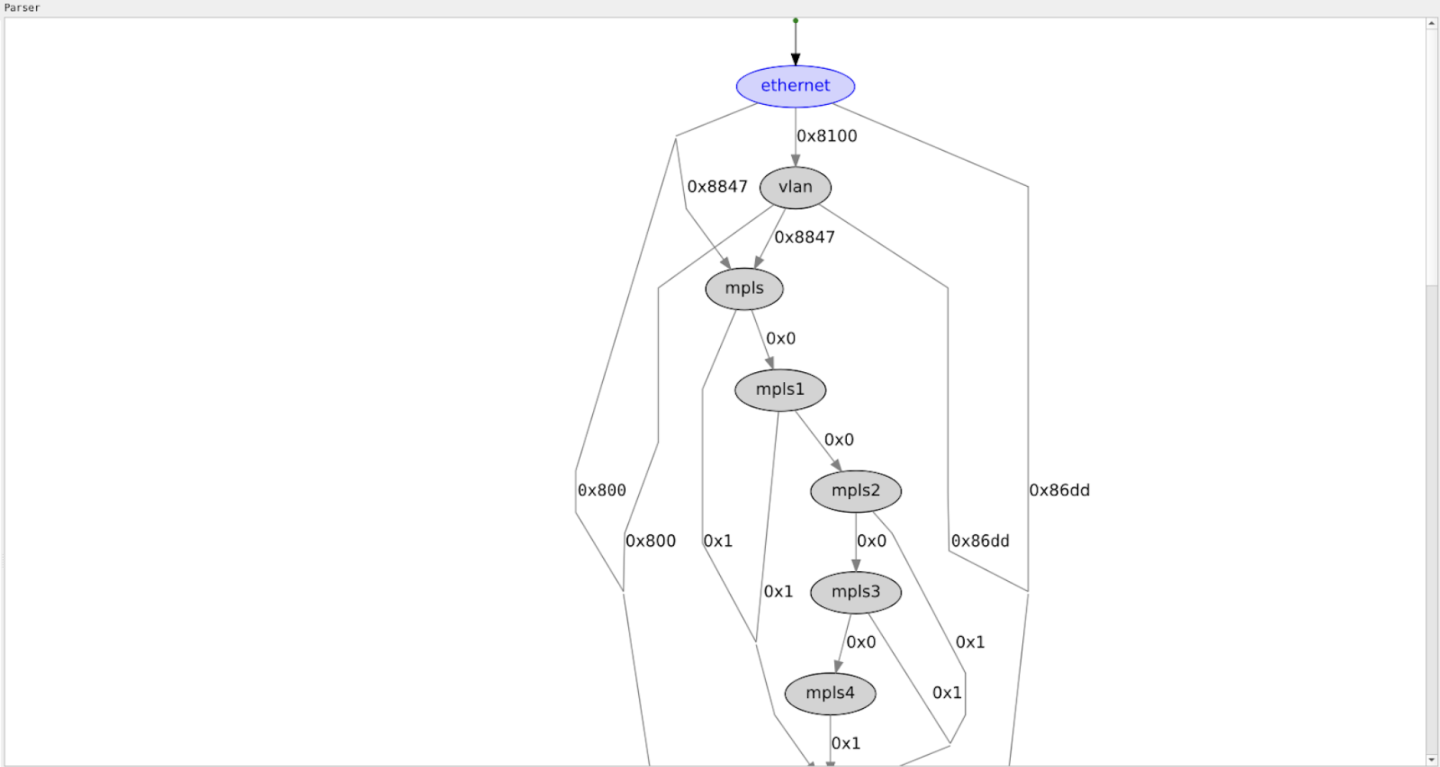
It outlines the route a packet can take. The purple nodes (such as "ethernet" above) indicate the node it traversed. It consists of both flex nodes which the p4 programmer instigated and static (fixed) nodes which are inherent part of the hardware.
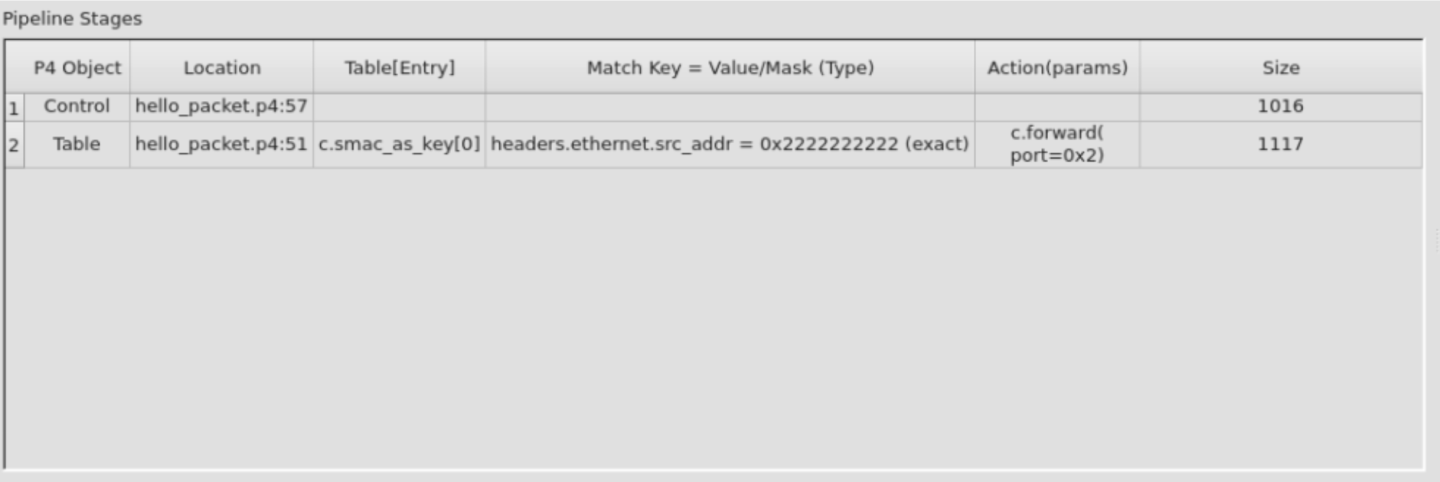
Pipeline Stages
Selecting a packet from the Packets list will display the selected packet's pipeline stages.
Each row in the pipeline stages correlates to a single source location point in the P4 program code.
Cells in the table are interactable, selecting a cell will mark the relevant source location when applicable.
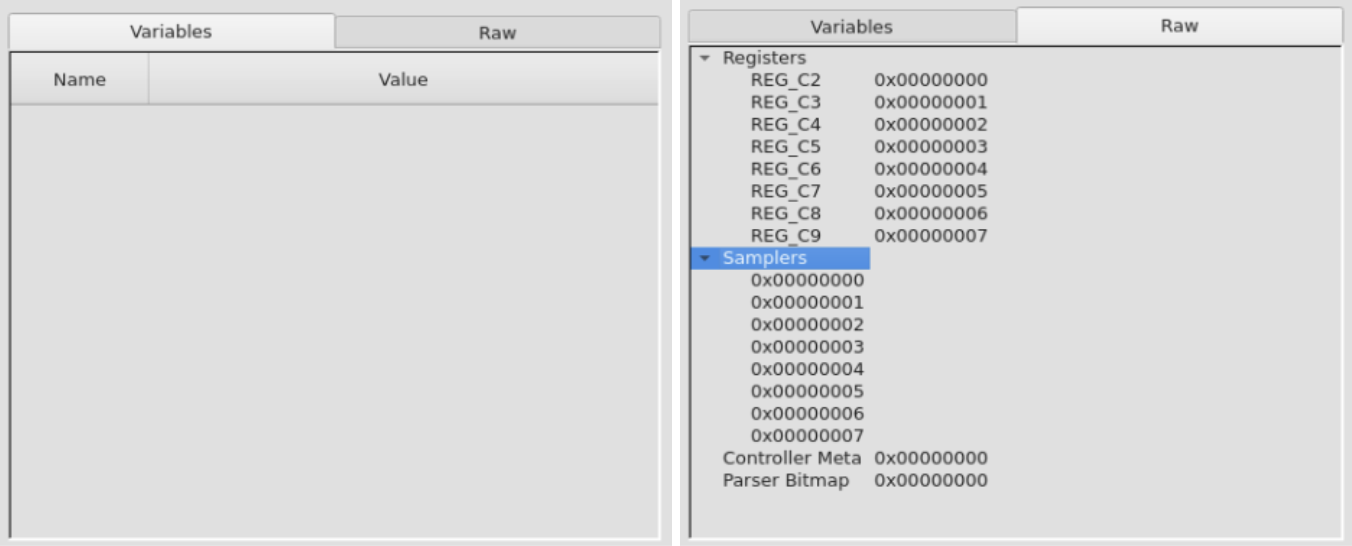
Variables
Selecting a pipeline stage (a single cell or the whole row) will display variable information in two different tabs.
The "Variables" tab shows P4 variables defined in the program and their values in the current pipeline stage.
The "Raw" tab shows a deeper dive into the low level variables (e.g., registers, samplers, etc.)
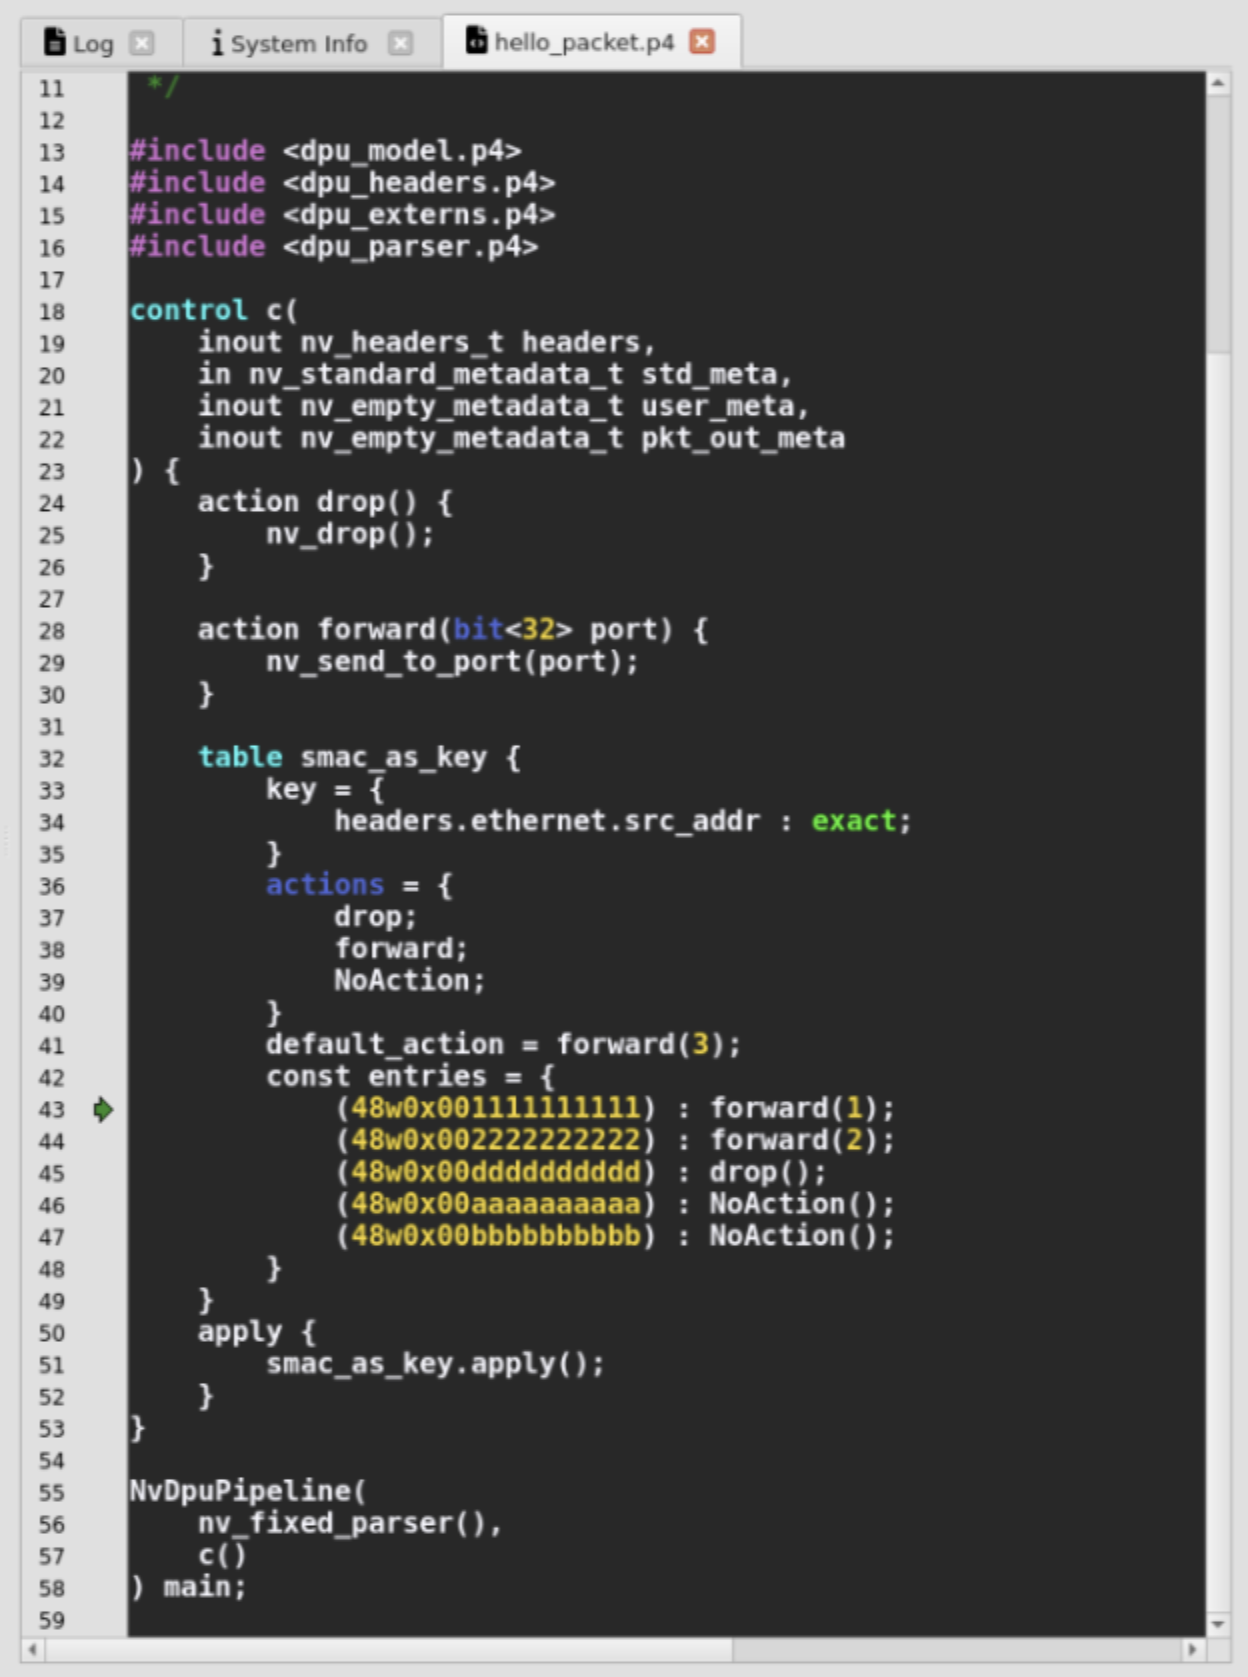
Source Code
Selecting a cell in a pipeline stage will open the P4 program in a new tab, marking the relevant source location when applicable.
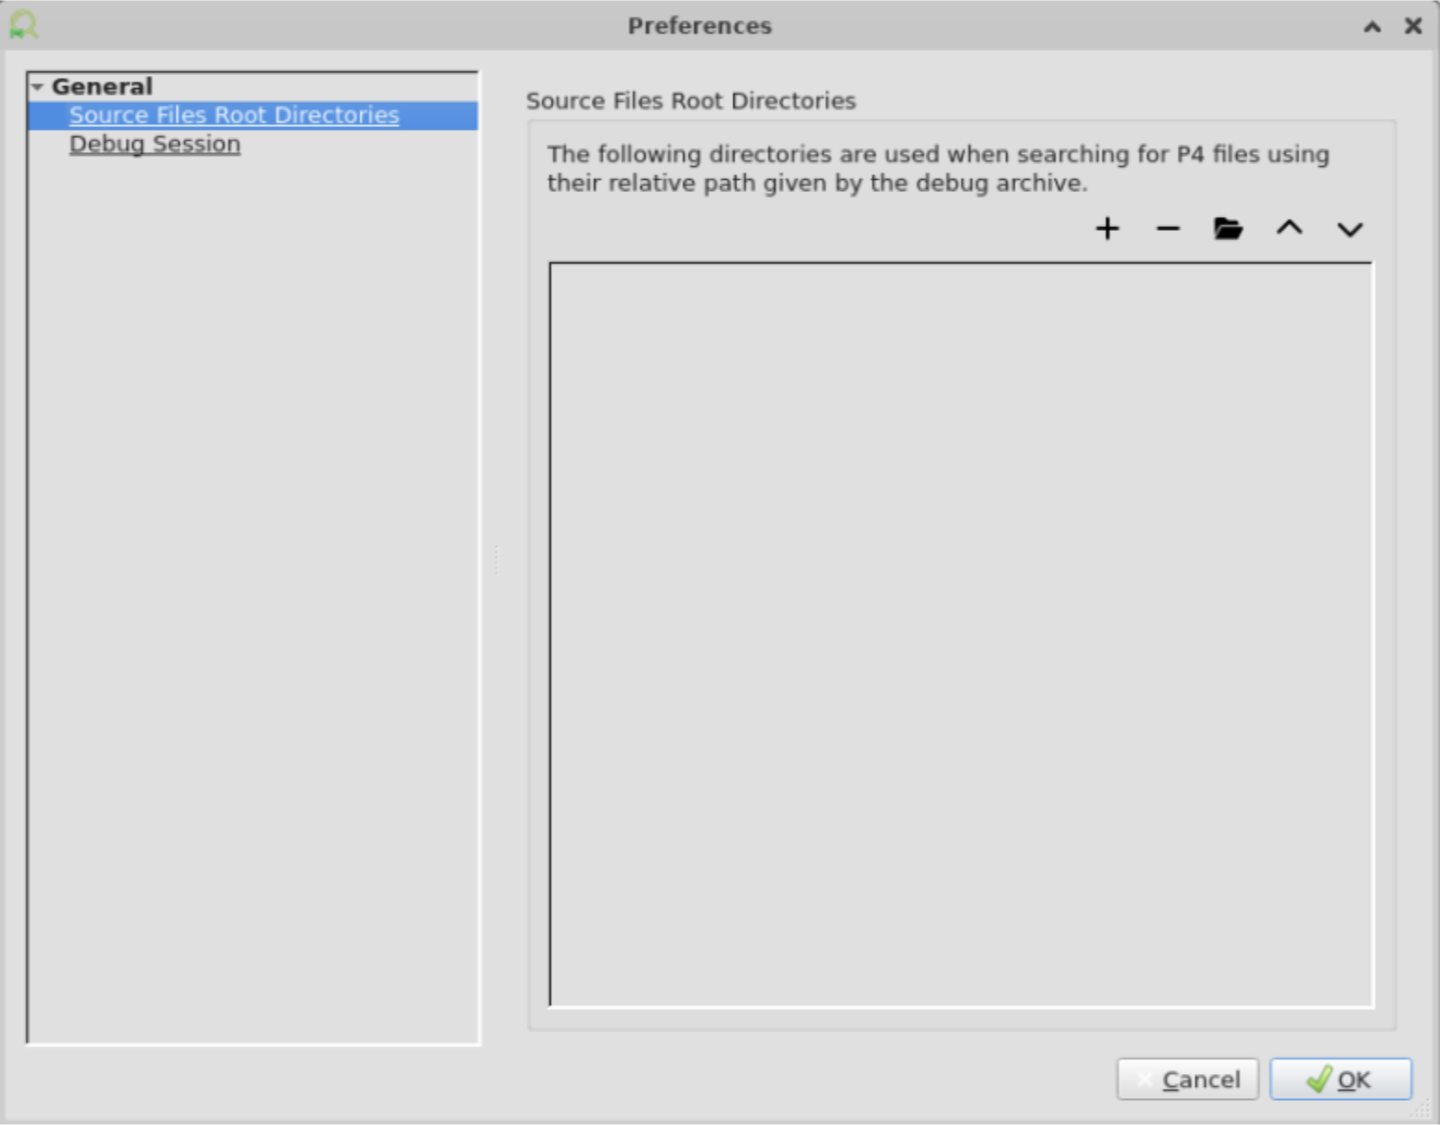
The debugger seeks the P4 source file using the search paths defined in the Settings or by browsing manually for the file.
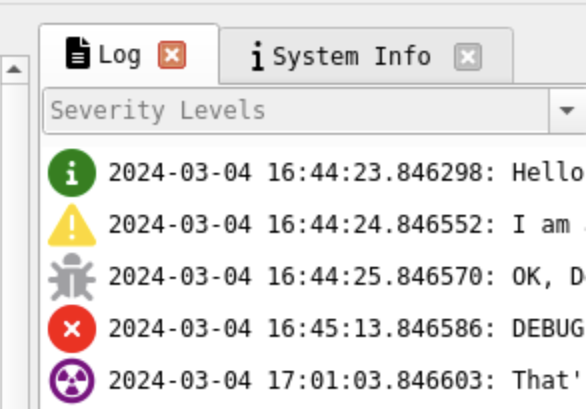
Log
The log window pane is on the left side. It shows the internal logs of the P4 agent.
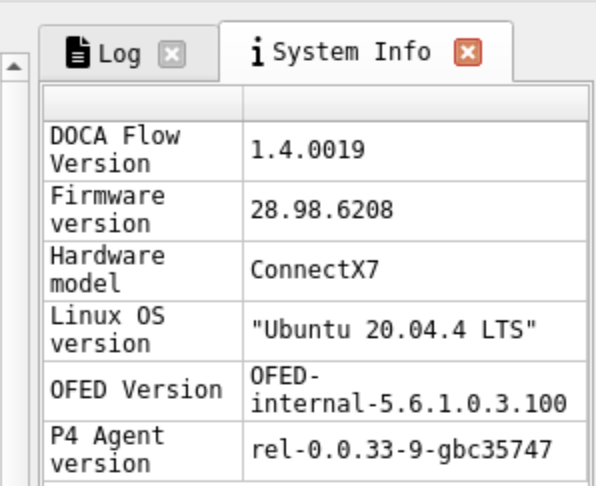
System Info
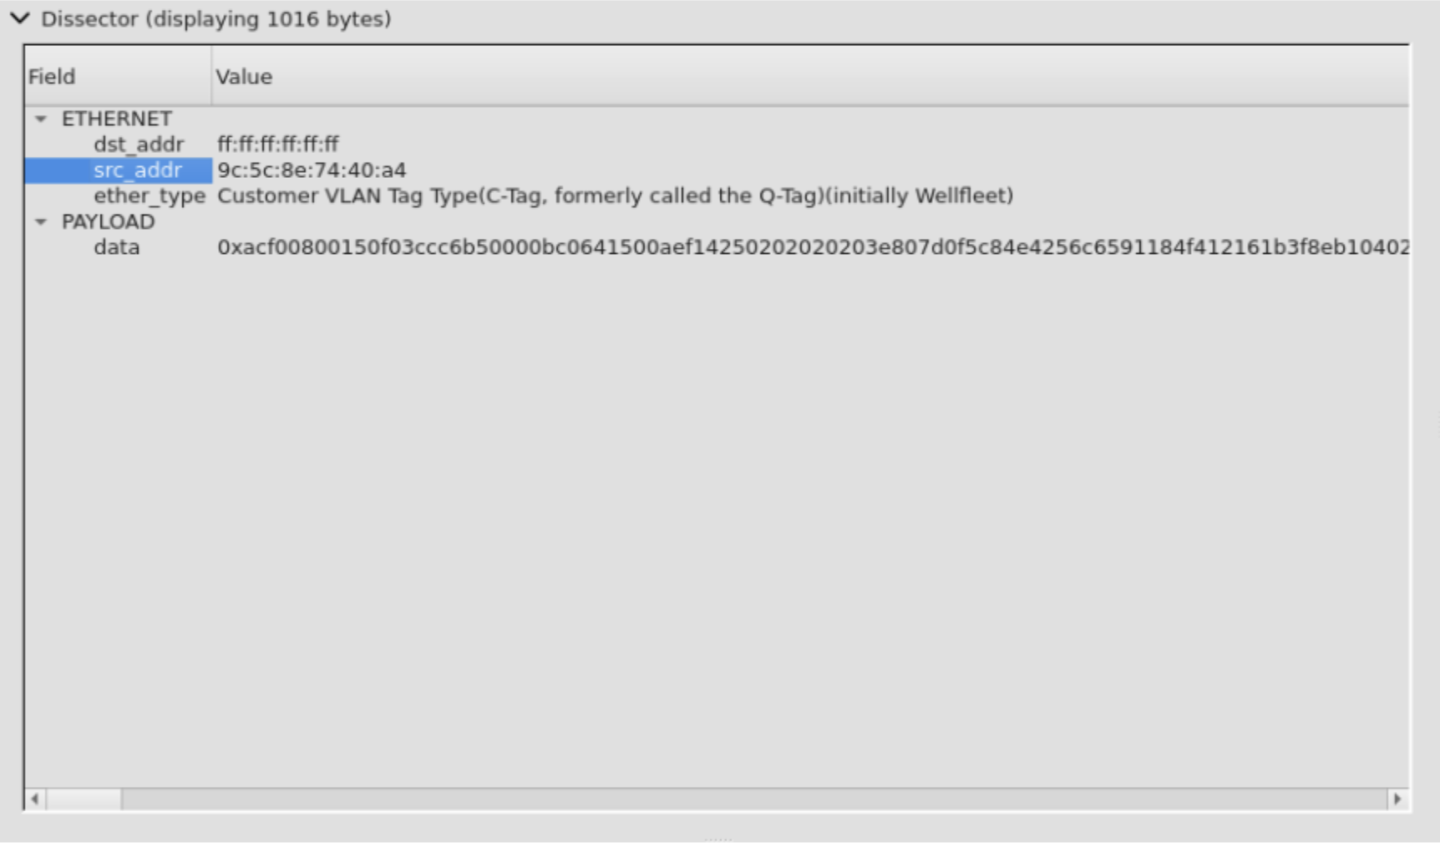
Packet Dissector
Selecting a pipeline stage will dissect the packet.
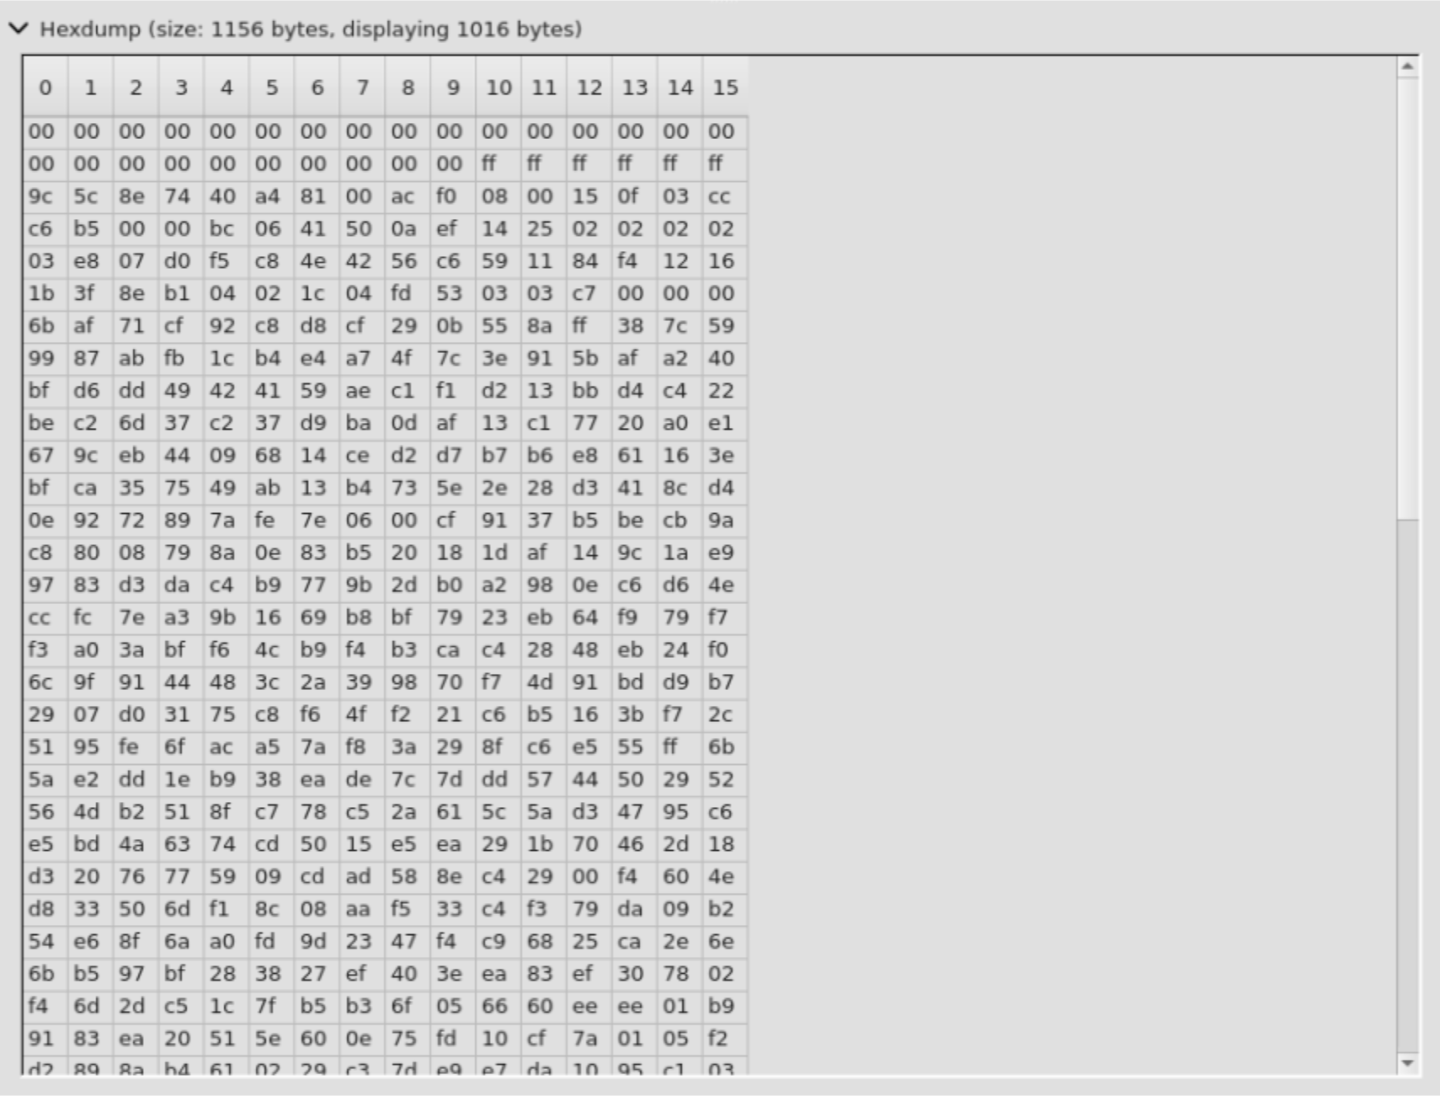
Hex Dump
Selecting a pipeline stage will show a raw hex dump of the packet.
Options
The File->Preferences menu will open the Preferences window.
Here you can set different settings related to the debugger and the debug session.