Activities
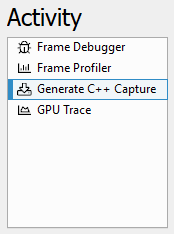
NVIDIA Nsight Graphics Supports multiple activities to target your workload to the need of your work at a particular point in your development process.
-
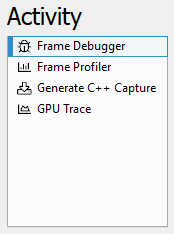
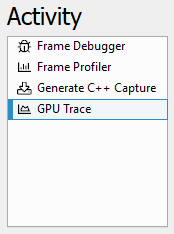
Frame Debugger – allows you debug a frame by each draw call. You can view vertex shaders, pixel shaders, and pipeline states.
-
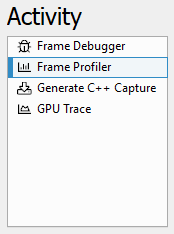
Frame Profiler – provides a deep analysis of the performance of your application. Several features are provided to analyze.
-
Generate C++ Capture – allows you to export an application frame as C++ code to be compiled and run as a self-contained application for later analysis, debugging, profiling, regression testing, and edit-and-compile experimentation a frame by each draw call. You can view vertex shaders, pixel shaders, and pipeline states.
-
GPU Crash Dump – offers a debugging activity that allows you to collect a detailed dump in the case of a crash.
-
GPU Trace – supports the analysis of SM workloads.
Frame Debugger
The Frame Debugger activity allows for:
-
Real-time examination of rendering calls;
-
Interactive examination of GPU pipeline state, including visualization of bound textures, geometry and unordered access views;
-
Pixel History shows all operations that affect a given pixel;
-
Range Profiler identifies performance bottlenecks and GPU utilization;
-
C++ Capture exports for offline collaboration and analysis.
When to Use the Frame Debugger Activity
The Frame Debugger activity offers a comprehensive set of tools for discovering problems with your application's rendering or general operation. This activity enables the inspection of events, API state, resource values, and dependencies to understand where your application might have issues. Use this activity when:
The Frame Debugger activity supports all APIs that are generally supported by NVIDIA Nsight Graphics.
Basic Workflow
To start this activity, select Frame Debugger from the connection dialog.
The basic workflow for the Frame Debugger activity is to capture an application and then navigate the events, data, and resources that your application is submitting/using to identify your issue.
Whether you are debugging on the CPU or GPU, the first step of any debugging process is to narrow in on the set of data that you need to analyze to understand your problem. Generally, this means that you will want to scrub to a particular event of interest in either the Scrubber or the Event Viewer. Because NVIDIA Nsight Graphics™ will show you the rendering contribution of every draw call, looking at either the HUD or the Current Target View will give you an indication of where your rendering might be going wrong. Another alternative is to use the Pixel History experiment to automatically identify the draw calls that relate to a particular texture update.
From there, you will want to use your knowledge of the graphics pipeline to try to understand what might be causing a problem. Some questions to ask yourself:
-
Is this a geometry problem? If so, is it a pre-transform or post-transform problem?
-
Is this a blending problem?
-
Is this a synchronization problem?
In some cases, there may be a combination of problems that exacerbate a given problem. Isolating the symptoms can be challenging, but an effective use of the tools can offer increased confidence that you are heading in the right direction.
Frame Profiler
The Frame Profiler activity provides a powerful set of tools to assess the performance of your application from a multiplicity of angles. The Frame Profiler Activity allows for:
-
Optimizing the rendering of your application
-
Seeing detailed GPU utilization
-
Automatic determination of performance limiters
When to Use the Frame Profiling Activity
The profiling activity provides detailed performance information for all units of the GPU. Use this activity when:
-
You know that your application is GPU bound.
-
You want to determine whether you are SM bound.
-
You want to explore the performance of a functional unit of the GPU.
The profiling activity currently supports profiling D3D11, D3D12, and OpenGL applications.
Basic Workflow
To start this activity, select Frame Profiler from the connection dialog.
This activity allows for detailed frame profiling and analysis once captured.
Detailed Frame Analysis
Profiling is supported by a similar capture workflow as discussed in the Frame Debugger activity. Once you have captured your application, several views come up by default that are targeted at providing the information you need to understand your applications performance on the GPU. Several views interact to make this possible, including action timings in the Event Viewer, a graphical display of the timings in the Scrubber, and a detailed breakdown of each of your application's workflows in the Range Profiler.
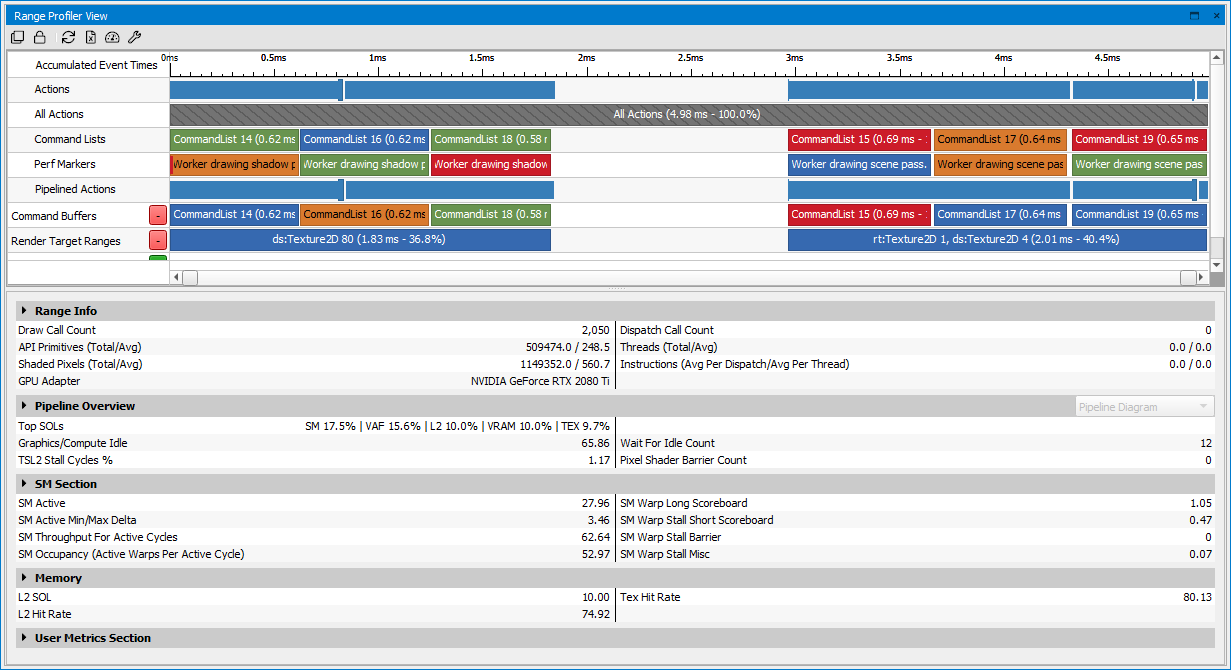
Once you have opened the Range Profiler, you will notice the Range Selector at the top of the view. This widget displays individual actions and ranges scaled by GPU time, similar to the Scrubber.
You can use the Range Selector to see the timings of various sections or passes in the captured scene, and select one of them to drill in and collect the detailed performance metrics. For more information on how to configure the Range Selector, see the Range Selector section.
What to Profile?
The first step for improving performance in a GPU bound application is to determine where you are spending GPU time in the rendering of the scene. This can be accomplished a number of ways using the Frame Debugger. First, adjust the scaling of the Scrubber to be based on GPU time.
This will allow you to see at a glance where the time is being spent on the frame. These ranges will show up in the Scrubber, also scaled by the amount of time the work executed within them takes. Finally, if you haven’t added debug ranges, you can use various criteria to create them on the fly in your debugging session, including render target sets, shader programs in use, etc.
Look for ranges that seem larger than expected, given what you are trying to accomplish in that section of the frame. Also, larger ranges/draw calls likely have more headroom for improvement, so they can be good places to start deeper investigation.
You can also see how much GPU time is spent on various actions and ranges in the Event Viewer. By sorting by GPU Time, you can quickly find the most expensive parts of the frame and begin your analysis from there.
Once you find an area you are interested in profiling, use the right mouse button context menu to initiate the Range Profiler. This will open up the profiler focused on the range or call you determined to be interesting. (Alternatively, you can open the Range Profiler through Frame Debugger > Range Profiler.)
Range Profiler Cookbook
Is my program CPU or GPU bound?
Try hotkey experiments such as minimum geometry and null scissor, to determine if you are GPU bound.
What are the most expensive draw calls in my application?
Capture a frame, and then run the Range Profiler. Once the Range Profiler is done running experiments, the entire scene will be selected by default. This will allow you to see details about all of the draw calls and dispatches in the scene. If you select Action Details in the Range Info section, you will see details on each draw call, including the execution time. Sort the table to time to see the most expensive draw call.
How can I optimize a range of draw calls?
In the Pipeline section, select Range Details and you will see an image with a virtual GPU pipeline. The red bars indicate units in the GPU that are not being used as efficiently as they could, so look for the higher bars to indicate where you need to spend time optimizing. (See below for specific tips on optimizing your API inputs for a particular unit).
How do I see collections of draw calls which share common state (like pixel shaders and vertex shaders)?
The Range Profiler contains a powerful grouping capability that allows you make new ranges based on common state. These include ranges based on program/shaders being used, viewport, render targets, and even user ranges that can be declared on the fly.
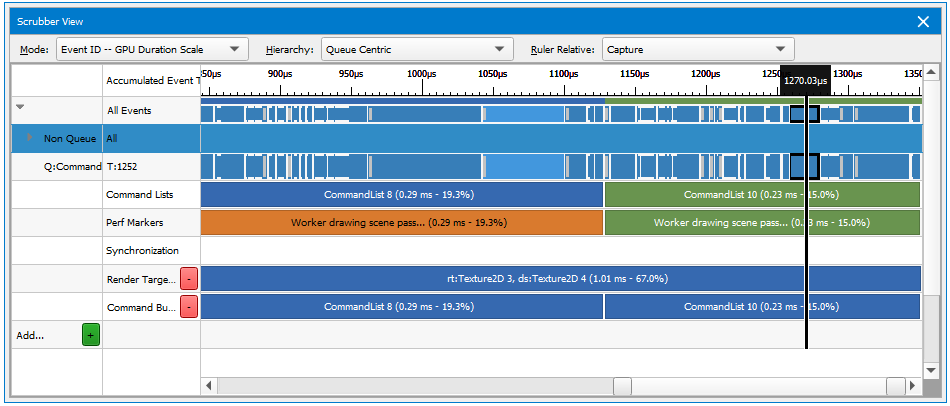
How do I profile draw calls which are in a specific performance marker?
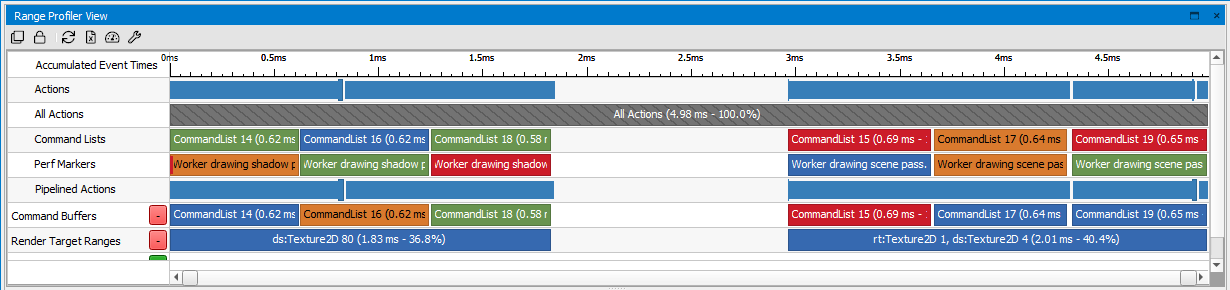
The scrubber at the top of the Range Profiler View shows all of the performance marker ranges defined by the application, along with the amount of time spent for each one. A good strategy would be to look for ranges with a large amount of time, then drill down to where you see a large amount of time being spent. Once you click on that range, you can look at the Pipeline section for details on how that selected range is utilizing the GPU.
Why does my application run at a different frame rate under NVIDIA Nsight Graphics?
The NVIDIA Nsight Graphics Frame Debugger disables VSYNC, so applications that have VSYNC enabled under normal circumstances may see a higher frame rate when the same application is run under the Frame Debugger. NVIDIA Nsight Graphics also has a small performance overhead, which may reduce the frame rate slightly.
Shader Profiling for SM Limited Workloads
The Shader Profiler is a tool for analyzing the performance of SM-limited workloads. It helps you, as a developer, identify the reasons that your shader is stalling and thus lowering performance. With the data that the shader profiler provides, you can investigate, at both a high- and low-level, how to get more performance out of your shaders. The Shader Profiler is currently in preview for the D3D12 API.
How do I use it?
The Shader Profiler can be launched from several locations within the tool, much like the Range Profiler. Because the Shader Profiler targets the performance of your shaders, we recommend that you launch the Shader Profiler when the Range Profiler has identified that a particular range is shader limited. Once identified, you can click through a link in the Shaders section of the range profiler to collect and present a Shader Profiler report.
How does it work?
The Shader Profiler works by repeatedly running your shader code in a replay and using dedicated hardware samplers to determine the reasons why your code is stalling. The repeated runs allow for capturing of statistically valid sampling that ensures that you are getting a reliable, actionable analysis. Once the sampling experiment is completed, a report is generated that will allow you to find and action on the key hot spots within your shader pipeline.
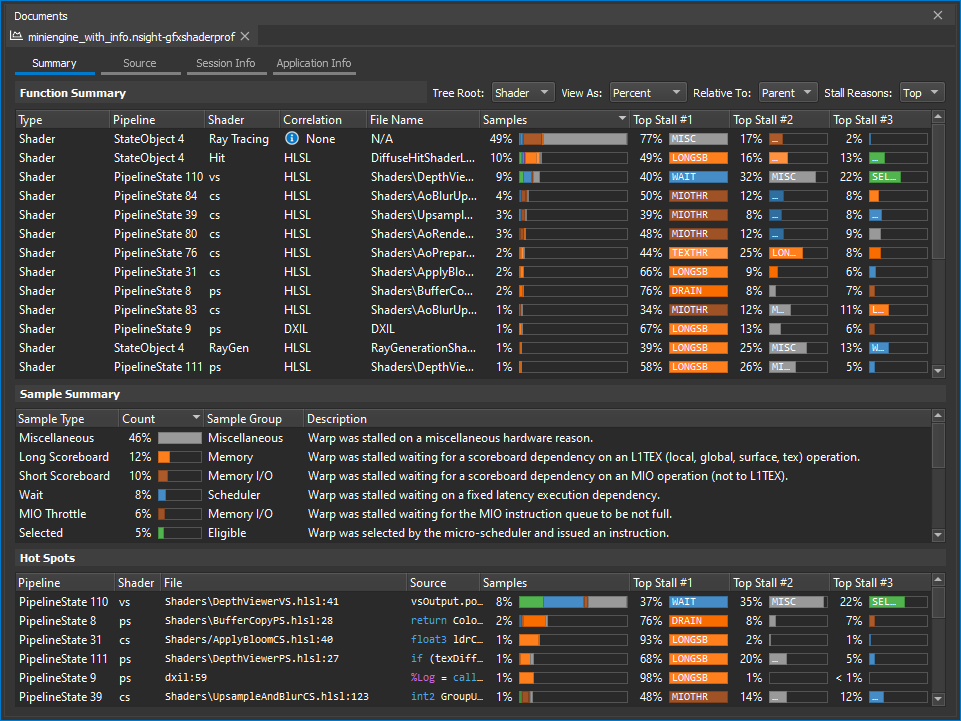
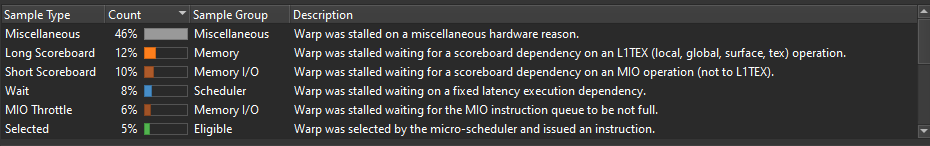
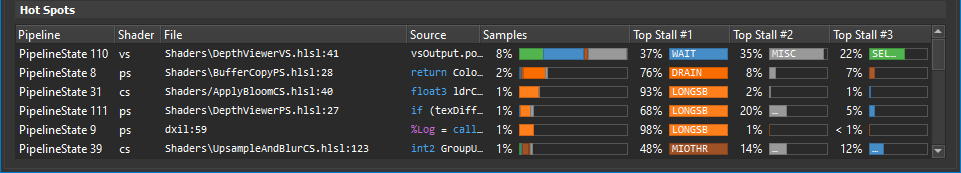
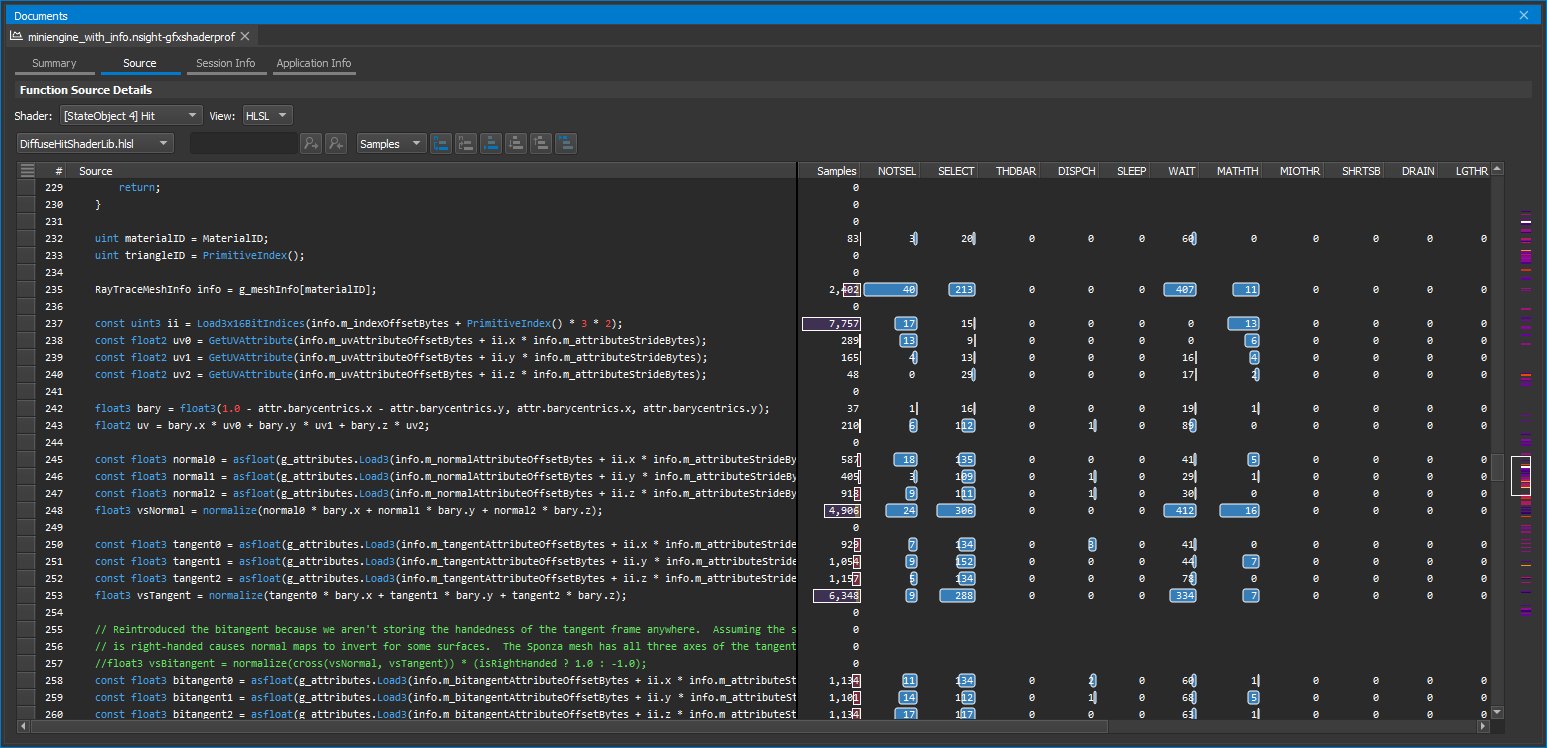
The reports contains several sections, including a Function Summary rollup of all of the shaders that were active within the range that was sampled, a high-level, selection-sensitive Sample Summary of the samples within that range, and a Hot spots view that identifies the key lines that contributed the most samples in the overall range. The report also presents tabs that report on session and application information, as well as the Source tab that allows for mapping, on a line-by-line basis, where samples hit.
Key Concepts
The shader profiler should be used to optimize latency-bound shaders. These types of shaders often have signatures of these forms:
- SM Activity and SM Occupancy are high. (If not, improve these first.)
- SM Throughput is low.
- Cache Throughputs (L1TEX, L1.5, L2) are low or middling.
If SM Throughput is high, the shader is likely computationally-bound, and better solved through a Range Profiler workflow.
SM Warp Scheduler and PC Sampler
To understand PC Sampling data, you must first understand how the GPU executes shader instructions. Start by consulting the GPU Programming Guide:


The following explains how the PC sampler works in conjunction with the hardware warp schedulers, to produce the final output.
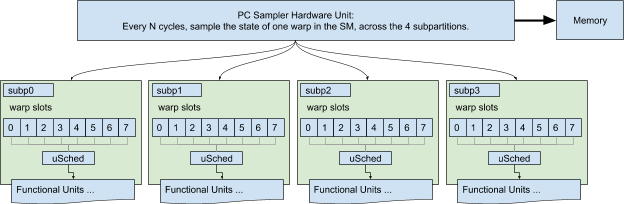
Each SM has four schedulers, one per subpartition. On Turing, each scheduler governs 8 warp slots, with up to 8 launched & resident warps, and can issue an instruction from one selected warp per cycle. A warp can only issue an instruction if it is eligible : the instruction must be fetched, all of its operands available (with no data dependencies), and the destination pipeline must be available. When a warp is not eligible, it is said to be stalled; the stall reason describes why the warp is not eligible.
Each warp has a program counter register (PC) that points at the next instruction fetch location for the active threads in that warp. Inactive threads also have PC registers to support Independent Thread Scheduling, but inactive threads are irrelevant; the PC Sampler only inspects active threads’ PCs.
Nsight configures the PC Sampler hardware to sample a { PC, Stall Reason ID} at a regular interval across the entire SM (all four subpartitions); that data is streamed to memory. The tool then converts raw data into a count (Samples) per PC, and a count-per-reason per PC.
A compute-centric treatment of this topic can be found here.
Average Warp Latency
The average warp latency is the number of cycles that an average warp was resident on the GPU. The Samples% indicates the % of the average warp latency occupied by a given shader, function, or PC. Sorting by Samples reveals the regions of code with the highest contribution to latency. After identify top latency contributors, determine next steps by inspecting stall reasons.
Interpreting Sample Locations
Stalls are reported at the PC where a warp was unable to make progress. In many cases, this is due to an execution or data dependency on a prior instruction. For example, the following code may report a large number of samples on the line of code that consumes texResult, but the real culprit is the data producer g_MeshTexture.Sample().
float4 texResult = g_MeshTexture.Sample(MeshTextureSampler, In.TextureUV);
Output.RGBColor = texResult * In.Diffuse;
Note that samples can appear in the shadow of a taken branch - that is, on the instruction following a branch, even if that instruction is not executed - because the branch is still resolving at the time of the sampling.
if (constantBuffer.ConditionWeExpectToBeFalse)
{
     texResult = ...; // samples in the shadow of a branch
     output = dot(color, textResult);
}
else
{
     output = dot(color, constant);    // expect all samples to fall here
}
Stall Reasons
Stall reasons explain why a warp was unable to issue an instruction. Each stall reason is provoked by a distinct set of conditions or instructions; by eliminating those conditions or transforming code from one set of instructions to another, you can reduce stalls.
-
Barrier: Compute warps are waiting for sibling warps at a GroupSync.
- If the thread group size is 512 threads or greater, consider splitting it into smaller groups. This can increase eligible warps without affecting occupancy, unless shared memory becomes a new occupancy limiter.
- Review whether all GroupSyncs are really necessary.
-
Dispatch Stall: A pipeline interlock prevented instruction dispatch for a selected warp.
-
If dispatch stalls are higher than 5%, please file a bug to NVIDIA with reproducible.
-
-
Drain : Exited warp is waiting to drain memory writes and pixel export.
-
LG Throttle : Input FIFO to the LSU pipe for local and global memory instructions is full.
-
Eliminate redundant global memory accesses (UAV accesses).
-
Data organization: pack UAV or SRV data to allow 64-bit or 128-bit accesses in place of multiple 32-bit accesses.
-
Long Scoreboard : Waiting on data dependency for local, global, texture, or surface load.
-
Find the instruction or line of code that produces the data being waited upon; that instruction is the culprit.
-
Consider transforming a lookup table into a calculation.
-
Consider transforming global reads in which all threads read the same address into constant buffer reads.
-
If L1 hit rate is low, try to improve spatial locality (coalesced accesses).
-
If VRAM Throughput is high, try to improve spatial locality (coalesced accesses).
-
-
Math Pipe Throttle : A math pipe input FIFO is full (FMA, ALU, FP16+Tensor).
-
This stall reason implies being computationally bound. Use the Range Profiler to best determine how to move computation to a different execution unit.
-
-
Membar : Waiting for a memory barrier to return.
-
Memory barriers are issued by GroupMemoryBarrier, DeviceMemoryBarrier, AllMemoryBarrier, and their GroupSync variants.
-
Review whether the specified scope of each barrier in the shader is really needed. Group-level barriers resolve much faster than Device-level.
-
Review whether a memory barrier is needed at all. A compute shader where each thread writes to a unique UAV location does not require a memory barrier.
-
-
MIO Throttle : The input FIFO to MIO is full.
-
May be triggered by local, global, shared, attribute, IPA, indexed constant loads (LDC), and decoupled math.
-
-
Misc : A stall reason not covered elsewhere.
-
Not Selected : Warp was eligible but not selected, because another warp was.
-
High “not selected” could indicate an opportunity to increase register or shared memory usage (lowering occupancy) without impacting performance. Opening the doors to greater shader complexity or improved quality.
-
-
Selected : Warp issued an instruction. Technically not a stall.
-
Short Scoreboard : Waiting for short latency MIO or RTCORE data dependency.
-
TEX Throttle : The TEXIN input FIFO is full.
-
Try issuing fewer texture fetches, surface loads, surface stores, or decoupled math operations.
-
Check whether the shader is using decoupled math (usually to be avoided).
-
Consider converting texture lookups or surface loads into global memory lookups (UAVs). Texture can accept 4 threads’ requests per cycle, whereas global accepts 32 threads.
-
-
Wait : Waiting for coupled math data dependency (FMA, ALU, FP16+Tensor).
See also in the GPU Programming Guide:

Source Correlation
The shader profiler has the ability to correlate the samples that are gathered to source-level lines. This allows you, as the user, to determine, on a line-by-line basis, how your code is running. There are two types of correlation that are supported -- high-level shader language correlation and GPU shader assembly (SASS) correlation. High-level shader language correlation prepares a listing of your shaders source code, and along-side it, a chart of the samples that landed on each particular line. High-level correlation is very effective at grounding you to the code you are most familiar with, which is the shader source itself. For users who have access to the Pro builds of Nsight Graphics, and who wish to dive into the lower-level shader assembly, a SASS view is provided for individual instruction association of samples.
Generate C++ Capture
The C++ Capture activity allows you to export an application frame as C++ code to be compiled and run as a self-contained application for later analysis, debugging, profiling, regression testing, and edit-and-compile experimentation.
When to Use the Generate C++ Capture Activity
While C++ captures can be collected in while Frame Debugging, the C++ capture activity provides a focused activity to streamline the creation of captures. Non-necessary analysis subsystems are turned off in order to allow for the quickest and more robust application capture. This activity is an excellent way to save a snapshot of your application, frozen in time. Use this activity when:
-
You want to save a deterministic application for follow-up performance analysis.
-
You want to save a reference point for how your application is working.
-
You want to share a minimal reproducible with the developer tools or driver teams at NVIDIA to facilitate bug reporting.
The Generate C++ Capture activity supports all APIs that are generally supported by NVIDIA Nsight Graphics.
Basic Workflow
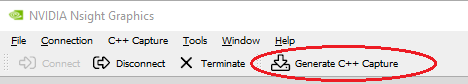
To start this activity, select Generate C++ Capture from the connection dialog.
Once the application is running, the Generate C++ Capture button will be available on the main toolbar.
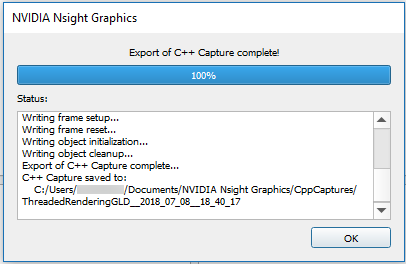
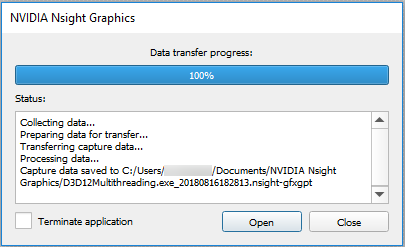
Once a capture is started, the target application will temporarily pause, and a progress dialog will be shown detailing the steps of the export to C++ process. When complete, the C++ project is written to the disk and the application will resume.
By default, the save directory is co-located beside the current project. If no project is currently loaded the default save directory is used (see Options > Environment > Default Documents Folder).
In addition to the C++ project, the code generation process also produces an nsight-gfxcppcap file with additional information and utilities. These nsight-gfxcppcap files are automatically associated with the current project and can be reopened later.
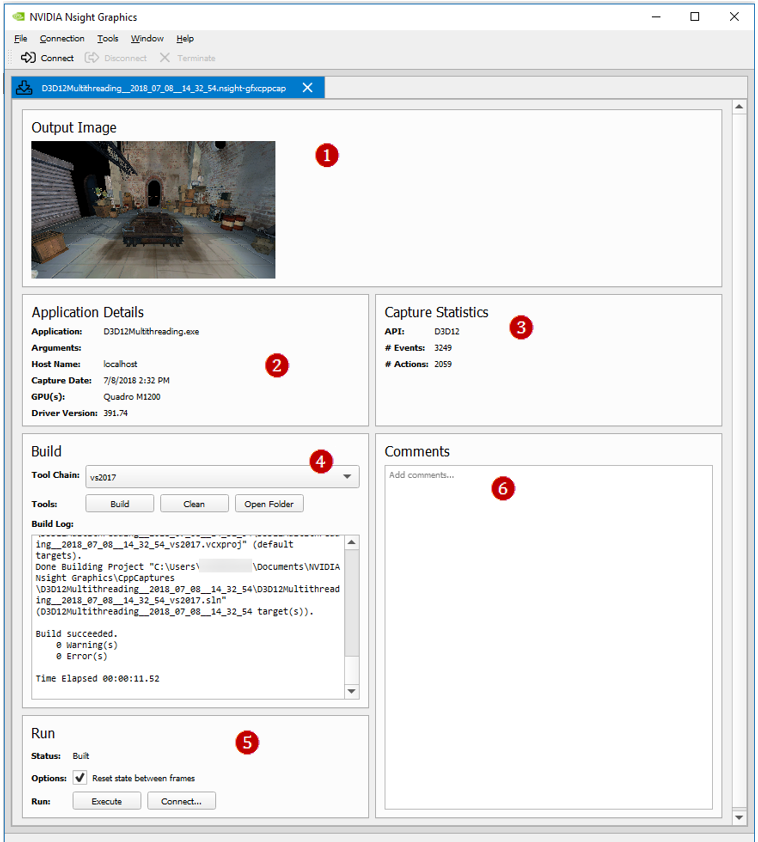
The additional features of an nsight-gfxcppcap file include:
-
Screenshot of the capture taken from the original application.
-
Information about the captured application and its original system.
-
Statistics about the captured API stream.
-
Utilities to build the C++ capture without opening the generated Visual Studio project.
-
Utilities to launch the compiled application:
-
The Execute button will launch the compiled executable.
-
The Connect... button will populate a new connection dialog that allows you to run a specific activity on the generated capture.
-
-
User comments that are persisted within this file.
Using a Saved Capture
-
To use the saved capture, open the saved project from the Captures directory in Visual Studio. Saving a capture will generate the source code, as well as project and solution files for all supported Visual Studio versions.
-
These solution files contain a number of generated source files.
-
Main.cpp — This is where all of the initialization code is called, resources are created, and each frame portion is called in a message loop.
-
ResourcesNN.cpp — Depending on the number of resources to be created, there will be multiple ResourcesNN.cpp files, each with a CreateResourcesNN call in them, that will construct all of the resources (device(s), textures, shaders, etc.) that are used in the scene. These are called in Main.cpp before replaying the frame in the message loop.
-
FrameSetup.cpp — This file contains all of the state setting calls to set the API state to the proper values for the beginning of the frame, including what buffers are bound, which shaders are enabled, etc.
-
FrameNPartMM.cpp — In Direct3D and single-threaded OpenGL captures, these files contain the API functions, each named RunFrameNPartMM(), to replay the frame. It is split into multiple files so generated code is easier to work with. These functions are called sequentially in the message loop in Main.cpp.
-
ThreadLLFrameNPartMM.cpp — In multi-threaded OpenGL captures, these files contain the API functions, each named ThreadLLRunFrameNPartMM(), to replay the frame. The functions correspond to the work done by each thread during the frame. These functions are called by their respective threads and synchronized to replay the saved events in the same order as captured.
-
ReadOnlyDatabase.cpp — This is a helper class to access resource data that is stored in the data.bin file. It is accessed throughout the code via the GetResource() call.
-
Helpers.cpp — These functions are used throughout the replayer for various conversions and access to the ReadOnlyDatabase.
-
Threading.cpp — This file contains helper functions and classes to manage threads used in the project.
-
-
Build and run the project.
Changing a Resource
If you want to change a resource (for example, to swap in a different texture), you can change the parameters for the construction by looking within the ResourcesNN.cpp files for the texture in question. Textures can be matched by size and/or format. Once you find the variable for the texture, look for that name in the FrameSetup.cpp file. This will contain source lines to lock the texture, call GetResource() to retrieve the data from the ReadOnlyDatabase, and then call memcpy(…) to link the data to the texture. You can substitute the call to the ReadOnlyDatabase with a call to read from a file of choice to load the alternate texture.
Changing a Draw Call
If you want to change the state for a given draw call, you can locate the draw call by replaying the capture within NVIDIA Nsight Graphics and scrubbing to find the call you want to examine. Search in the FrameNPartMM.cpp files for Draw NN, where NN is the 0-based draw call index that NVIDIA Nsight Graphics displayed on the scrubber. Doing this will bring you to the source line for that draw call, and from here, you can add any state changes before that call. Alternatively, you can also disable that specific call by commenting out the source call containing the draw call.
Parameters
-
-repeat N — This setting enables NVIDIA Nsight Graphics to use serialized captures in the normal arch workflow. The N setting indicates the number of times to repeat the entire capture; the default setting is -1, which keeps the capture running on an infinite loop.
-
-noreset — This setting controls whether context state and all resources are reset to their beginning of frame value. When this setting is specified, all frame restoration operations will be skipped, avoiding the performance cost associated with them. Note that this may introduce rendering errors if the rendered frame has a data dependency on the results of a previous frame.
GPU Crash Dump
The GPU Crash Dump activity allows you to detect detailed information in the case of a GPU crash.
GPU Trace
The GPU Trace activity is a low-level profiler that can be used for developers to optimize DirectX12 application for NVIDIA Turing Hardware. It runs on live applications and captures GPU Units' utilization throughout frame execution. The GPU Trace captured report may help to detect bottlenecks in the GPU Pipeline, as well as areas where your application is under utilizing the GPU.
When to Use the GPU Trace Activity
The GPU Trace activity provides detailed performance information for various GPU Units.
Use this activity when:
-
You wish to understand the GPU Units' utilization and search for throughput bottlenecks.
-
You wish to understand how synchronization objects across queues are being executed.
-
You would like to search for opportunities where your application is under-utilizing the GPU.
-
You suspect your engine will benefit from asynchronous compute.
The GPU Trace activity currently supports profiling Direct3D 12 applications and NVIDIA Turing architecture.
Basic Workflow
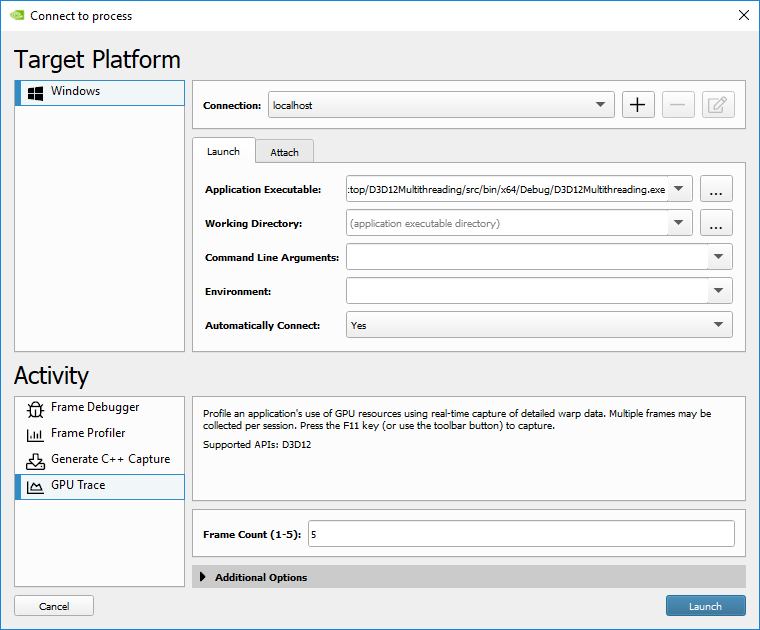
To start the activity, select GPU Trace from the connection dialog.
-
Set up your application for connection (see How to Launch and Connect to Your Application for more information.).
-
Set a Frame Count. This parameter defines how many frames will be captured. The maximum value is 5.
-
Launch or attach to your application. (See How to Launch and Connect to Your Application for more information.)
-
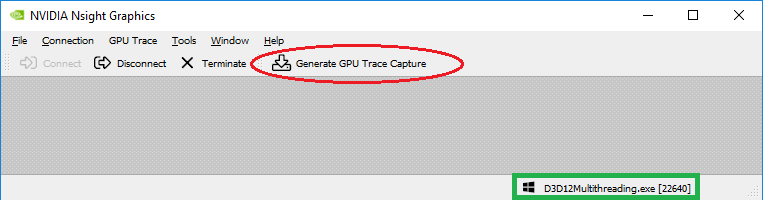
If the application successfully connected, the process name will appear in the lower right corner of the window. You can generate a new capture by clicking the Generate GPU Trace Capture button or by clicking F11 on the running application.
Note:
For best accuracy, it is recommended that you run your application in full-screen mode and turn off VSYNC. You can turn VSYNC off from your application or set DXGI SyncInterval to 0 under Additional Options in the connection dialog.
Note:
By default, GPU Trace will lock the GPU clock to base before capturing. This methodology is recommended so consecutive captures will be comparable.
-
Once launched and connected, click Generate GPU Trace Capture (or select it from the GPU Trace menu) to create a capture report file.
How to Interpret a Report
When interpreting a report, reference the GPU Trace UI section for information on how to interpret each of the pieces of information that is provided. Things to consider:
-
Am I GPU bound?
-
Am I using asynchronous compute?
-
Do I have opportunities for asynchronous compute?
-
What workloads are taking the most time?
-
Is my occupancy low for these workloads?
If you determine that you have opportunities for asynchronous compute and you are not currently using (or achieving) async compute, you may want to investigate your engine to understand where or how you can achieve it.
If you determine that you have expensive workloads with low occupancy, you will want to analyze your shader for opportunities to reduce work or reduce register/memory usage to allow for more occupancy.
Notices
Notice
THE INFORMATION IN THIS GUIDE AND ALL OTHER INFORMATION CONTAINED IN NVIDIA DOCUMENTATION REFERENCED IN THIS GUIDE IS PROVIDED “AS IS.” NVIDIA MAKES NO WARRANTIES, EXPRESSED, IMPLIED, STATUTORY, OR OTHERWISE WITH RESPECT TO THE INFORMATION FOR THE PRODUCT, AND EXPRESSLY DISCLAIMS ALL IMPLIED WARRANTIES OF NONINFRINGEMENT, MERCHANTABILITY, AND FITNESS FOR A PARTICULAR PURPOSE. Notwithstanding any damages that customer might incur for any reason whatsoever, NVIDIA’s aggregate and cumulative liability towards customer for the product described in this guide shall be limited in accordance with the NVIDIA terms and conditions of sale for the product.
THE NVIDIA PRODUCT DESCRIBED IN THIS GUIDE IS NOT FAULT TOLERANT AND IS NOT DESIGNED, MANUFACTURED OR INTENDED FOR USE IN CONNECTION WITH THE DESIGN, CONSTRUCTION, MAINTENANCE, AND/OR OPERATION OF ANY SYSTEM WHERE THE USE OR A FAILURE OF SUCH SYSTEM COULD RESULT IN A SITUATION THAT THREATENS THE SAFETY OF HUMAN LIFE OR SEVERE PHYSICAL HARM OR PROPERTY DAMAGE (INCLUDING, FOR EXAMPLE, USE IN CONNECTION WITH ANY NUCLEAR, AVIONICS, LIFE SUPPORT OR OTHER LIFE CRITICAL APPLICATION). NVIDIA EXPRESSLY DISCLAIMS ANY EXPRESS OR IMPLIED WARRANTY OF FITNESS FOR SUCH HIGH RISK USES. NVIDIA SHALL NOT BE LIABLE TO CUSTOMER OR ANY THIRD PARTY, IN WHOLE OR IN PART, FOR ANY CLAIMS OR DAMAGES ARISING FROM SUCH HIGH RISK USES.
NVIDIA makes no representation or warranty that the product described in this guide will be suitable for any specified use without further testing or modification. Testing of all parameters of each product is not necessarily performed by NVIDIA. It is customer’s sole responsibility to ensure the product is suitable and fit for the application planned by customer and to do the necessary testing for the application in order to avoid a default of the application or the product. Weaknesses in customer’s product designs may affect the quality and reliability of the NVIDIA product and may result in additional or different conditions and/or requirements beyond those contained in this guide. NVIDIA does not accept any liability related to any default, damage, costs or problem which may be based on or attributable to: (i) the use of the NVIDIA product in any manner that is contrary to this guide, or (ii) customer product designs.
Other than the right for customer to use the information in this guide with the product, no other license, either expressed or implied, is hereby granted by NVIDIA under this guide. Reproduction of information in this guide is permissible only if reproduction is approved by NVIDIA in writing, is reproduced without alteration, and is accompanied by all associated conditions, limitations, and notices.
Trademarks
NVIDIA, the NVIDIA logo, and cuBLAS, CUDA, CUDA-GDB, CUDA-MEMCHECK, cuDNN, cuFFT, cuSPARSE, DIGITS, DGX, DGX-1, DGX Station, NVIDIA DRIVE, NVIDIA DRIVE AGX, NVIDIA DRIVE Software, NVIDIA DRIVE OS, NVIDIA Developer Zone (aka "DevZone"), GRID, Jetson, NVIDIA Jetson Nano, NVIDIA Jetson AGX Xavier, NVIDIA Jetson TX2, NVIDIA Jetson TX2i, NVIDIA Jetson TX1, NVIDIA Jetson TK1, Kepler, NGX, NVIDIA GPU Cloud, Maxwell, Multimedia API, NCCL, NVIDIA Nsight Compute, NVIDIA Nsight Eclipse Edition, NVIDIA Nsight Graphics, NVIDIA Nsight Systems, NVLink, nvprof, Pascal, NVIDIA SDK Manager, Tegra, TensorRT, Tesla, Visual Profiler, VisionWorks and Volta are trademarks and/or registered trademarks of NVIDIA Corporation in the United States and other countries. Other company and product names may be trademarks of the respective companies with which they are associated.