User Interface Reference
This section provides a deep view of all of the user interface elements and views that NVIDIA Nsight Graphics offers.
App Configuration and Activity Selection UI
Launch Tab
The Launch tab enables launching applications for analysis. This is where you will add the basic process information to launch and subsequently connect to the application you wish to analyze.
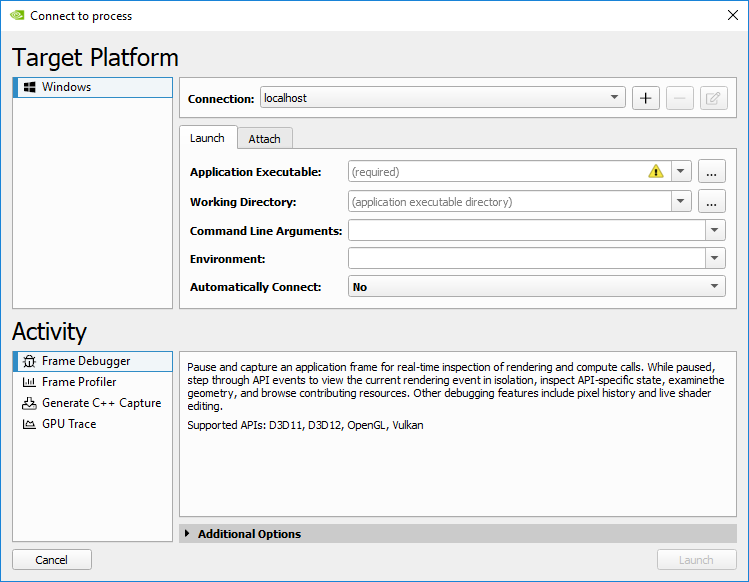
This tab has the following controls:
Application Executable - Specifies the root application to launch. Note that this may not be the final application that you wish to analyze; see this section on how to launch different types of applications.
Working Directory - The directory in which the application will be launched
Command Line Arguments - specify the arguments to pass the application executable.
Environment - the environment variables to set in the launched application
Automatically Connect - specifies whether the launched application should be automatically connected to. If the launched application is a launcher that creates the process that you ultimately wish to analyze, set this to 'No'.
 selector to allow you to cycle through
recently used entries. This is a useful capability for cycling
through common configurations.
selector to allow you to cycle through
recently used entries. This is a useful capability for cycling
through common configurations.
Attach Tab
To attach to an application, it must have previously been launched through the launch tab. This page will list the launched application as well as any children that the application has launched.
Activities Options
NVIDIA Nsight Graphics allows for adjusting the activity with a large set of options. Options are available in the Connect window under the Additional Options section. These options are saved per-project, and per-activity, because the options for one activity may not relate to the other. Note that you may need to apply them to multiple activities if your needs for each activity are the same.
| Option | Description |
|---|---|
|
Enable Target HUD |
Enables the HUD on the target application, which enables: |
|
Force Repaint |
Enables a periodic trigger of window invalidation, which causes applications that lazily present to repaint, such as many professional visualization applications. This is useful for providing a consistent stream of frames with which NVIDIA Nsight Graphics can perform its analysis. |
| Option | Description |
|---|---|
|
Force Validation |
Force the Vulkan validation layers to be enabled. This requires the LunarG Vulkan SDK to be installed. |
|
Validation Layers |
Layers used when force enabling validation. This option is only visible when 'Force Validation' is turned on. |
|
Enable Coherent Buffer Collection |
Controls the monitoring and collection of mapped coherent buffer updates during capture. This is potentially an expensive operation and many applications can replay a single frame without actively monitoring these changes. Use this option if your capture takes a long time but you do not straddle frames with coherent updates. |
|
Enable Revision Zero Data Collection |
Controls the collection of revision zero (e.g. pre-capture) data during capture. This is potentially an expensive operation and some applications can replay a single frame without explicitly storing these revisions. |
|
Allow Unsafe pNext Values |
Allows the inspection of Vulkan structures with potentially dangerous pNext values. By default structures with no known extensions are skipped. |
|
Use Safe Object Lookup |
Controls how objects are stored internally by the tool. Safe lookup are slower but may improve stability when using an unsupported extension. |
|
C++ Capture Object Set |
This option controls which objects are exported as part of a Vulkan C++ capture. By default we limit the object set to only objects used in the capture but in some cases a user might want to see all objects used in the application. This typically isn't necessary and can lead to a very large C++ project. This might also help WAR a bug where the tool incorrectly prunes an object it shouldn't have.
|
|
Reserve Heap Space |
Amount of physical device heap space (MB) to automatically reserve for the frame debugger. |
|
Unweave Threads |
For multi-threaded applications, attempts to remove excessive context switching by grouping thread events together. May improve C++ capture replay performance of heavily threaded applications. |
| Option | Description |
|---|---|
|
Copy Acceleration Structure Geometry |
After building an acceleration structure, it is legal to update or destroy the geometry buffers used in construction. Without deep copies of the original data, the tool cannot guarantee full function of the acceleration structure viewer, or of C++ capture. For the sake of performance some activities will skip deep collection but will issue warnings if one of these operations is attempted. If no deep data is available, the original input buffers will be used in their current state.
|
|
Ignore Shallow Copy Warnings |
If an expert user knows that the original acceleration structure input data remains undisturbed they may silence warnings with this setting. |
|
Collect Geometry In GPU Memory |
By default acceleration structure deep copy data is collected in system memory, for stability reasons. Performance may be somewhat better doing the collection into GPU memory, but this puts pressure on the application's video memory budget. |
| Option | Description |
|---|---|
|
Enable Driver Instrumentation |
Controls the enablement of capabilities that require driver support. This effectively disables: Disabling this option is the first and best option to try if you run into capture errors as it disambiguates problems quickly given the number of subsystems it turns off. |
|
Collect Shader Source |
Controls the collection of shader source code associated with shader objects. This option is useful if you suspect an error or incompatibility with any of the shader processing libraries you use (such as D3DCompiler.dll). |
|
Collect Shader Disassembly |
Controls the collection of shader disassembly associated with shader objects. This option is useful if you suspect an error or incompatibility with any of the shader processing libraries you use (such as D3DCompiler.dll). |
|
Collect Shader Reflection |
Controls the collection of shader reflection associated with shader objects. This option is useful if you suspect an error or incompatibility with any of the shader processing libraries you use (such as D3DCompiler.dll). |
|
Collect Native Shaders |
Enable fetch of hardware native shaders which can be used to collect shader performance stats. |
|
Collect Hardware Performance Metrics |
Enables the collection of performance metrics from the hardware. |
|
Ignore Incompatibilities |
NVIDIA Nsight Graphics uses an incompatibility system to detect and report problems that are likely to interfere with the analysis of your application. By default, these incompatibilities are reported and the user is given the option of capturing despite them (with an associated warning of the possibility of issues). Some applications may have innocuous incompatibilities, however, and having to view this warning every time might be undesired. When this option is enabled, the frame will attempt to capture despite any incompatibilities. Use this option only when you are certain that the incompatibility will not impact your analysis. |
|
Block on First Incompatibility |
NVIDIA Nsight Graphics uses an incompatibility system to detect and report problems that are likely to interfere with the analysis of your application. In some cases, these incompatibilities may be the first sign of an impending failure. Accordingly, being able to block on such a reported failure may aid in triaging and understanding a crash when running under NVIDIA Nsight Graphics . This option is disabled by default so as not to interfere with expected operation, but it may be useful to toggle if you encounter an application crash under NVIDIA Nsight Graphics . |
|
Enable Crash Reporting |
Enables the collection and reporting of crash data to help identify issues with the frame debugger. While a user is always prompted before a crash report is sent, this option is available to suppress these facilities entirely. |
|
Enable C/C++ Serialization |
Enables the ability to serialize a capture to C/C++. By default, applications are available to create a C++ capture, but there are some cases where extra data is collected in support of this feature before it is invoked. This option allows that collection to be disabled entirely. |
|
Force Single-Threaded Capture |
Controls whether capture proceeds with concurrent threads or with serialized threads. Use this option if you suspect your application's multi-threading may be interfering with the capture process. |
|
Replay Thread Pause Strategy |
Controls the strategy used in live analysis for pausing threads.
|
Frame Debugging/Profiling UI
The Frame Debugger and Frame Profiler activities are capture-based activities. There are two classes of views in these activities – pre-capture views and post-capture views. Pre-capture views generally report real-time information on the application as it is running. Post-capture views show information related to the captured frame and are only available after an application has been captured for live analysis. For an example of how to capture, follow the example walkthrough in How to Launch and Connect to Your Application.
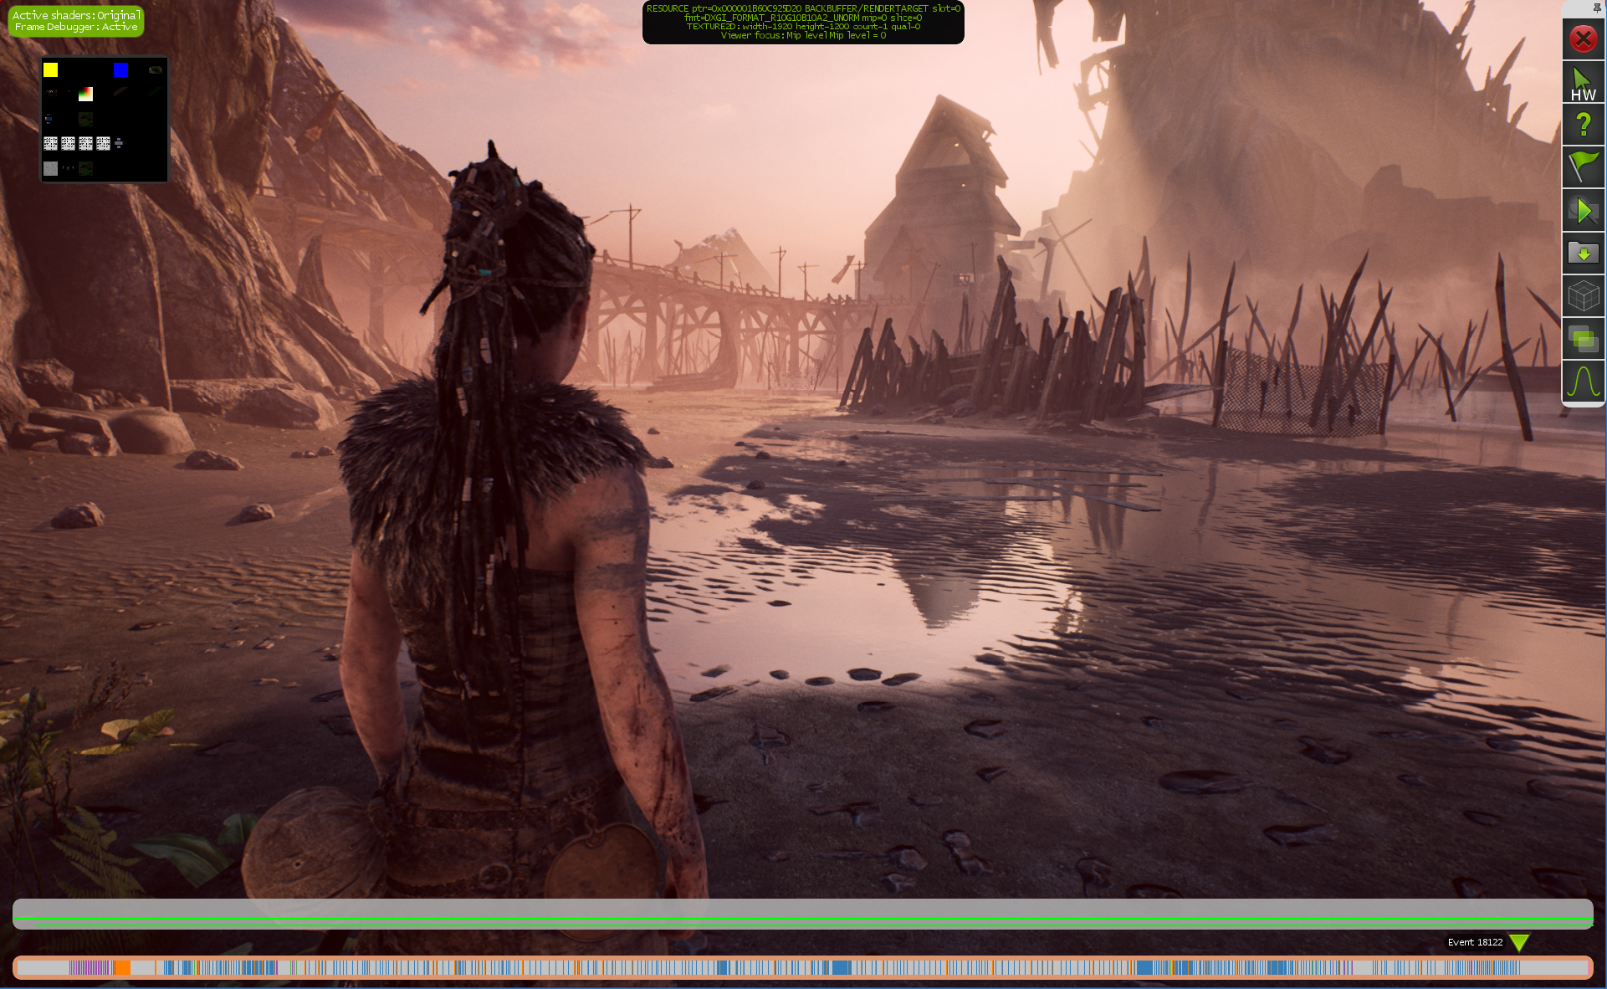
Application HUD
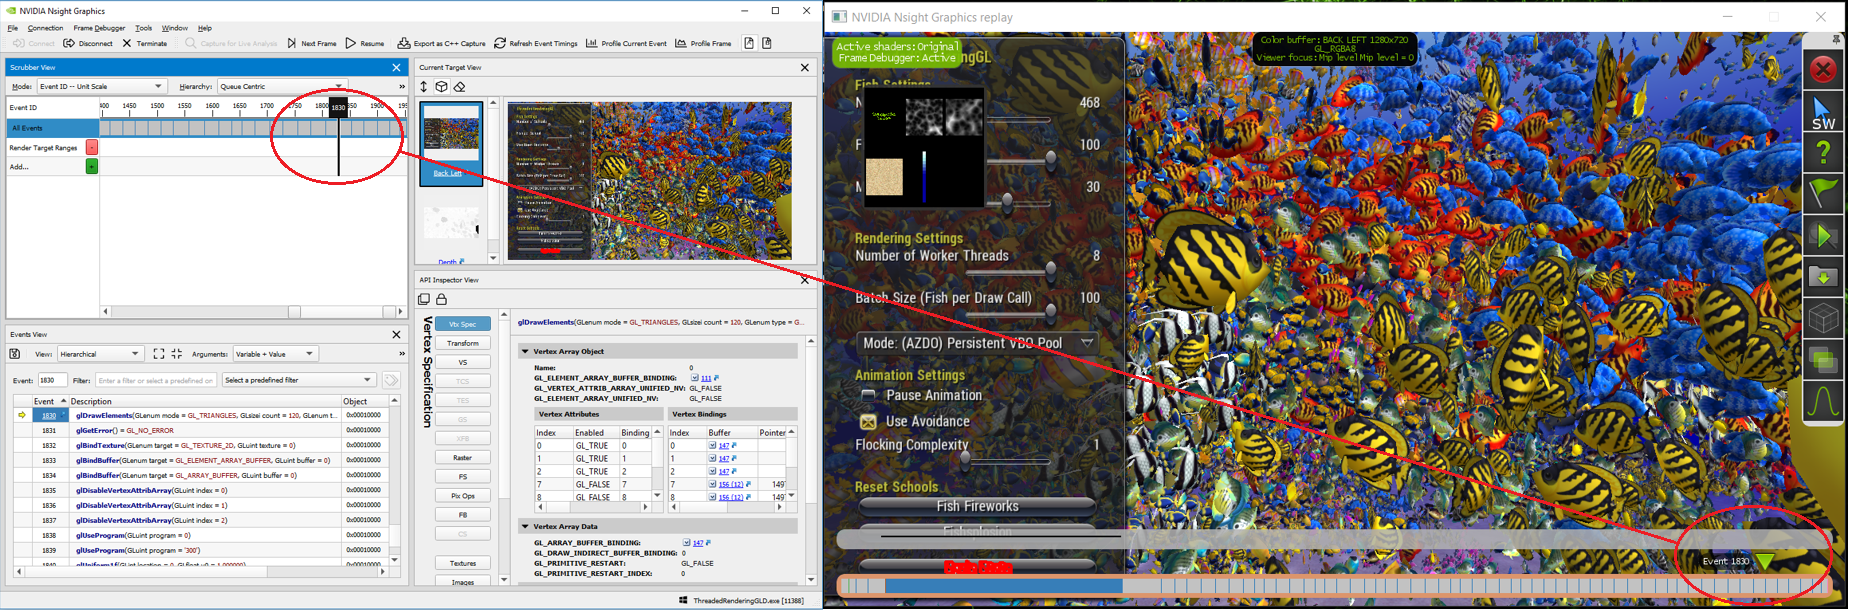
The Application HUD is a heads-up display which overlays directly on your application. You can use the HUD to capture a frame and subsequently scrub through its constituent draw calls on either the HUD or an attached host.
All actions that occur either in the HUD or on the host — such as capturing a frame or scrubbing to a specific draw call — are automatically synchronized between the HUD and the host, and thus you can switch between using the HUD and host UI seamlessly as needed.
The HUD has three (3) modes:
-
Running: Interact with your game or application normally, while the HUD shows an FPS counter. When you first start your application with NVIDIA Nsight Graphics, the HUD is in Running mode. This mode is most useful for viewing coarse GPU frame time in real-time while you run your application.
-
Activated: Once activated (using the activation hot-key toggle), the NVIDIA Nsight Graphics HUD allows the pause and capture of a frame from the running application.
-
Frame Debugger: Once you have captured a frame, you can debug the frame directly in the NVIDIA Nsight Graphics HUD (as well as from the host). The HUD allows you to scrub through the constituent draw calls of a frame, to view render targets with panning and zooming, and to examine specific values in those render targets.
Running Mode
In this mode, your application can interact with the game or application normally, and the HUD shows frame-time overlaid on the scene. When you first start your application with NVIDIA Nsight Graphics, the HUD is in Running mode.
To activate the HUD, make sure your graphics application has focus, and then enter the activation hot-key, CTRL+Z. The HUD is now in Activated mode.
Activated Mode
Once activated (using the activation hot-key toggle), the HUD allows you to capture your application. A toolbar containing common operations additionally becomes visible in this mode.
Frame Debugger Mode
Once you have captured a frame, you can debug the frame directly in the HUD. While you can also debug the frame on the host, the HUD allows you to scrub through the constituent draw calls of a frame, to view render targets with panning and zooming, and to examine specific values in those render targets.
| Hot Keys | Action |
|---|---|
|
CTRL + Plus (+) |
Zooms in |
|
CTRL + Minus (-) |
Zooms out |
|
CTRL + Zero (0) |
Makes the current texture go to a 1:1 ratio so that 1 texel fills 1 pixel. |
|
Left-click + drag on the scrubber at the bottom |
Views a particular draw call in your frame. You can hold SHIFT when scrubbing for more scrub precision, which is especially useful when looking at frames with a large number of draw calls. When the desired draw call is active, release the left mouse button. The geometry for the currently active draw call will be highlighted, as long as it is on screen. |
|
Left-click + drag on a render target |
Pans and zooms the currently displayed render target. Use the mouse wheel to zoom in to a particular portion of the render target. |
|
CTRL + mouse over a render target |
Shows the value for the currently displayed render target. A small display window will show you a high-zoom view of the pixels in the area, and the value of the current pixel that the mouse is hovering over. |
To switch the display to another active render target:
-
Click the Select Render Target button on the HUD toolbar.
-
A drop-down menu will appear, showing all valid choices for the current draw call. Select the desired render target.
-
Note that if a selected render target is not still active for a different draw call, the display will automatically switch to an active render target.
When you start debugging your graphics application with NVIDIA Nsight Graphics, the target computer will begin running the application. You will notice a HUD toolbar overlaid on top of your application. At this point, your application is considered to be in run mode.
There are two different methods to pause the application, which causes it to enter Frame Debugger mode.
-
Press CTRL+Z and the spacebar on the target machine; or
-
Go to the main toolbar and select Pause and Capture Frame.
After you enter Replay Mode, you will see several features overlaid on top of the application, such as timelines of draw call events and performance markers. Perhaps the most notable of these features is the HUD Toolbar, which allows you to work with your application on the target computer itself.
| HUD ICON | DEFINITION |
|---|---|
|
Hides the GUI so you can view more of your application. |
|
|
Switches between a hardware and software cursor. |
|
|
Displays the Help menu, showing all available commands. |
|
|
Selects a view of event ranges. |
|
|
Exits the frame debugger and resumes your application. |
|
|
Saves a frame capture to a file. By default, files are saved to: Documents\NVIDIA Nsight Graphics\Captures |
|
|
Changes the current object wireframe rendering method. |
|
|
Changes the current render target display from the color buffer to depth or stencil. |
|
|
Toggle the normalization view of the texture display. |
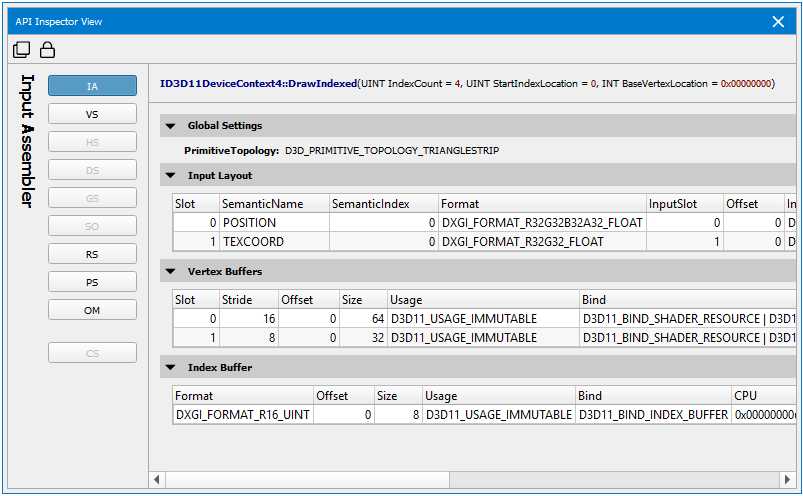
API Inspector
The API inspector is a common view to all supported APIs that offers an exhaustive look at all of the state that is relevant to a particular event to which the capture analysis is scrubbed.
To access this view, go to Frame Debugger > API Inspector.
To access this view, go to Nsight > Windows > API Inspector.
While the view is common, the state within it is particular to each API. See the section below that relates to your API of interest.
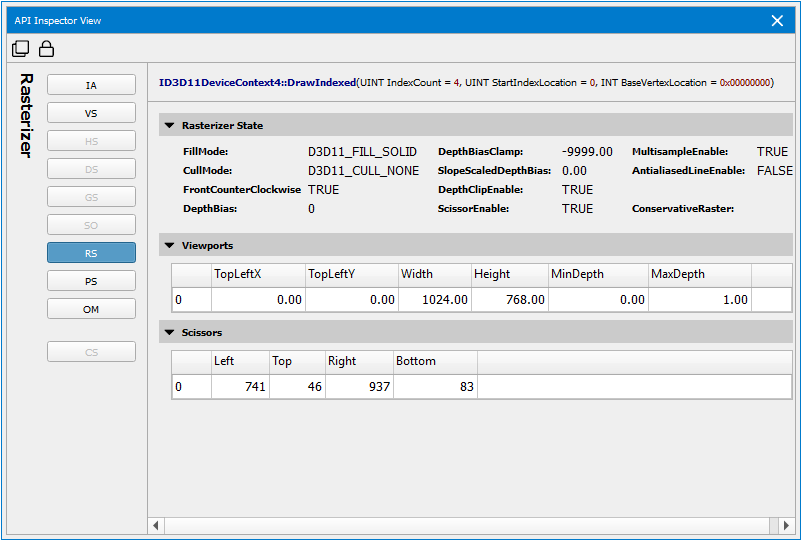
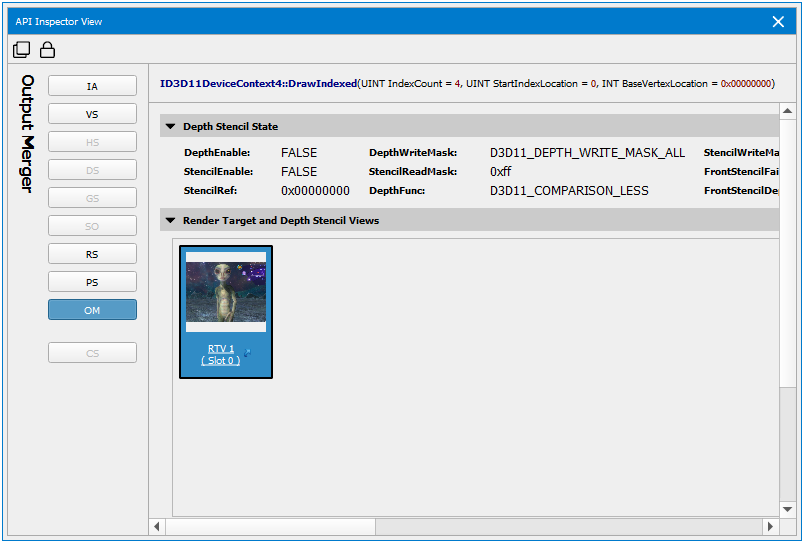
D3D11 API Inspector
The API Inspector view has an API-specific pipeline navigator that allows you to select a particular group of state within the GPU pipeline. From here, you can inspect the API state for each stage, including what textures and render targets are bound, or which shaders are in use in the related constants. Note that if a stage is not active (either there is nothing bound to that stage or it doesn’t apply for the current action) it will be greyed out, but you you can still click on it to inspect the state.
Pipeline Stages
The following table shows the stages that are available for inspection:
-
IA —The Input Assembler shows the layout of your vertex buffers and index buffers.
-
VS — Shows all of the shader resource views and constant buffers bound to the Vertex Shader stage, as well as links to the HLSL source code and other shader information.
-
HS — This shows all of the shader resource views and constant buffers bound to the Hull Shader stage, as well as links to the HLSL source code and other shader information.
-
DS — This shows all of the shader resource views and constant buffer bound to the Domain Shader stage, as well as links to the HLSL source code and other shader information.
-
GS — Shows all of the shader resource views and constant buffers bound to the Geometry Shader stage, as well as links to the HLSL source code and other shader information.
-
SO — Shows the resources bound for Stream Output.
-
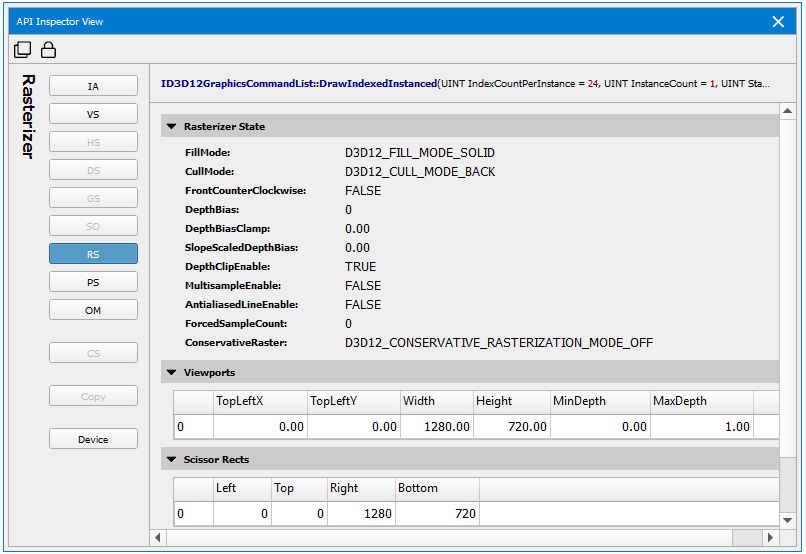
RS — Shows the Rasterizer State parameters, including culling mode, scissor and viewport rectangles, etc.
-
PS — Shows all of the shader resource views, constant buffers, and render target views bound to the Pixel Shader stage, as well as links to the HLSL source code and other shader information.
-
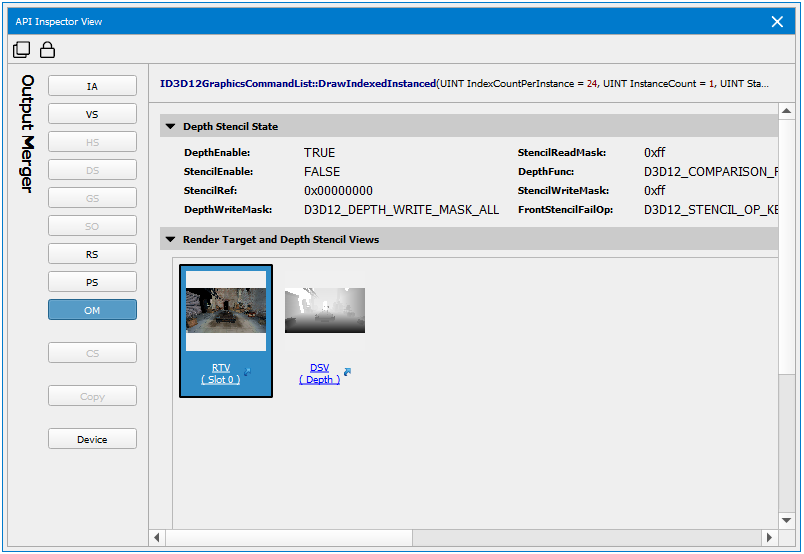
OM — Shows the Output Merger parameters, including blending setup, depth, stencil, render target views, etc.
-
CS — This shows all of the shader resource and unordered access views and constant buffers bound to the Compute Shader stage, as well as links to the HLSL source code and other shader information.
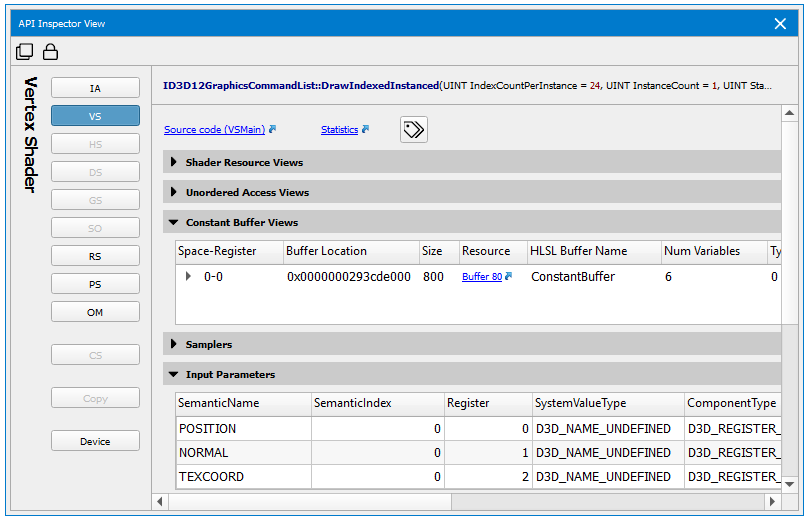
Shaders (VS, HS, DS, GS, PS, CS)
The various shader pages display all of the constant buffers, shader resource views, and input/output parameters, as well as links to the HLSL source code and other shader information.
In the constant buffer list, you can expand the buffer to see which HLSL variables are mapped to each entry, as well as the current values.
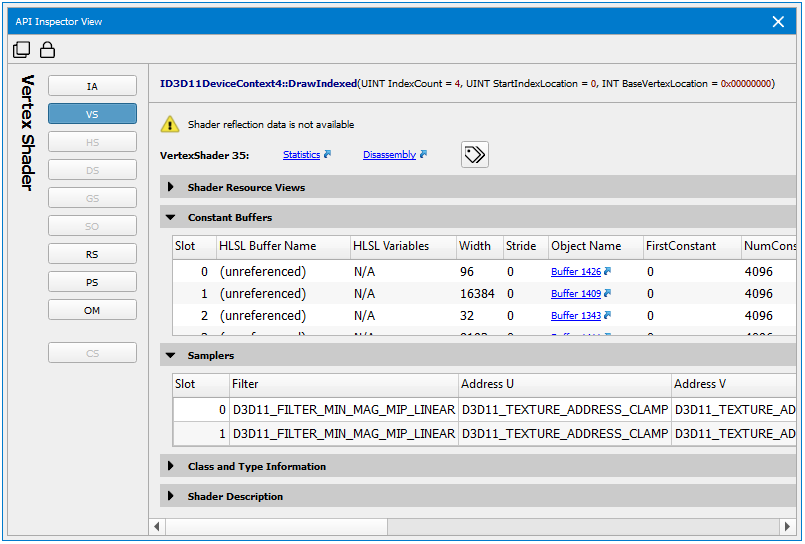
To enable resolution of HLSL variables, you must enable debug info when compiling the shader. See Shader Compilation for a discussion of the parameters required to prepare your shaders for optimal usage within NVIDIA Nsight Graphics.
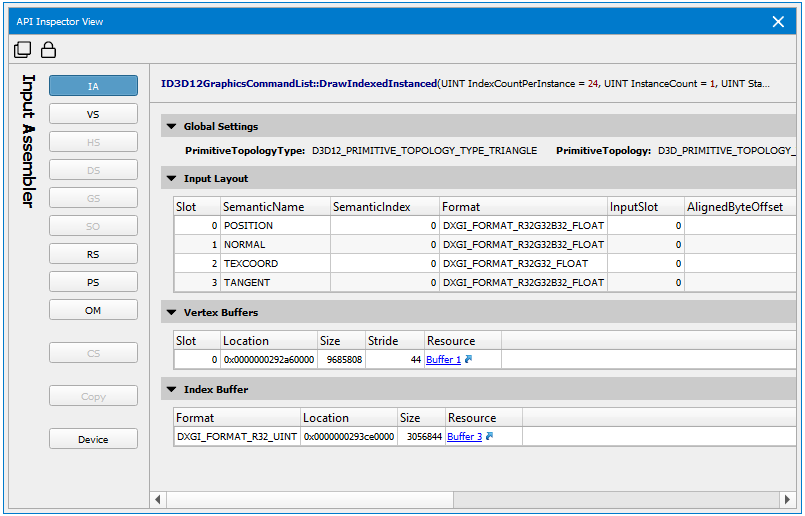
D3D12 API Inspector
The API Inspector view has an API-specific pipeline navigator that allows you to select a particular group of state within the GPU pipeline. From here, you can inspect the API state for each stage, including what textures and render targets are bound, or which shaders are in use in the related constants. Note that if a stage is not active (either there is nothing bound to that stage or it doesn’t apply for the current action) it will be greyed out, but you can still click on it to inspect the state.
Pipeline Stages
The following table shows the stages that are available for inspection:
-
IA — The Input Assembler shows the layout of your vertex buffers and index buffers.
-
VS — Shows all of the shader resource views and constant buffers bound to the Vertex Shader stage, as well as links to the HLSL source code and other shader information.
-
HS — This shows all of the shader resource views and constant buffers bound to the Hull Shader stage, as well as links to the HLSL source code and other shader information.
-
DS — This shows all of the shader resource views and constant buffer bound to the Domain Shader stage, as well as links to the HLSL source code and other shader information.
-
GS — Shows all of the shader resource views and constant buffers bound to the Geometry Shader stage, as well as links to the HLSL source code and other shader information.
-
SO — Shows the resources bound for Stream Output.
-
RS — Shows the Rasterizer State parameters, including culling mode, scissor and viewport rectangles, etc.
-
PS — Shows all of the shader resource views, constant buffers, and render target views bound to the Pixel Shader stage, as well as links to the HLSL source code and other shader information.
-
OM — Shows the Output Merger parameters, including blending setup, depth, stencil, render target views, etc.
-
CS — This shows all of the shader resource and unordered access views and constant buffers bound to the Compute Shader stage, as well as links to the HLSL source code and other shader information.
Shaders (VS, HS, DS, GS, PS, CS)
The various shader pages display all of the constant buffers, shader resource views, and input/output parameters, as well as links to the HLSL source code and other shader information.
In the constant buffer list, you can expand the buffer to see which HLSL variables are mapped to each entry, as well as the current values.
To enable resolution of HLSL variables, you must enable debug info when compiling the shader. See Shader Compilation for a discussion of the parameters required to prepare your shaders for optimal usage within NVIDIA Nsight Graphics.
OpenGL API Inspector
When using the Frame Debugger feature of NVIDIA Nsight Graphics, you may wish to do a deep dive into the specific draw calls in order to analyze your application further. There are three different categories of API Inspector navigation.
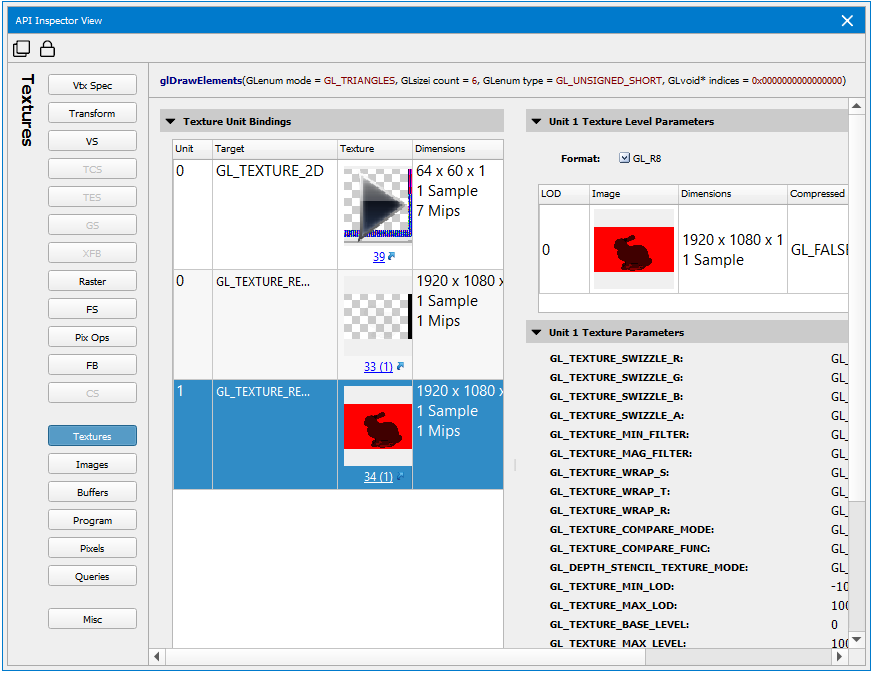
Pipeline Stages
The first category is laid out like a "virtual GPU pipeline." This pipeline section of the API Inspector consists of the following:
-
Vtx Spec (Vertex Specification) — State information associated with your vertex attributes, vertex array object state, element array buffer, and draw indirect buffer.
-
VS (Vertex Shader) — Vertex shader state, including attributes, samplers, uniforms, etc.
-
TCS (Tessellation Control Shader) — Tessellation control shader state, including attributes, samplers, uniforms, control state, etc.
-
TES (Tessellation Evaluation Shader) — Tessellation evaluation shader state, including attributes, samplers, uniforms, evaluation state, etc.
-
GS (Geometry Shader) — Geometry shader state, including attributes, samplers, uniforms, geometry state, etc.
-
XFB (Transform Feedback) — Transform feedback state, including object state and bound buffers.
-
Raster (Rasterizer) — Rasterizer state, including point, line, and polygon state, culling state, multisampling state, etc.
-
FS (Fragment Shader) — Fragment shader state, including attributes, samplers, uniforms, etc.
-
Pix Ops (Pixel Operations) — State information for pixel operations, including blend settings, depth and stencil state, etc.
-
FB (Framebuffer) — State of the currently drawn framebuffer, including the default framebuffer, read buffer, draw buffer, etc.
Object and Pixel State Inspectors
The object and pixel state inspectors section of the API Inspector consists of the following:
-
Textures — Details about all of the currently bound textures and samplers, including texture and sampler parameters.
-
Images — Details about all of the images currently bound to the image units.
-
Buffers — Details about all of the bound buffer objects, including size, usage, etc.
-
Program — Information about the currently bound program object and/or pipeline program pipeline object, including shaders, active uniforms, etc.
-
Pixels — Current settings for pixel pack and unpack state.
Miscellaneous
The miscellaneous screen contains additional information such as shader limits, implementation dependent values, transform feedback limits, and various minimum/maximum values.
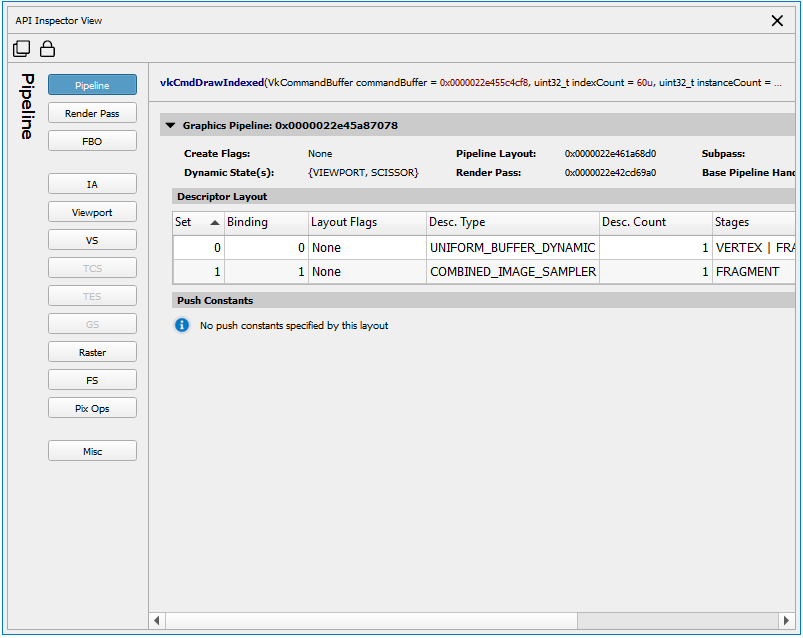
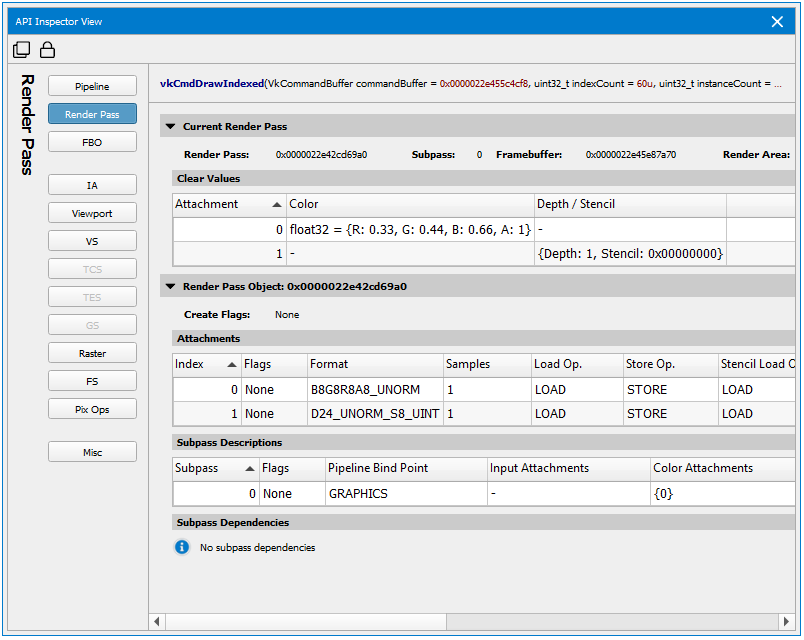
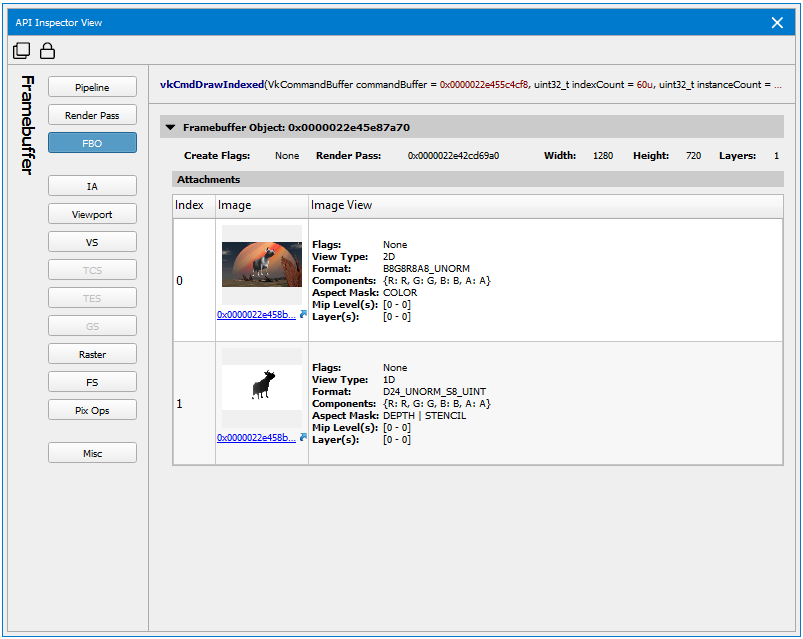
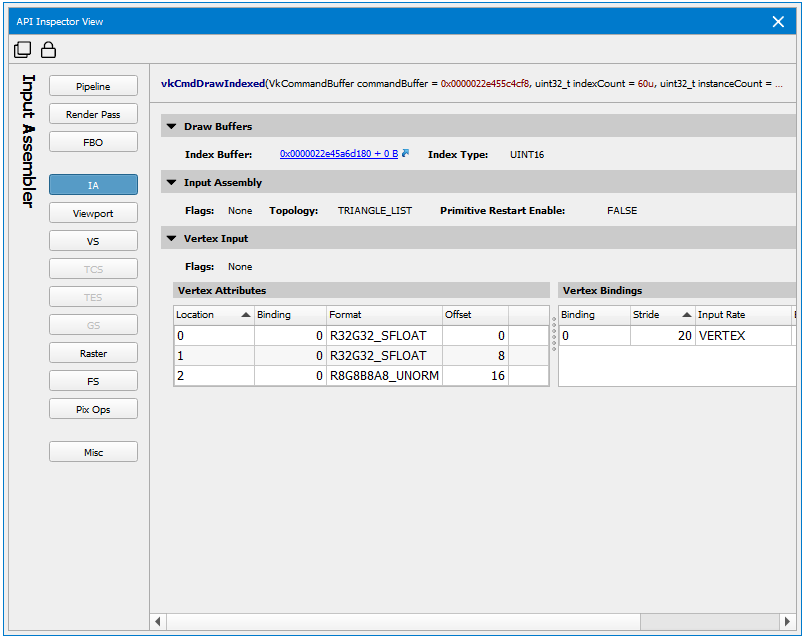
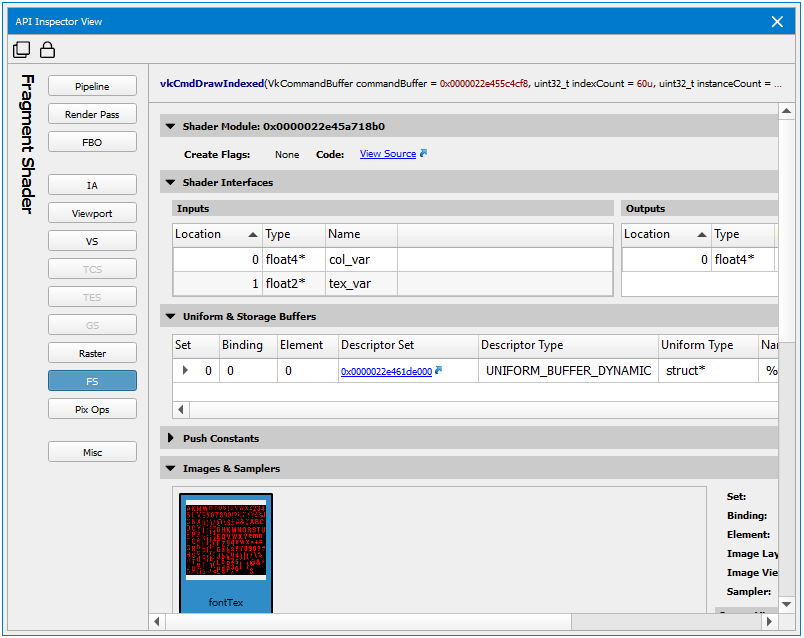
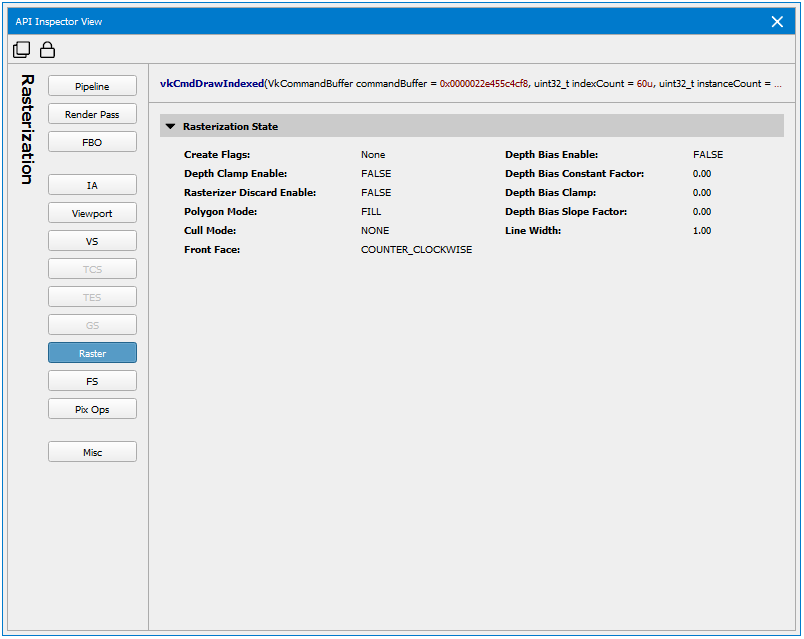
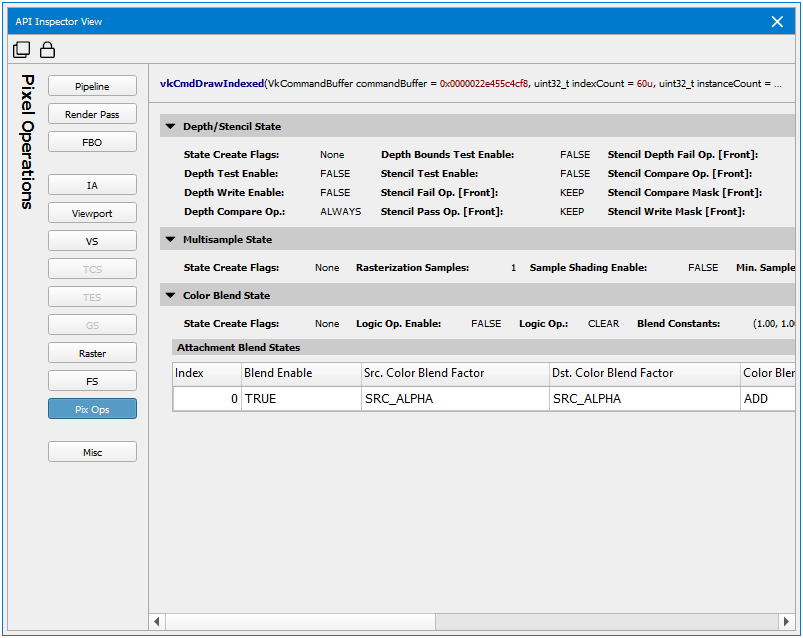
Vulkan API Inspector
The API Inspector view has an API-specific pipeline navigator that allows you to select a particular group of state within the GPU pipeline. From here, you can inspect the API state for each stage, including what textures and render targets are bound, or which shaders are in use in the related constants. Note that if a stage is not active (either there is nothing bound to that stage or it doesn’t apply for the current action) it will be greyed out, but you you can still click on it to inspect the state.
Pipeline Stages
The following table shows the stages that are available for inspection:
-
Pipeline — Shows information about the currently bound pipeline object.
-
Render Pass — Shows information about the current render pass object.
-
FBO — Shows information related to the Frame Buffer Object that is associated with the current render pass.
-
IA — The Input Assembler shows the layout of your vertex buffers and index buffers.
-
Viewport — Shows the current viewport and scissor information.
-
VS — Shows all of the shader resource views and constant buffers bound to the Vertex Shader stage.
-
TCS — Shows all of the shader resources associated with the Tessellation Control Shader stage.
-
TES — Shows all of the shader resources associated with the Tessellation Evaluation Shader stage.
-
GS — Shows all of the shader resource views and constant buffers bound to the Geometry Shader stage.
-
SO — Shows the resources bound for Stream Output.
-
Raster — Shows the Rasterizer State parameters, including culling mode, scissor and viewport rectangles, etc.
-
FS — Shows all of the shader resources associated with the Fragment Shader stage.
-
Pix Ops — Shows the Pixel Operations parameters, including depth/stencil, multi-sample, and blending states.
-
Compute — This shows all of the shader resource and unordered access views and constant buffers bound to the Compute Shader stage.
-
Misc - Shows miscellaneous information associated with the instance, physical devices, and logical devices.
Current Target View
The Current Target view is used to show the currently bound output targets. This can be useful because it focuses in on the bound output resources, rather than having to search for them in the Resources view.
To access this view, go to Frame Debugger > Current Target.
To access this view, go to Nsight > Windows > Current Target.
Current Target will display thumbnails along the left pane for all currently bound color, depth, and stencil targets. This view will change as you scrub from event to event. All of the thumbnails on the left can be selected to show a larger image on the right. You can also click the link below each to open the target in the Resources View.
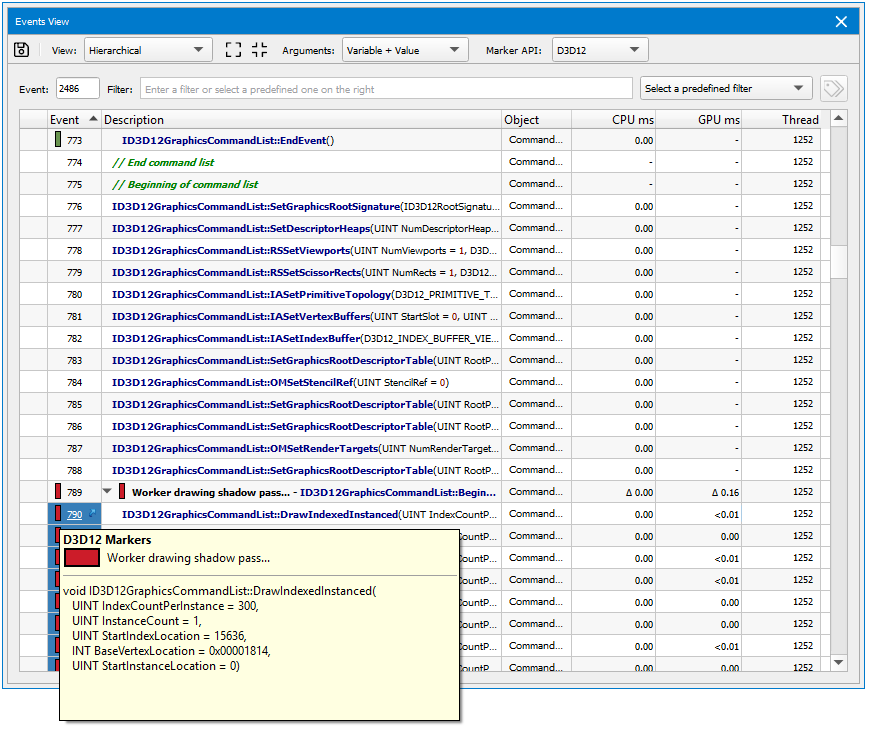
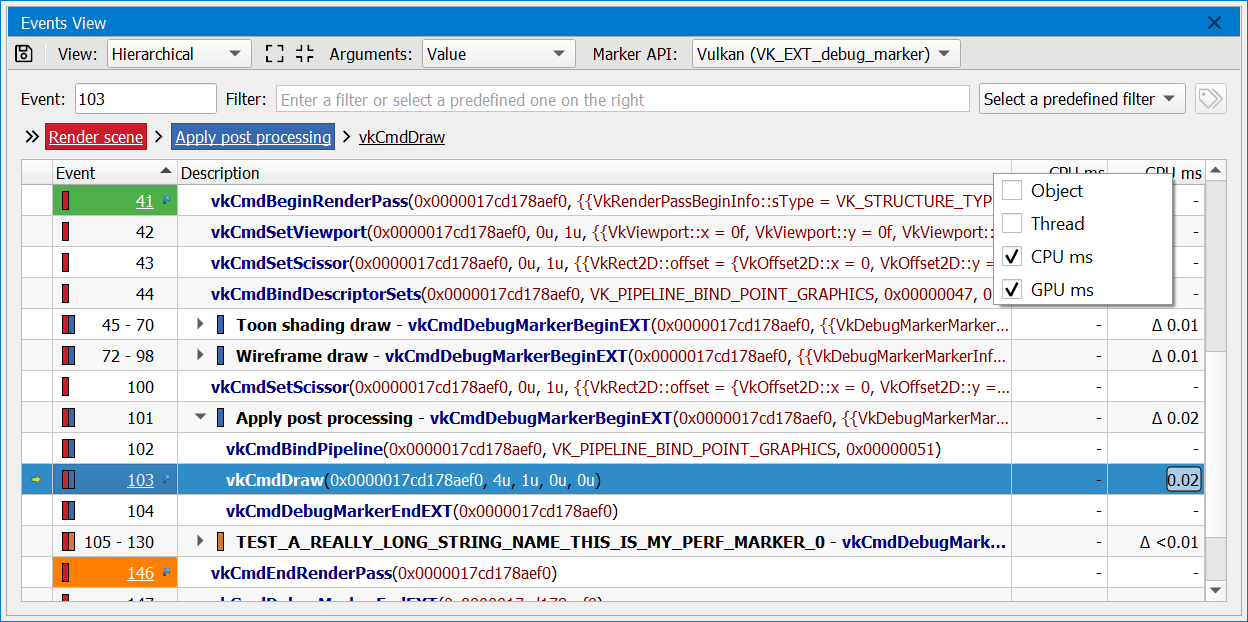
Event Viewer
The Events view shows all API calls in a captured frame. It also displays both CPU and GPU activity, as a measurement of how much each call "cost."
To access this view, go to Frame Debugger > Events.
To access this view, go to Nsight > Windows > Events View.
To add context to each API call, the thread ID and object/context that made that call are offered. Nsight also supports application-generated object and thread names in these columns; see Naming Objects and Threads for guidance on the supported methods for setting these names.
Clicking a hyperlink in the Events column will bring you to the API Inspector page for that draw call.
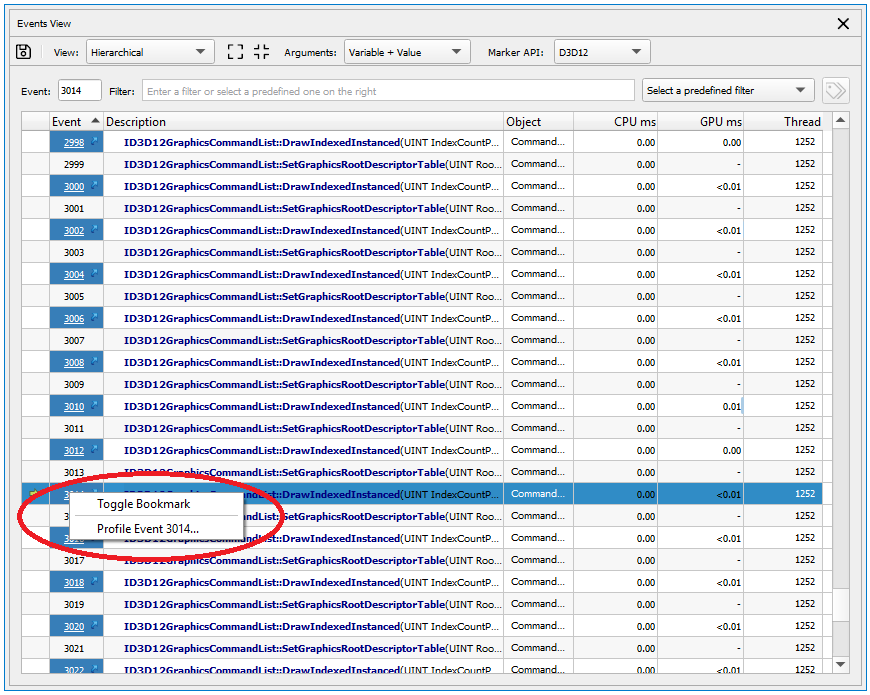
Right-clicking on an event or a push/pop range in the Events column will allow you to profile that specific event or range with the Range Profiler.
You can select whether to view the events in a hierarchical or flat view. If multiple performance marker types are used, you can select the correct one, as well as varying levels of verbosity for the call display (variable + value, value, or none). You can also sort the events by clicking on any of the available column headers.
The visibility of columns can be toggled by right-clicking on the table's header. By default some columns will be hidden if they offer no unique data (e.g. single thread) for the captured frame.
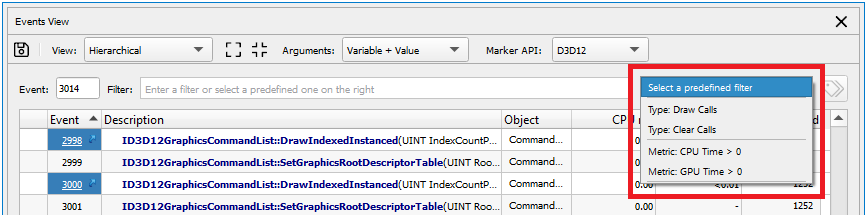
Filtering Events
There are two different ways to filter the events list.
-
You can select one of the available predefined filters. These offer a set of valuable, built-in filters for events of interest. This is also a great way to learn about the various filtering expressions that are supported, as many of them demonstrate advanced filtering techniques.
-
You can type in your own filter, which will narrow the list of events to those containing your search string. This filter may be plain text, a regular expression, or a JavaScript expression that does column-specific searches. Select a predefined filter to see examples of JavaScript expressions.
Regex Syntax
This syntax is implemented with a perl-compatible regular expression syntax. Here are some examples of common tasks and the expressions that achieve them:
JavaScript Syntax
JavaScript syntax enables complex evaluation of filtering expressions. The basic approach for JavaScript expressions is to match a particular column of data against an expression. Columns are "accessed" via a $('ColumnName') expression. For example, a column titled "Description" is accessed via $('Description'). From there, you can perform mathematical, logical, and text-matching expressions. See some examples below to demonstrate the power and usage of these expressions:
| Task | Expression |
|---|---|
|
Match against the description column for draw |
/::Draw/.test($('Description')) |
|
Find events with non-zero GPU time |
$('GPU ms') > 0 |
|
Find odd events |
($('Event') % 2) == 1 |
|
Find non-draw events with non-zero GPU time |
/::Draw/.test($('Description')) != 1 && $('GPU ms') > 0 |
Bookmarking
While filtering, it is often desired to keep the context of certain items while you find others. To prevent an event from being filtered, right click the event and select Toggle Bookmark.
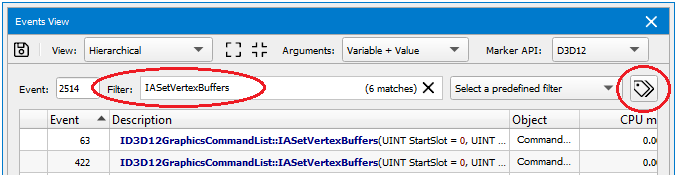
If you wish to see the filtered results on the scrubber, you can select the tag button to the right of the filter toolbar, and a new row will appear in the Scrubber that displays your filtered events, allowing you to navigate those events in isolation.
Perf Markers
On the Events page, you can use the hierarchical view to see a tree view of performance markers. The items listed in the drop-downs correspond with the nested child perf markers on the Scrubber.
If you use the flat view on the Events page, the perf marker won't be nested, but you can hover your mouse over the color-coded field in the far left column, which allows you to view the details about that perf marker.
When an application uses multiple kinds of perf markers, the Marker API allows selecting the API to use for the display. This situation may arise if the application uses a middleware, for example, or mixes components with different marker strategies.
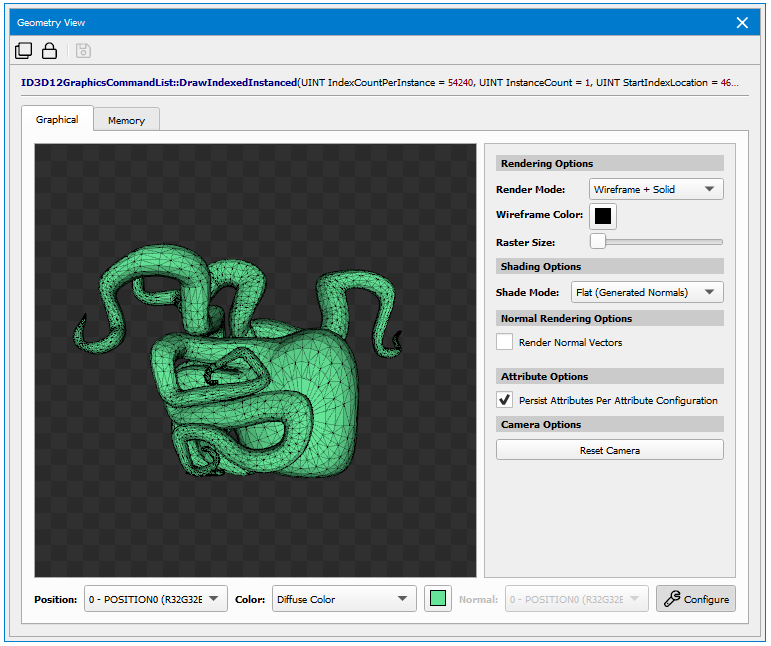
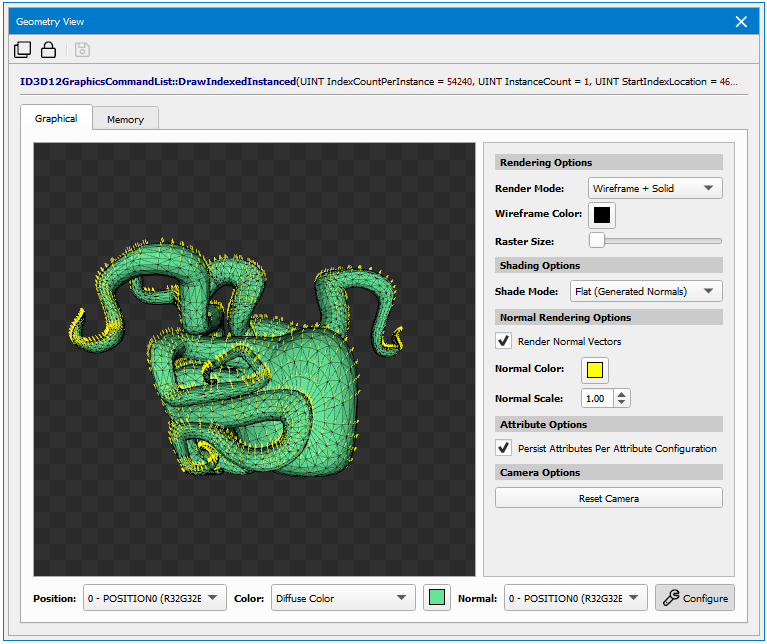
Geometry View
The Geometry view takes the state of the Direct3D, OpenGL, or Vulkan machine, along with the parameters for the current draw call, and shows pre-transformed geometry.
To access this View, go to Frame Debugger > Geometry.
To access this View, go to Nsight > Windows > Geometry View.
There are two views into this data: a graphical view and a memory view.
Graphical Tab
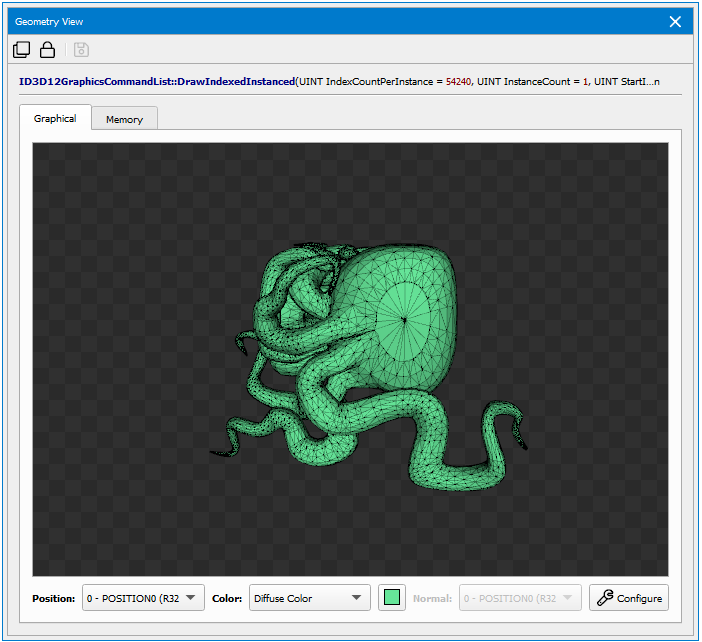
Attribute Options
-
Position — Specifies the vertex attribute to use for positional geometry data.
-
Color — Specifies how to color the geometry. If Diffuse Color is selected, the selected diffuse color swatch will be used for coloring. If a vertex attribute is selected, the selected attribute will be used for per-vertex coloring.
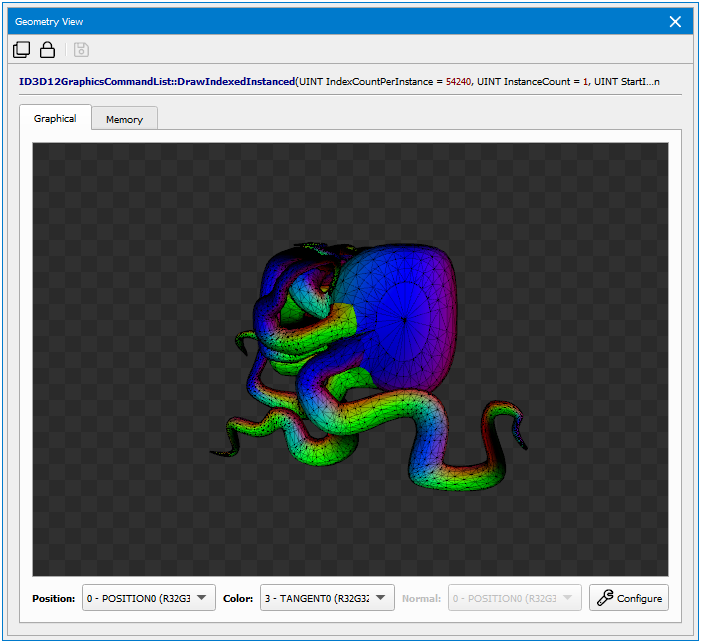
-
Normal — Specifies the per-vertex normal. This selection applies when using a shade mode that specifies Normal Attribute or when rendering normal vectors.
Rendering Options
Clicking Configure in the bottom right corner of the Geometry View will open up the rendering options menu.
-
Reset Camera — Resets the camera to its default orientation. By default, the viewer bounds all geometry with a bounding sphere for optimal orientation.
-
Render Mode — Determines how to render and raster geometry.
-
Solid: renders filled geometry.
-
Points: renders a vertex point cloud.
-
Wireframe: renders a wireframe of the geometry.
-
Wireframe + Solid: renders filled geometry with a wireframe on top of it.
-
-
Shade Mode — Specifies the lighting mode of the rendered image.
-
Selected Color Attribute: Shades with the specified color attribute
-
Flat Shading Using Generated Normals: Renders the geometry using flat shading with calculated normals
-
Flat Sharing Using Normal Attribute: Renders the geometry using flat shading with the specified Normal Attribute.
-
Smooth Shading Using Normal Attribute: Renders the geometry using smooth shading with the specified Normal Attribute.
-
-
Render Normal Vectors — Renders the specified normal attribute as a vector pointing from each vertex. The vector may be colored by the Normal Color selection and may be scaled by the Normal Scale selection.
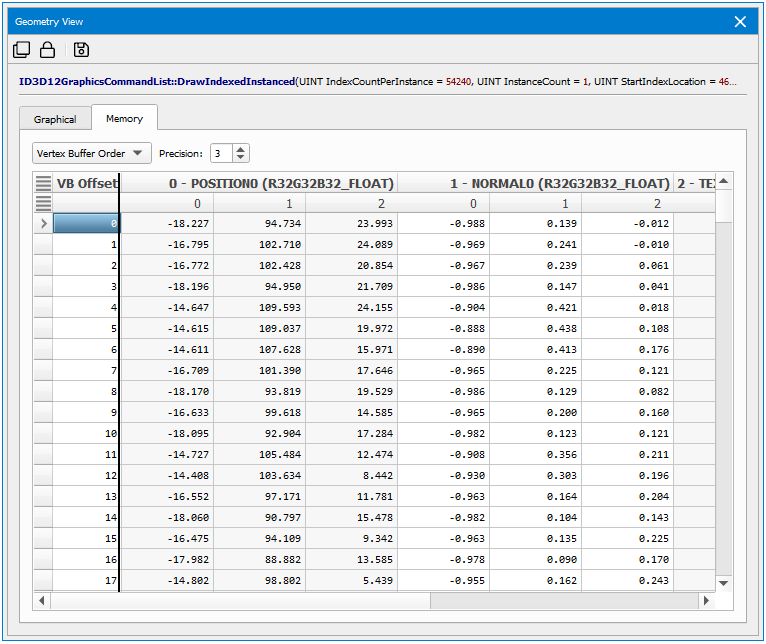
Memory Tab
The Memory tab of the Geometry View shows the contents of the vertex buffer, as interpreted by the current vertex or input attribute specification. This view is useful for seeing the raw data of your draw call. An additional capability of this view is that it highlights invalid or corrupt vertices to streamline finding problematic data.
There are two modes of display for the geometry data:
-
Index Buffer Order shows the vertices as indexed by the current index buffer and current draw call.
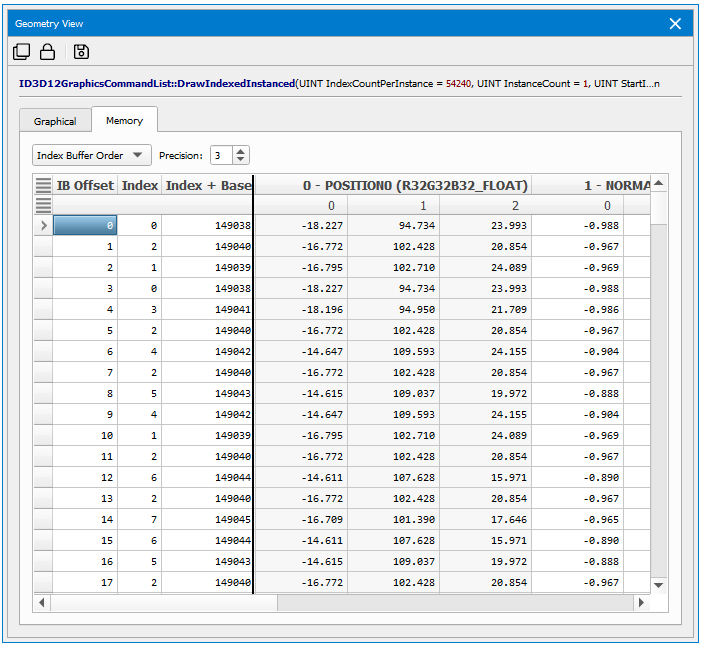
-
Vertex Buffer Order shows the vertices as linearly laid out from the start of the vertex buffer and draw call specification.
Range Profiler
The Range Profiler is a powerful tool that can help you determine how various portions of your frame utilize the GPU, and give you direction to optimize the rendering of your application. Once you have captured a frame, the Range Profiler displays your frame broken down into a collection of ranges, or groups of contiguous actions. For each range, you can see the GPU execution time, as well as detailed GPU hardware statistics across all of the units in the GPU. The Range Profiler also includes unmatched data mining capabilities that allow you to group calls in the frame into ranges based on various criteria that you choose.
To access this view, go to Frame Debugger > Range Profiler.
To access this view, go to Nsight > Windows > Range Profiler View.
Note that the legacy Range Profiler, that is not user configurable, is still available. From the same menu, simply select Range Profiler (Legacy). This will be removed in a future release.
The Range Profiler initially appears with the Range Selector at the top, followed by 5 default sections below that: Range Info, Pipeline Overview, SM Section, Memory, and User Metrics.
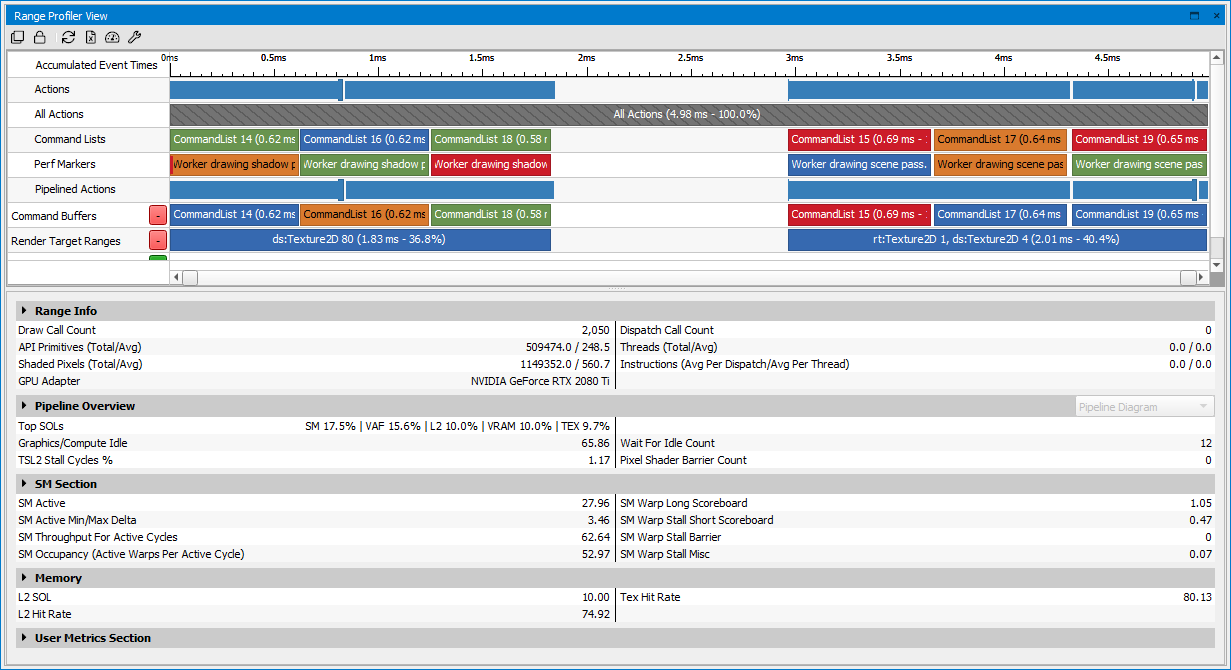
Range Selector
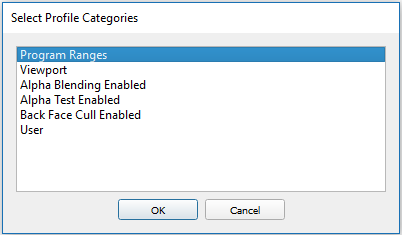
The Range Selector provides an overview of the various rendering activities or passes in the scene. You can see how long each portion of the frame takes, and compare the length or cost of the ranges on the timeline. When it first opens, the Range Selector will show ranges based on the performance markers you have instrumented your application with. The tool supports various APIs for instrumentation, including the NVIDIA NVTX library, Knronos' KHR_debug, or any other range definition API supported by your graphics API of choice. While performance markers are the best way to specify ranges and are utilized throughout the entire Nsight Graphics, UI, there are other facilities for creating ranges on the fly. The Range Selector Clicking the Add... button will open a dialog that allows you to select what type of range you want to add.
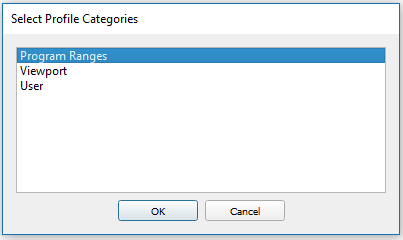
-
Program ranges — Actions that use the same shader program.
-
Viewport ranges — Actions that render to the same viewport rectangle.
-
User ranges — A range defined by you on the fly. Use SHIFT + left-click and drag the scrubber on the created "User" row to create a new range. This can be helpful to drill into a section of the scene, or to compare different frame sections that don’t already have ranges defined for it.
When you click on a range on the Scrubber portion, the other sections of the Range Profiler View will automatically update with that selected range's information. You can also click on a single action in the Scrubber to profile only that action.
Sections
The Range Profiler comes with 5 default sections: Range Info, Pipeline Overview, SM Section, Memory, and User Metrics Section. The section headers have a small triangle to the left of the name that allows you to collapse or open each one. The sections have a different look when collapsed vs open, mainly giving high level information when collapsed, and fuller data when opened. Some of these sections also have combo boxes on the right side of the section header that allows you to choose the different visualizations available for displaying the data. Finally, there are tooltips enabled on the metrics, which can give further details on what is being measured.
Range Info
The Range Info section gives you basic information about the selected range, split up with the draw calls on the left-hand side, and the compute dispatches on the right-hand side. For the draw calls, there is the number of calls in the range as well as the number of primitives and pixels rendered, both total and average per draw call. On the compute side, there is similarly the number of calls, as well as thread and instruction counts, both total and average.
When you open up the section, there is a table that has many of the metrics on the collapsed view, and adds some additional metrics for primitive counts, z-culling, etc.
Pipeline Overview
The Pipeline Overview section gives an overview of how the selected ranges utilized the GPU. It does this by calculating a througput or Speed of Light (or SOL) for each unit in the pipeline.
Speed of Light (SOL): This metric gives an idea of how close the workload came to the maximum throughput of one of the sub-units of the GPU unit in question. The idea is that, for the given amount of time the workload was in the GPU, there is a maximum amount of work that could be done in that unit. These values can include attributes fetched, fragments rasterized, pixels blended, etc. Any value less than 100% indicates that the unit did not process the maximum amount of work possible.
When you open the Pipeline Overview section, you are presented with a visual representation of the GPU pipeline, and color bars indicating the SOL or throughput for each unit represented. You can use the combo box on the right side of the header to display a table of metrics for every action in the currently selected range.
SM Section
When collapsed, the SM Section has 2 main columns of data. On the left is a list of metrics about how utilized the SM (shader) units are in the GPU. SM Active tells you how many cycles the SM active and working during the measurement timeframe. SM Active Min/Max Delta gives an idea of the variance of work across all of the shader units in the GPU. If this value is low, this indicates that the workload is running only on a few SMs, either because of screen locality for pixel work or possibly that a compute dispatch was so small that it only occupied a small portion of the shader unit. The SM Throughput for Active Cycles indicates the same value as the throughput or SOL value in the Pipeline Overview, but only measures it when the shader unit is active. Finally, the SM Occupancy value gives you a percentage of how full the shader unit was with warps. Occupancy is key to hide latency, and things like register count and local memory usage in shaders can limit the number of warps. When there is not a warp eligible to issue an instruction, the SM is not able to do any work.
Related to the occupancy value, the right hand side shows typical instruction stall reasons, including long scoreboard (when the shader was waiting on a texture access), barrier (when the shader was waiting for other warps to get to a given instruction), etc.
When you open the SM Section using the top left triangle, you will see a table that includes SM statistics on the left, including thread mix based on shader type, and all of the warp stall reasons on the right.
Memory
The Memory section displays information about the L2 cache and Frame Buffer or memory unit. Each interface has a maximum throughput for a given amount of time. The memory section shows the percentage of the subsystem interfaces utilized for the current range.
When you open the section using the upper left triangle, you will see a diagram of the memory subsystem and the percentage indicating the amount of bandwidth our throughput each unit/interconnect utilized in the sampling experiment.
User Metrics Section
The User Metrics Section gives the user the opportunity to explore all of the metrics that are available in the Range Profiler. It is initially collapsed, but when you click the upper left triangle, 2 tables will appear. The left hand table lists the metrics with their name and a short description, as well as a check box to enable that metric for measurement. You can search for metrics of interest by using the filter box above the metric list. This will filter the metrics to a subset that matches the text you specify, which can be a GPU unit name, part of a metric value, etc.
When you select a metric, you will see a new entry appear in the right hand side table. Initially, you will likely see "…" appear for the value, which indicates that the tool is running the necessary experiments to retrieve the value. Once that is complete, the value will fill in.
Above the metric value table is a Transpose button. You can use this to transpose the table from column to row major and back.
Configuring The Range Profiler
The Range Profiler is user configurable via editing .section text files or .py python scripts.
By default, NVIDIA Nsight Graphics™ ships with 4 .section files and 1 .py file. The .section files are able to display metrics only. The .py files can do everything the .section files can do (albeit with different syntax), and can also define rules. More on that below.
Each section can have a collapsed or Header view, and an expanded or Body view. The default sections, in order of display, contain the following information:
| Section | Header | Body |
|---|---|---|
|
RangeInfo.py |
Table of draw & dispatch values |
Table of more detailed values |
|
PipelineOverview.section |
Table of values for SOL, etc. |
Pipeline Diagram |
|
Shaders.section |
Table of shader details |
Table of more detailed values |
|
SMSection.section |
Table of high-level metrics and common stall reasons |
Table with more SM details and all stall reasons |
|
MemorySection.section |
Table of cache hit rates, etc. |
Memory Diagram |
|
UserMetrics.section |
Empty |
User Metrics tables |
The view can be modified on the fly by clicking the wrench icon in the toolbar. This will bring up a dialog that allows you to enable/disable the available list of metrics on the top, as well as specify what directories to load section files from and enable/disable the paths on the bottom.
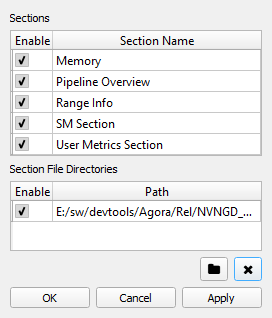
If you click Apply, the view will reload with your new choices, but the dialog will remain open for further editing. If you click OK, the view will similarly be updated, but the dialog will also be closed. Finally, Cancel will close the dialog and discard any changes that were not applied.
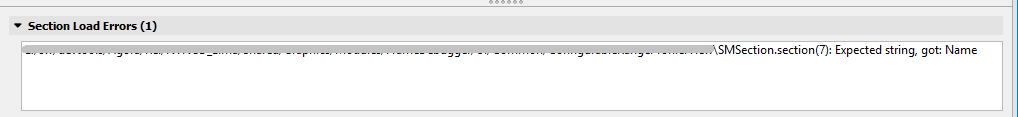
If you make edits to the .section or .py files and save them, the view will automatically detect the file change(s) and reload the view. When loading or reloading the sections, if there is an error detected, a new section will appear at the top of the view that contains any errors:
The section files have a simple syntax:
Identifier: "Name"
DisplayName: "Name"
Order: 100
Header {
    Metrics {
        Label: "L2 SOL"
        Name: "lts__throughput.avg.pct_of_peak_sustained_elapsed"
    }
Body {
    Items {
        Table {
            Label: ""
            Rows: 1
            Columns: 2
            Metrics {
                Label: "SM Active"
                Name: "sm__active_rate"
            }

            Metrics {
                Label: "SM Warp Can't Issue Allocation"
                Name: "smsp__warps_cant_issue_allocation_stall_per_warp_active.pct"
            }
        }
    }
}
The Identifier field is used as a global identifier for the section file. The DisplayName is what you will see displayed in the header for the UI. You can keep both of these the same, or use different names if desired. The next field is the Order. This is used to specify the display order of the sections in the view with lower numbers coming first and higher numbers coming last.
Next is the Header portion. This is what you will see displayed when the section is in "collapsed" mode. You can put any number of Metric entries in this portion, and it will display the values for the Metric specified by Name with a user-friendly Label.
Finally, there is the Body section. This is what will be displayed when the section is opened by clicking the triangle on the left-hand side of the section header. There are some default bodies, including "Table," "BarChart," "HistogramChart," and "LineChart." All of these take lists of metrics, very similar to the header section, and will display the metrics in various tables and charts. The SMSection.section is an example of a table that displays a list of metrics. There are 2 special body types, GfxPipelineDiagram, and GfxMemoryDiagram, that will display specialized diagrams of the GPU pipeline and require a mapping from the Label to the metric used for determining the value to display. If you wish to use them in your own section files, we suggest you copy them as is from their corresponding section files. Also, there is an additional special body type, GfxUserMetrics. This does not take a list of metrics, but instead displays two tables, one on the left that has all of the metric names and checkboxes to enable/disable displaying the values in the right-hand table.
The RangeInfo.py script is an example of specifying a section via Python. The syntax is a bit more complex, but the script allows you to also specify rules that will be evaluated that can be helpful for pointing out interesting metric values. At the top of the RangeInfo.py file, you will see classes for Metric, SectionTable, BodyTableItem, etc. — basically everything that is before the "class RangeInfo" portion. These are all helper classes used by the main class. In the RangeInfo, you will see a Header class, which is used to define what metrics will be displayed in the header portion of the UI, similar to the .section files. This takes a list of metric and label pairs.
Below the Header is the Body class. This is similar to the Body in the .section file and is used to put whatever type of body you would like to display. In the RangeInfo.py file, you will see a BodyItemTable that specifies the name of the table ("" or blank in this case), the number of columns (2), and a collection of metrics to display in the table.
Finally, you will see more control code to initialize the class in the script, including the header and body portions, and load the section. Below that portion is a number of accessory functions to retrieve elements like the name and identifier of the section (similar to the .section file), and the "apply" function. This portion is used to define a rule. The top portion is more boiler plate code to gain access to the data for the currently selected range. Then, the rule samples two values: drawCount and dispatchCount. From there, it defines two rules. First, if the draw count exceeds 500, it will display a MsgType_MSG_WARNING saying there are a large number of draw calls. Then, as another example, if the drawCount is greater than the dispatchCount, it will say more draw calls than dispatches, and vice versa if the dispatchCount exceeds the drawCount.
Known Issues
- After a few edits, the file watch functionality seems to disconnect. You can close and reopen the view to force a refresh of the sections.
- The sections can only display simple metrics as enumerated by the LOP library that supplies the data. We have implemented some specialized metrics to get values like the Tex Hit Rate. We are looking to expose this capability for "compound metrics" in a future version.
- The sizing of various portions of the dialog are either fixed or do not re-size cleanly. We will improve that in a future release.
- The current set of rules is very rudimentary. We are actively developing the rule set and will be adding to those in future releases.
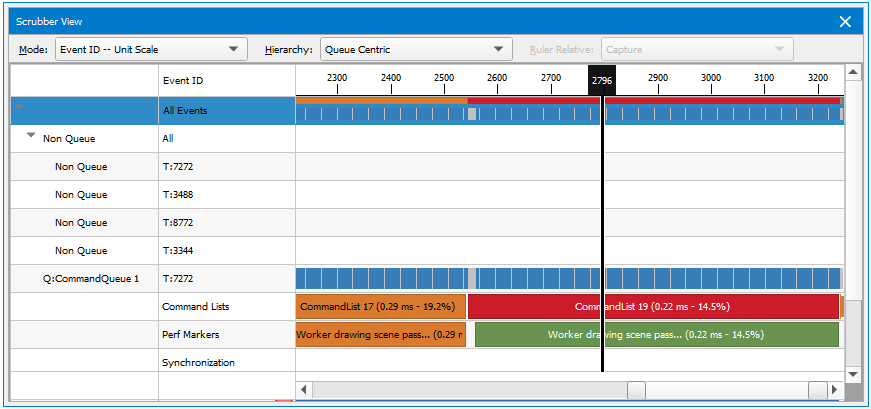
Scrubber
The NVIDIA Nsight Graphics Frame Debugger has two parts. One part appears as the Frame Debugger window on the host. The other part appears as a Heads-Up Display (HUD) on the target application.
To access this view, go to Frame Debugger > Scrubber.
To access this view, go to Nsight > Windows > Scrubber.
The part of the Frame Debugger that appears as a HUD on the target machine is comprised of the following:
-
HUD Toolbar — controls the frame capture, along with a number of other options (help, etc.).
-
Frame Scrubber — indicates the current draw event. There is a scrubber view in the Frame Debugger on the host, as well as a frame scrubber on the HUD. The frame scrubber controls stay in synch with each other, meaning that when you move the controls on one, it affects the other. For example, if you move the frame scrubber on the HUD to highlight a new draw event, the scrubber on the Frame Debugger moves in synch to do likewise.
Understanding the Frame Scrubber
For the sake of discussion when it comes to graphics debugging, it helps to note some common terminology.
-
An event is a single call to the API. It could be a triangle draw call, or backbuffer clear, or a less obvious call, like configuring buffers. A snapshot is a sequence of events.
-
An action is a subset of the event types. It can be one of the following: (1) Draw Call, (2) Clear, or (3) Dispatch. Actions are interesting since they explicitly change data which may result in visual changes.
|
Note: |
NOTE for Direct3D frame debugging: The Direct3D runtime documentation states that, "the return values of AddRef & Release may be unstable and should not be relied upon." The NVIDIA Nsight Graphics Frame Debugger will also take additional references on objects so any code that relies on an exact reference count at a particular time may fail. In general, users should not expect an exact reference count to be returned from the Direct3D runtime. For more information, see Microsoft's Rules for Managing Reference Counts. |
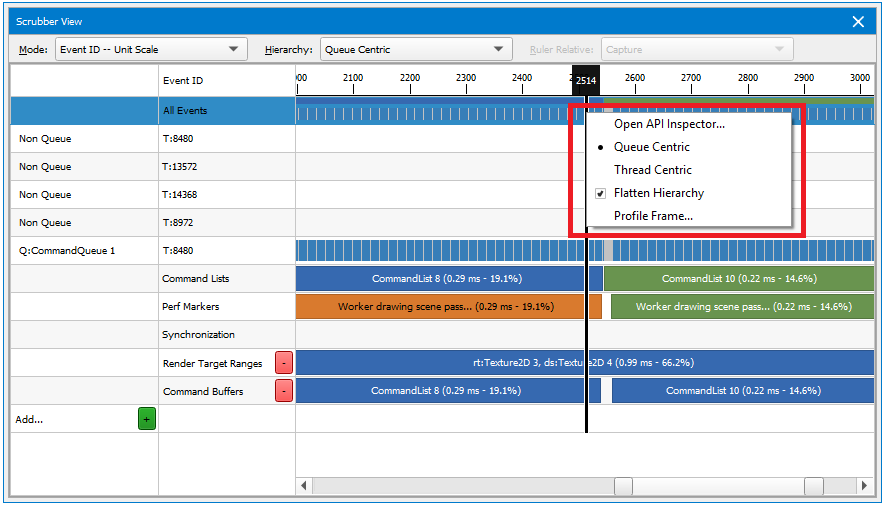
When you debug your graphics project, the Scrubber window shows the perf markers you implemented. When working with user-defined markers, the Scrubber window will use the color and label that you defined for the perf marker.
On the Scrubber, you can select one performance marker and it will automatically create a range of all of the draw calls that occurred within that time frame. Clicking on it again will cause the scrubber to automatically zoom to that range of events. You can zoom in on a nested/child marker the same way.
To zoom out, click the parent performance marker, or use CTRL + mouse wheel.
Performance markers are also displayed on the HUD, color-coded the same way that they are on the Scrubber. However, on the HUD, the information is condensed, and you must hover your mouse over the selected performance marker to get its details.
The default view will show the events in your application, in addition to any performance markers you have defined. Clicking the Add... button will open a dialog that allows you to select what type of range you want to add.
-
Program Ranges — Actions that use the same shader program.
-
Viewport — Actions that render to the same viewport rectangle.
-
Alpha Blending Enabled — Actions that have alpha blending enabled.
-
Alpha Test Enabled — Actions that have alpha test enabled.
-
Back Face Cull Enabled — Actions that have back face cull enabled.
-
User — A range defined by you on the fly. Use SHIFT + left-click and drag the scrubber on the created "User" row to create a new range.
Right-clicking on a specific action in the Scrubber will allow you to open the API Inspector for that action, change your view settings, or initiate a profile session with the Range Profiler.
Scrubber View Options
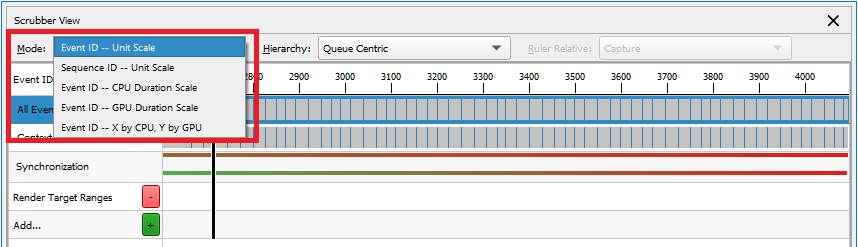
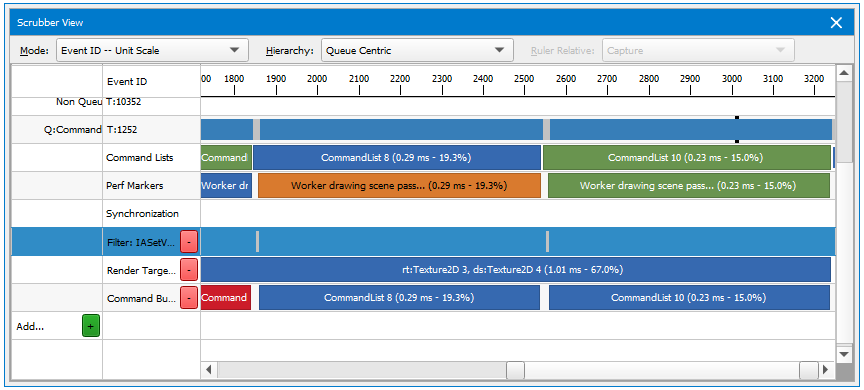
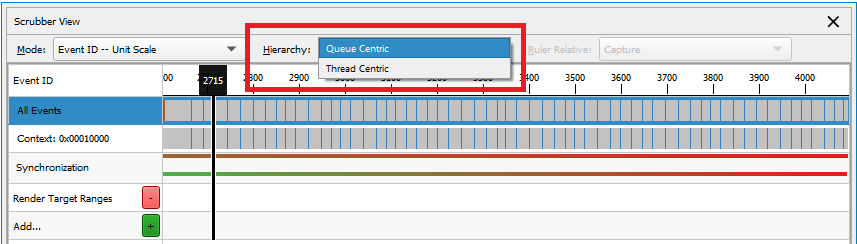
From the Mode drop-down menu, choose one of the following:
-
Event ID -- Unit Scale is the default view, which simply shows the actions and events on the timeline.
-
Sequence ID -- Unit Scale shows the sequence of events on the timeline.
-
Event ID -- GPU Time Scale displays the GPU activity and how much each event or action cost the GPU.
-
Event ID -- CPU Time Scale displays the CPU activity and how much each event or action cost the CPU.
-
Event ID -- X by CPU, Y by GPU displays the CPU time scale on a horizontal X-axis, and the GPU time scale on a vertical Y-axis.
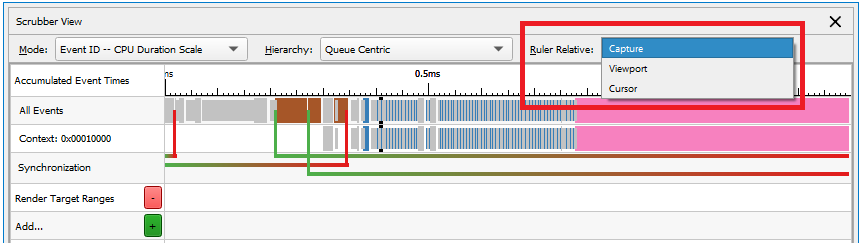
Depending on which mode you select, you can also select whether you want to view the ruler relative to the capture, viewport, or cursor.
From the Hierarchy drop-down, Queue Centric sorts the events by queue, while Thread Centric sorts the events by the thread.
Using Hotkeys to Scrub Through a Frame
When the scrubber has focus, you can use the following hotkeys to move the scrubber cursor from one event to another.
| Navigation | |
|---|---|
|
CTRL + Home |
Go to the first event. |
|
CTRL + End |
Go the last event. |
|
CTRL + Left Arrow |
Go to the previous event. |
|
CTRL + Right Arrow |
Go to the next event. |
|
Up Arrow |
Expand the current event group (HUD only). |
|
Down Arrow |
Collapse the current event group (HUD only). |
|
F2 |
Current event: show less information (HUD only). |
|
F3 |
Current event: show more information (HUD only). |
|
Zooming and Panning |
|
|
CTRL + Scroll mouse wheel up, or CTRL + NumPadPlus |
Zoom in X-axis |
|
CTRL + Scroll mouse wheel down, or CTRL + NumPadMinus |
Zoom out X-axis |
|
CTRL + 0 |
Reset zoom |
|
CTRL + SHIFT + Scroll mouse wheel up |
Increase row height (all rows) |
|
CTRL + SHIFT + Scroll mouse wheel down |
Decrease row height (all rows) |
|
CTRL + Left mouse click and drag |
Pan |
|
ALT + mouse move |
View zoom window |
|
Cursor and Selection |
|
|
Left mouse click on desired cursor location |
Set cursor(Places cursor at closest point to the start of a range.) |
|
Left mouse click on desired row |
Select row (The selected row is highlighted in orange.) |
|
SHIFT + Left mouse click and drag |
Make range selection |
|
Left mouse click on selection |
Zoom to range |
|
Left double-click on event action, or Right-click menu, Open API Inspector |
Open API Inspector |
|
Right-click menu, Run Range Profiler |
Run Range Profiler |
|
CTRL + A |
Select all events |
For the purpose of moving the scrubber cursor, the following are considered action events:
-
Draw methods
-
Clear methods
-
Dispatch methods
-
Present methods
For example, if you are looking for the next draw method that was called, you can press the CTRL + RIGHT ARROW on the keyboard to skip over events that are not typically of interest, and only stop on events that are considered action events.
Resources View
The Resources View allows you to see all of the available resources in the scene.
To access this view, go to Frame Debugger > Resources.
To access this view, go to Nsight > Windows > Resources.
To open the Resources page, go to Frame Debugger > Resources. There are two tabs available here:
-
Graphical
-
Memory
At the top of the Resources view, you'll find a toolbar:
-
Clone — makes a copy of the current view, so that you can open another instance.
-
Lock — freezes the current view so that changing the current event does not update this view. This is helpful when trying to compare the state or a resource at two different actions.
-
Save — saves the captured resources to disk.
-
Red, Green, and Blue — toggles on and off specific colors.
-
Alpha — enables alpha visualization. In the neighboring drop-down, you can select one of the following two options:
-
Blend — blends the alpha with a checkerboard background.
-
Grayscale — alpha values are displayed as grayscale.
-
-
Flip Image — inverts the image of the resource displayed.
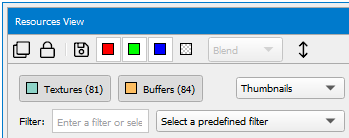
Below the toolbar is a set of buttons, described below, for high-level filtering of the resources based on type. Next to that, there is a drop-down menu that allows you to select how you wish to view the resources: thumbnails, small thumbnails, tiles, or details.
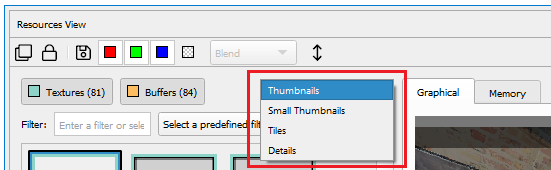
If you select the Details view, you can sort the resources by the available column headings (type, name, size, etc.).
Graphical Tab
The Graphical tab allows you to inspect the resource, pan using the left mouse button to click and drag, zoom using the mouse wheel, and inspect pixel values. Also, this is where you can save the resource to disk. If supported on your GPU and API, this is also where you can initiate a Pixel History session to get all of the contributing fragments for a given pixel.
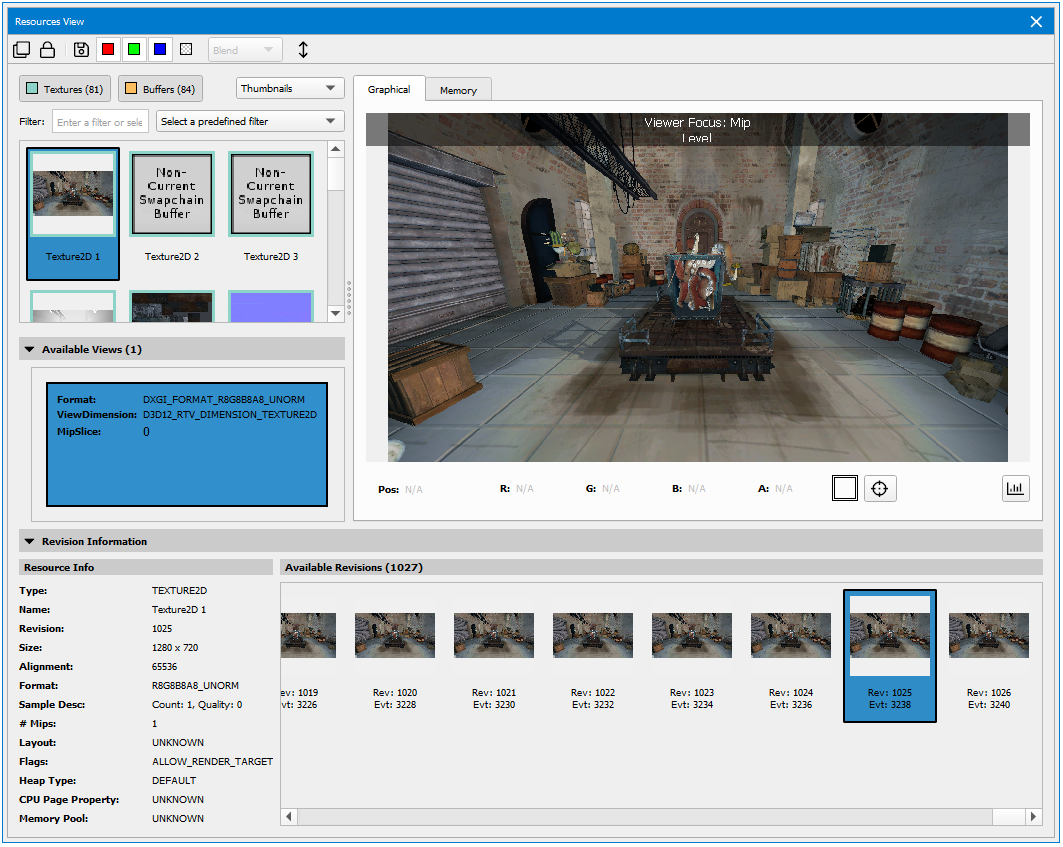
When you have selected a buffer from the left pane, the Show Histogram button will be available on the right side of the Graphical tab, which allows for remapping the color channels for the resource being viewed.
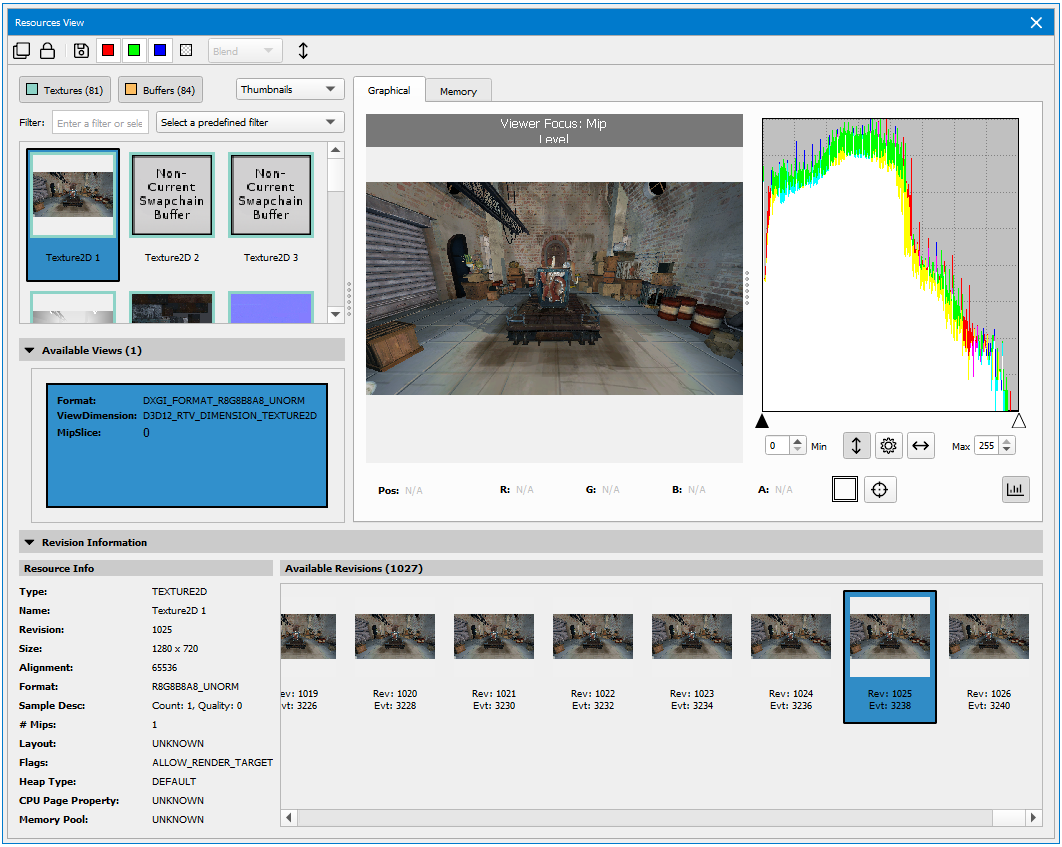
To modify the histogram view, the following options are available:
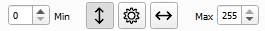
-
You can set the minimum and maximum cutoff values via the sliders under the histograms, or by typing in values in the Minimum and Maximum boxes.
-
You can change the scale by using the Log button.
-
The Luminance button allows you to visualize luminance instead of color values.
-
The Normalize button can preset the minimum and maximum values to the extents of the data in the resource.
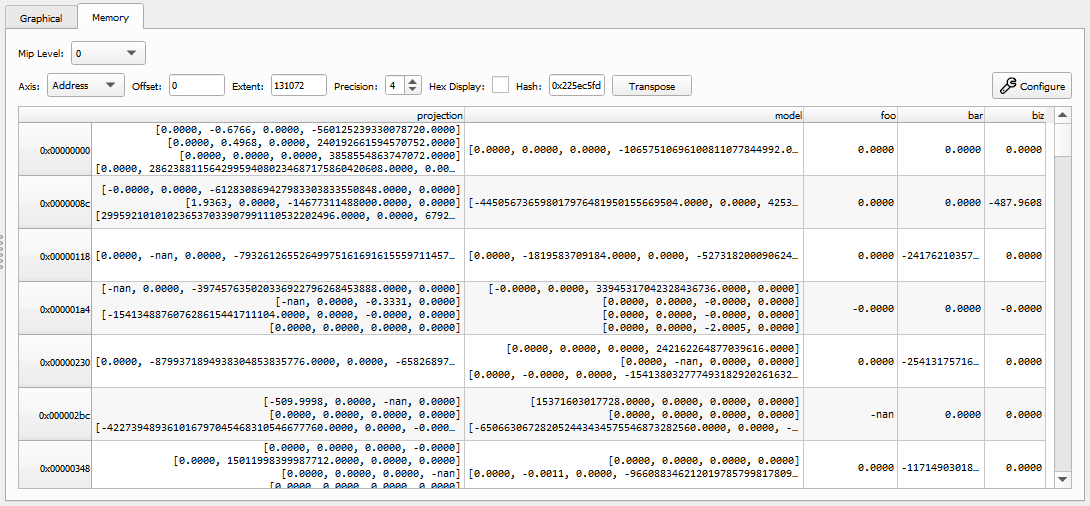
Memory Tab
The Memory tab shows a dump of the resource data.
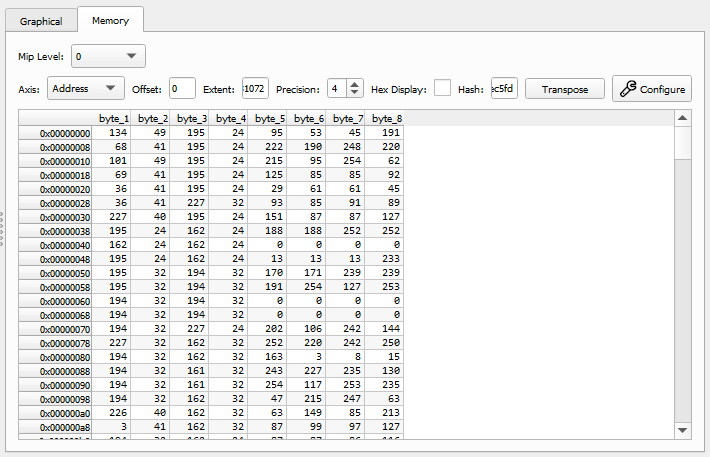
You can use multiple options to configure how this memory is displayed:
-
The Axis drop-down changes between address (memory offset) and index (array element) views.
-
The Offset entry limits the view to an offset within the given resource.
-
The Extent entry limits the view to a maximum extent within the given resource.
-
The Precision spin box controls the number of decimal places to show for floating point entries.
-
The Hex Display toggles between decimal (base-10) and hex (base-8) display formats.
-
Hash shows a hash value representative of the given memory resource within the current offset and extent. This is useful for comparing memory objects or sub-regions.
-
The Transpose button swaps the rows and columns of the data representation.
-
The Configure button opens the Structured Memory Configuration dialog.
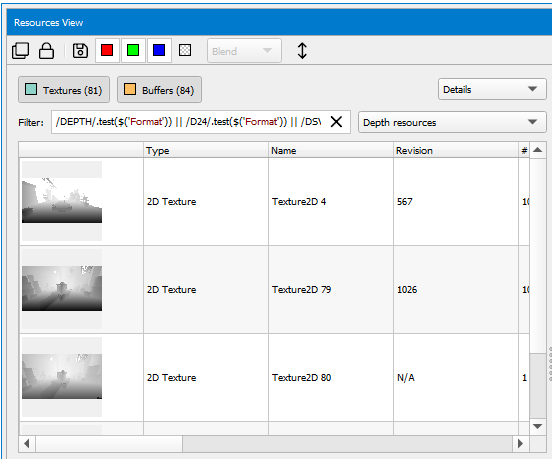
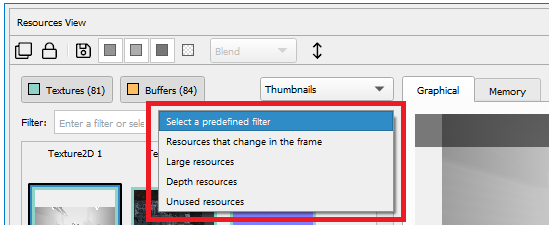
Filtering
There are three ways to filter the available resources.
-
For high-level filtering, there are color coded buttons to filter based on resource type. All resource types are visible by default, and you can filter the resource list by de-selecting the button for the type you don't want to see. For example, if you'd like to see only textures, you can click the other buttons to de-select them and remove them from the list of resources.
-
You can manually type in a search string to filter the list of resources.
-
You can choose from the drop-down of predefined filters to view only large resources, depth resources, unused resources, or resources that change in the frame. Selecting one of these will fill in the JavaScript string necessary for the requested filter, which is also useful as a basis to construct custom filters.
Pixel History
Pixel history enables the automatic detection of the draw, clear, and data-update events that contributed to the change in a pixel's value. In addition, pixel history can identify the fragments that failed to modify a particular texture target, allowing you to understand why a draw might be failing, such as whether you may have misconfigured API state in setting up your pipeline.
To run a pixel history test, click the
![]() button and select a pixel to run the experiment on. The Pixel History view will come up
with a loading bar and present the results once they are complete.
button and select a pixel to run the experiment on. The Pixel History view will come up
with a loading bar and present the results once they are complete.
Structured Memory Configuration
The Structured Memory Configuration dialog allows the user to specify a data layout to interpret the raw data backing the selected resource. For example, a texture may be represented by its colors channels or a uniform buffer may be represented by the various types packed within that buffer.
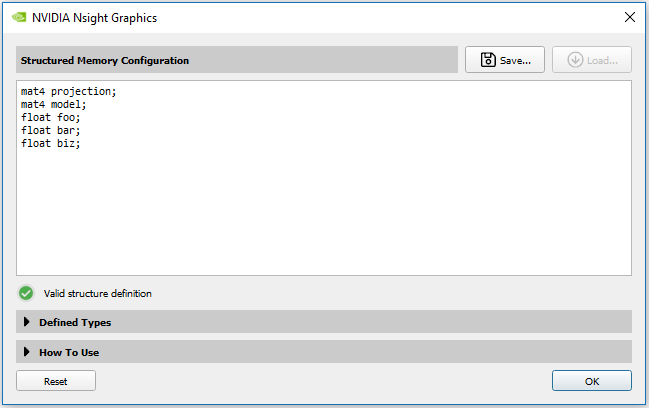
Typing in a valid structure definition will automatically update the viewer to respect the configuration.
New columns can be created using a simple C-like syntax.
int;      // creates a column with an anonymous int
int x;    // creates a second column with an int named x
float y;  // creates a third column with a float named y
Where additional user types can be defined like the following:
struct MyType{ int x; float y;};
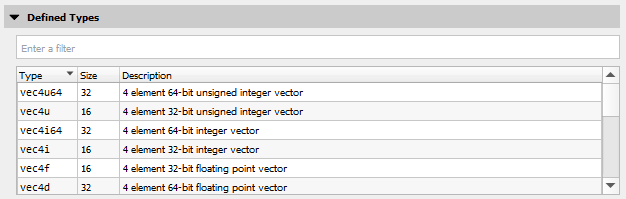
struct MyOtherType{ MyType z; double u; };Many common sized, unsized, and normalized types are permitted as valid types. Vector and matrix types are provided in a similar syntax to HLSL and GLSL. The full list of supported types can be browsed and searched by clicking on the expandable "Defined Types" sub-section of the configuration dialog.
As some additional notes on the parser:
-
Full C/C++ grammar is not supported.
-
Single line comments are accepted; c-style block comments (/* */) are not.
-
Macros are not currently supported.
-
Alignments are not considered; all types are considered packed.
-
To add explicit padding, use padN where N is a multiple of 8.
-
Members can be selectively hidden as well, which can be useful for narrowing your data.
When clicking on a texture resource, the configuration is automatically populated to interpret the channels of that format.
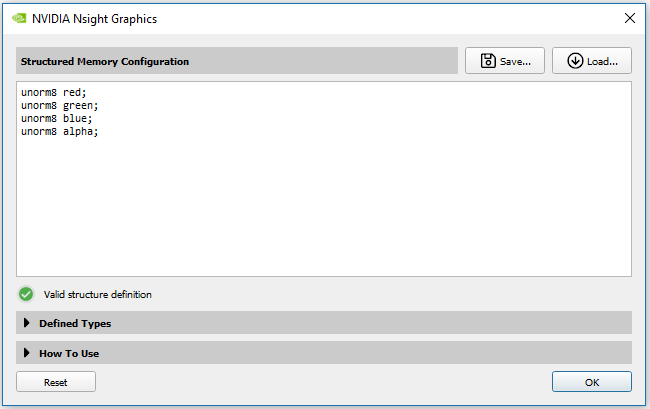
Similarly, buffers are defaulted to a generic byte configuration. A user can typically interpret this buffer data by examining the specific use case. For example, the layout of a vertex buffer can be seen in the Input Assembler section of the API Inspector view, or a uniform buffer can be interpreted by looking at the data layout specified within the shader source.
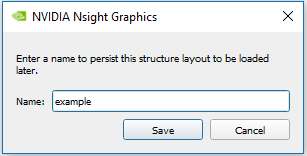
To persist a configuration, you can click on the Save... button to assign a name to this configuration.
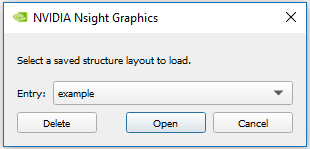
Later, you can restore this configuration by clicking on the Load... button.
Linked Programs View
The Linked Programs View lists all of the shaders in your application.
To access this view, go to Frame Debugger > Linked Programs.
To access this view, go to Nsight > Windows > Linked Programs View.
-
If the shader (or its parent program or pipeline object) hasn’t been used by the application yet, it will show up with the
 symbol in the Status
column.
symbol in the Status
column.
-
If the shader has been used, selected statistics will be presented for that shader.
For programs or pipeline objects, you can view the individual shaders by pressing the ► button to the left of the program/pipeline name. When expanded, you can select the link to open a text view of the shader source (when available).
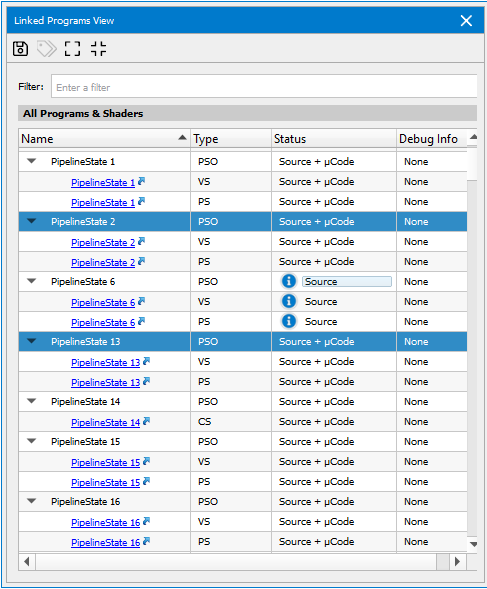
Name
This is the name of the shader. This name is either generated internally, or can be assigned by the user per API.
Type
The type of the shader: Vertex, Pixel, Compute, etc.
Status
This column displays the current status of the shader. The status includes Source or Binary, to denote whether or not source code is available for this shader. Also, if the µCode text is included, this means that we have driver level binary code that is necessary for gathering shader performance metrics.
The
The
symbol means that shader performance metrics are currently being computed.
Context
Indicates to which of the application's contexts this shader is owned. Shown on multi-context OpenGL applications, only.
Regs
This column gives the number of registers used by the program. Register count impacts occupancy/threads in flight. This may be not available for all shaders.
# Barrier
Indicates the number of barriers used by the shader. Shown on compute shaders only.
|
Note: |
Shader µCode, and thus shader performance metrics are only supported for Direct3D 11, Direct3D 12, and OpenGL. Vulkan support will be added in a future release. |
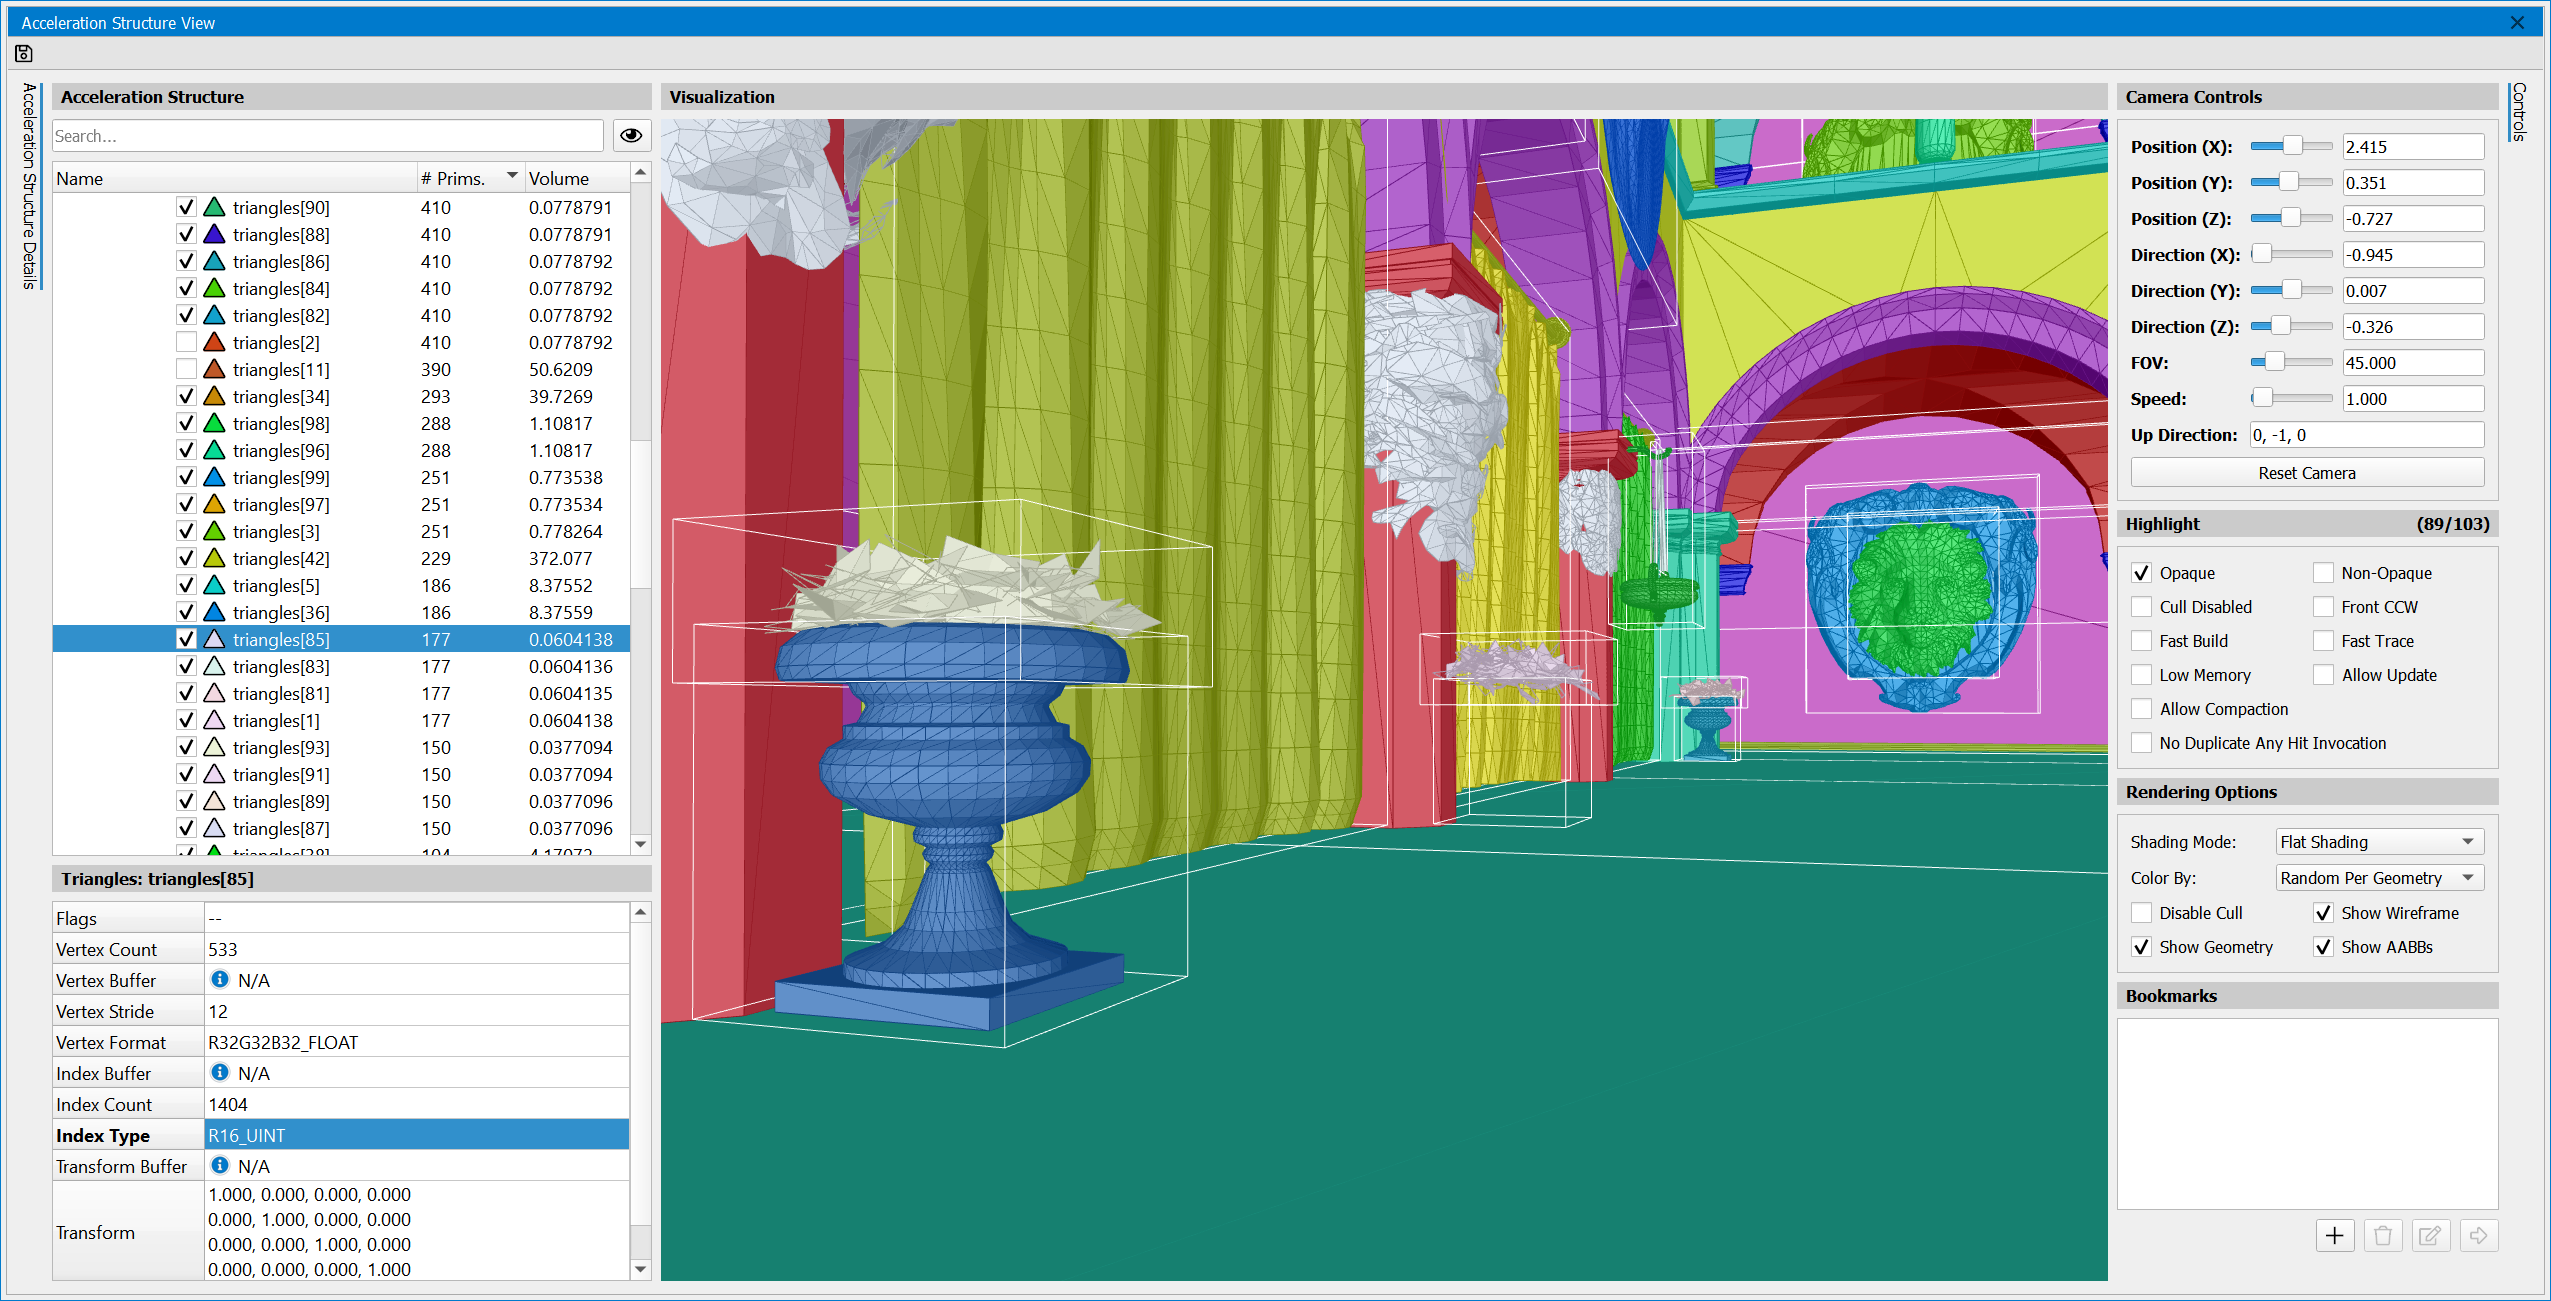
Acceleration Structure View
The Acceleration Structure View shows the geometry that has been specified in build commands when running an application that uses ray tracing APIs. If the application does not use these APIs, the view will not be available.
In Ray tracing APIs, such as DXR and NVIDIA Vulkan Ray Tracing, an acceleration structure is a data structure that describes the full-scene geometry that will be traced when performing the ray tracing operation. This data structure is described in detail in the following links:
https://developer.nvidia.com/rtx/raytracing/dxr/DX12-Raytracing-tutorial-Part-1
This data structure is purpose-built to allow for translation to application-specific data structures that perform well on modern GPUs. While constructing this data structure, the developer has the responsibility of constructing the structure correctly and using flags to identify the functional and performance characteristics within it. Needless to say, this can be an error-prone operation.
Nsight Graphics Acceleration Structure Viewer allows you to view the structures you are creating, navigate through them, and see the flags that you are using. Additionally, you can filter and colorize the structure to highlight, at a bird’s eye view, different kinds of geometry.
To access this View, go to Frame Debugger > Acceleration Structure.
To access this View, go to Nsight > Windows > Acceleration Structure View.
Additionally, the Acceleration Structure Viewer can be opened from the API Inspector View when scrubbed to a build event trace rays call. When scrubbed to these events, the view will present a list of the active structures with a link to open each.
The view is multi-paned -- it shows a hierarchical view of the acceleration structure on the left, a graphical view of the structure in the middle, and controls and options on the right. With the hierarchy of the Acceleration Structure view, the top-level acceleration structure (TLAS), bottom-level acceleration structures (BLAS), child instances, and child geometries are presented. When a particular item is selected, the name, flags, and other meta-data for this entry are listed in a section on the bottom left-hand side. Each item within the tree has a check box that allows the rendering of the selected geometry or hierarchy to be disabled. Double-clicking on an item will jump to the item in the rendering view and automatically adjust the camera speed to be relative to the size of the selected object.
Navigation
The Acceleration Structure View supports FPS-like controls for scene navigation. To the right of the rendering pane, information on the camera position and direction are presented. Each of these controls is editable to navigate the scene. The view uses WASD or up, down, left, right keys to change the position. Holding Shift while navigating increases the navigation speed. Clicking with the mouse and dragging allows for additional navigation. To vertically flip the camera, you may need to set the camera Up Direction setting to (0, -1, 0). To reset the camera at any time, click Reset Camera.
There are also a selection of Camera Controls for fast and precise navigation. To save a position, use the bookmarks controls. Each node within the acceleration structure hierarchy can also be double-clicked to quickly navigate to that location.
Filtering and Highlight
The acceleration structure view supports geometry filtering as well as highlighting of data matching particular characteristics. The checkboxes next to each geometry allow individual toggling between full rendering, wireframe rendering, and no rendering. Combining this capability with search allows for you to identify the geometry of interest (by name when the application has named its resources) and display just that geometry.
Beyond filtering, the view also supports highlight-based identification of geometry specified with particular flags. Checking each Highlight option will identify those resources matching that flag, colorizing for easy identification. Clicking an entry in this section will dim all geometry that does not meet the filter criteria allowing items that do match the filter to standout. Selecting multiple filters requires the passing geometry to meet all selected filters (e.g., AND logic). Additionally, the heading text will be updated to reflect the number of items that meet this filter criteria.
Rendering Options
Under the highlight controls, additional rendering options are available. These include methods to control the geometry colors and the ability to toggle the drawing of AABBs.
Export
Exporting the view, by clicking on the Save (disk) icon in the upper left of the view toolbar, allows for persisting the data you have collected beyond the immediate analysis session. This capability is particularly valuable for comparing different revisions of your geometry or sharing with others. Bookmarks are persisted as well. An example use case is identify sub-optimal geometry, bookmarking it, and passing this document to a level designer or artist for correction.
VR Inspector View
The VR Inspector view allows you to inspect how your application is using VR APIs. It will be available when an application is captured with a supported API. Supported APIs include Oculus (LibOVR) and OpenVR.
To access this view, go to Frame Debugger > VR Inspector.
To access this view, go to Nsight > Windows > VR Inspector.
Once opened, this view is context-specific to the VR API in use. See the sections below for a discussion on each API.
Oculus (LibOVR)
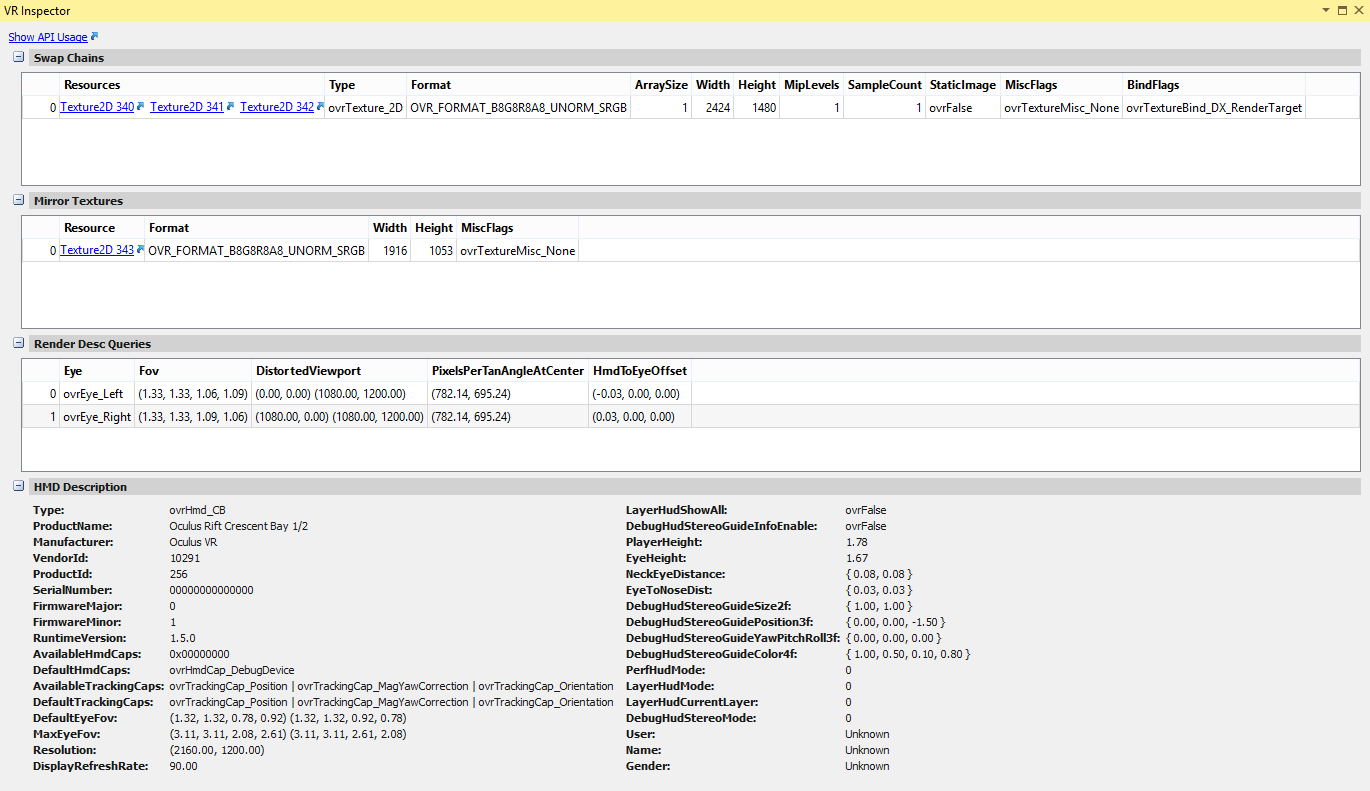
With the Oculus API, the sections of the VR Inspector view include the following:
-
Swap Chains — Lists all swap chains and their associated texture resources and description fields, with links to the Resources View for inspection.
-
Mirror Textures — Lists all mirror textures and description fields with Resources View links for the associated texture(s).
-
Render Desc Queries — Shows all of the calls to ovr_GetRenderDesc, along with the parameters, to confirm that the proper eyes, FOV values, etc. are correct.
-
HMD Description — Gives details on the actual HMD device connected to the machine and all of the limits for that device.
OpenVR
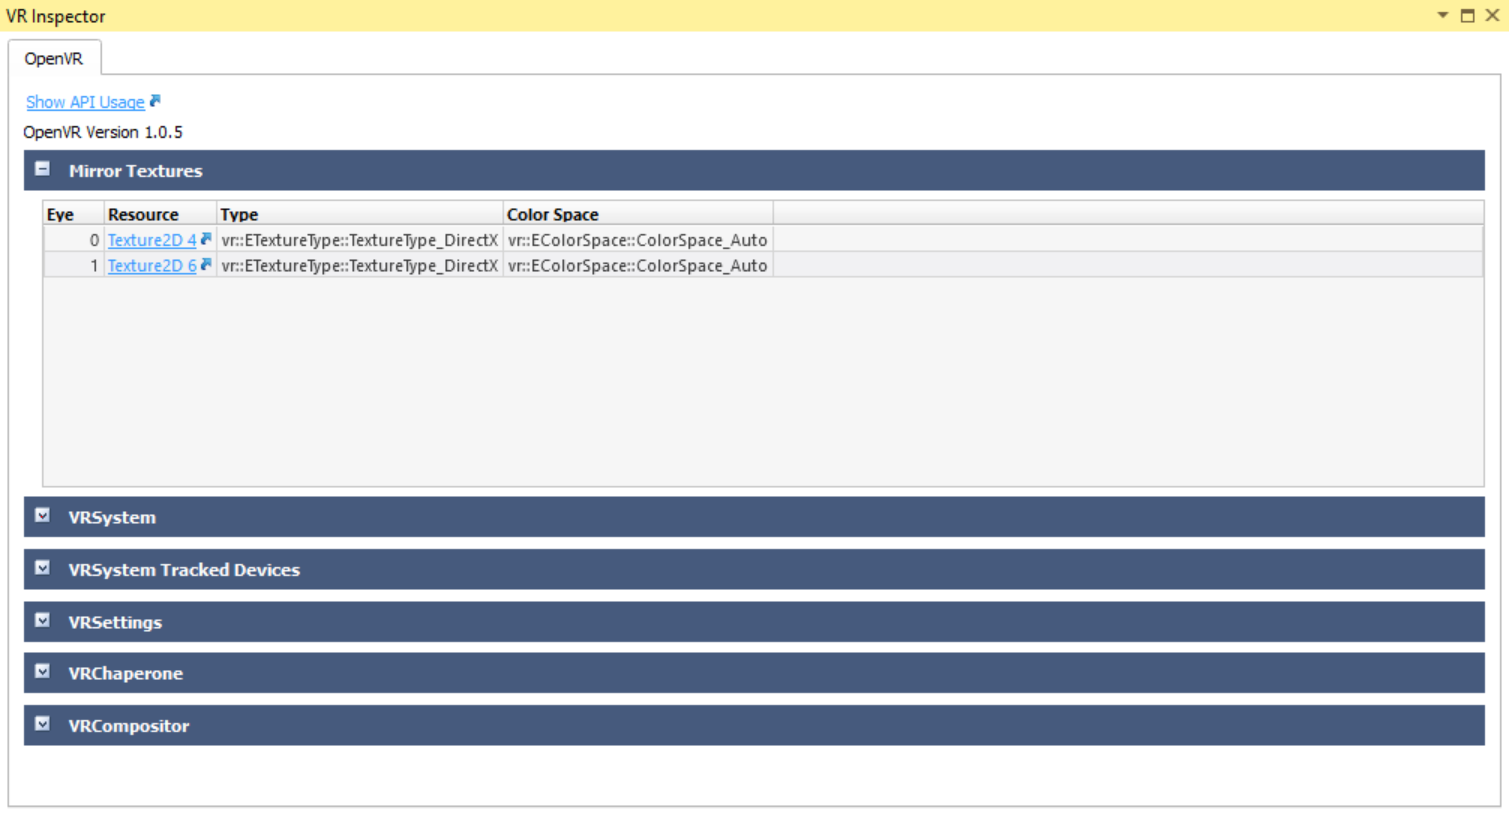
When using OpenVR, you will see the following in the VR Inspector view:
-
Show API Usage — Brings up the Events List view filtered by OpenVR calls.
-
OpenVR Version — In the top left, under Show API Usage, the minimally compatible version of OpenVR you are using will be displayed. This may be lower than the version your application has targeted, due to the fact that it may not be using any features of later API versions.
-
Mirror Textures — Lists all mirror textures and description fields with Resources View links for the associated texture(s).
The following sections return interface dependent information:
-
VRSystem — displays the render target size
-
VRSystem Tracked Devices — displays information for each tracked device currently connected
-
VRSettings — displays all of the VRSettings properties
-
VRChaperone — displays the play area information
-
VRCompositor — displays rendering and compositing statistics
D3D12 Specific Views
D3D12 Descriptor Heaps
The Descriptor Heaps view displays all of the descriptor heaps bound for the current event.
To access this view, go to Frame Debugger > Descriptor Heaps.
To access this view, go to Nsight > Windows > Descriptor Heaps.
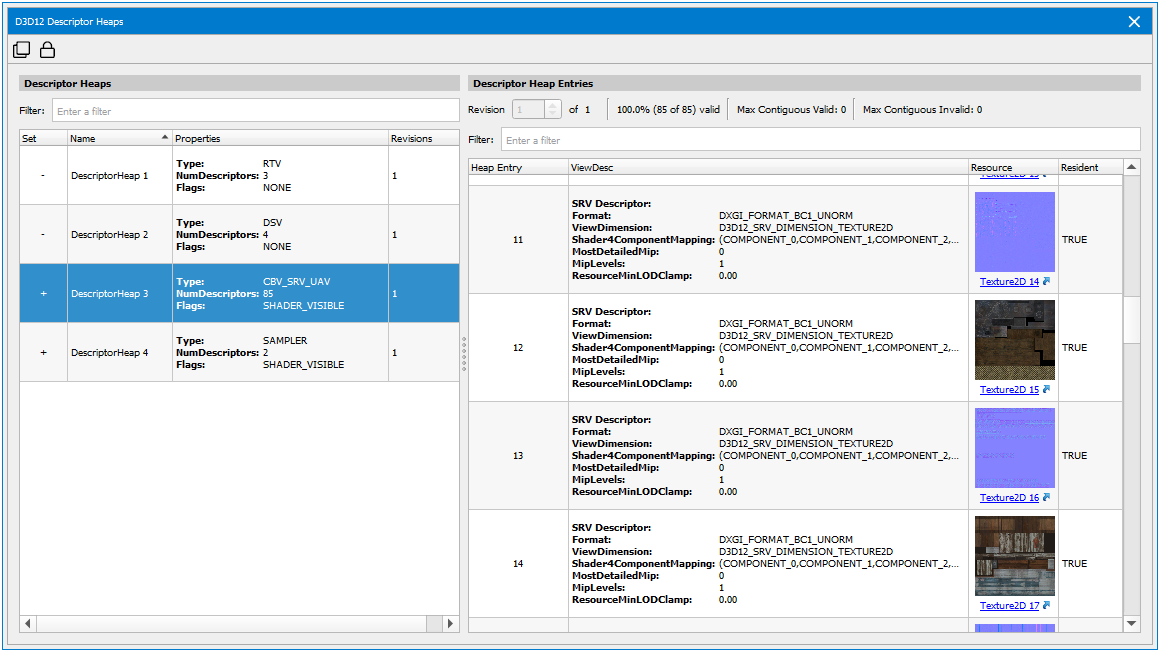
On the left are the descriptor heaps available, and on the right you can view the properties of each descriptor heap. Along the top of the details pane, you can see how populated the descriptor heap is, as well as the maximum contiguous valid and invalid ranges. These properties can help you dive into each descriptor heap, and use it as a diagnostic tool to find any potential bugs in your application.
Note that if you click the hyperlink in the Resources column, it will bring up the Resources view.
D3D12 Heaps View
The Heaps view provides a list of all heaps created by the application, along with detailed information about the resources contained in each heap.
To access this view, go to Frame Debugger > Heaps.
To access this view, go to Nsight > Windows > Heaps.
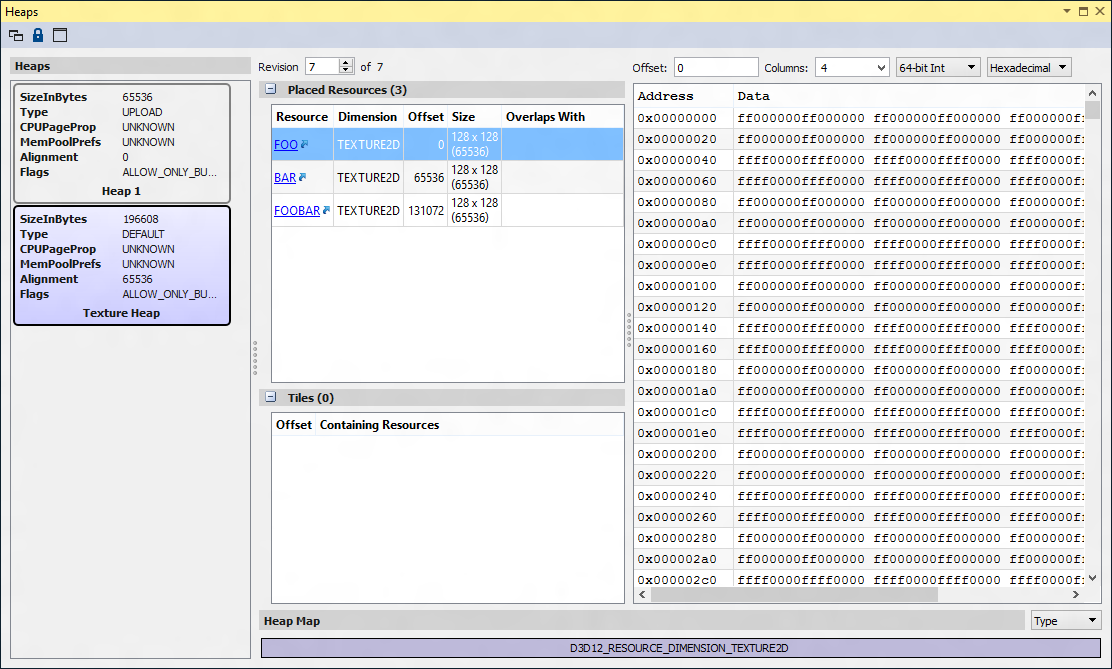
When you select a heap from the left pane, you will see all one of two types of entries: Placed Resources or Tiles. Clicking the hyperlink in the Placed Resources box will take you to the Resources Graphical tab.
Tiles are used to populate sections of a tiled resource.
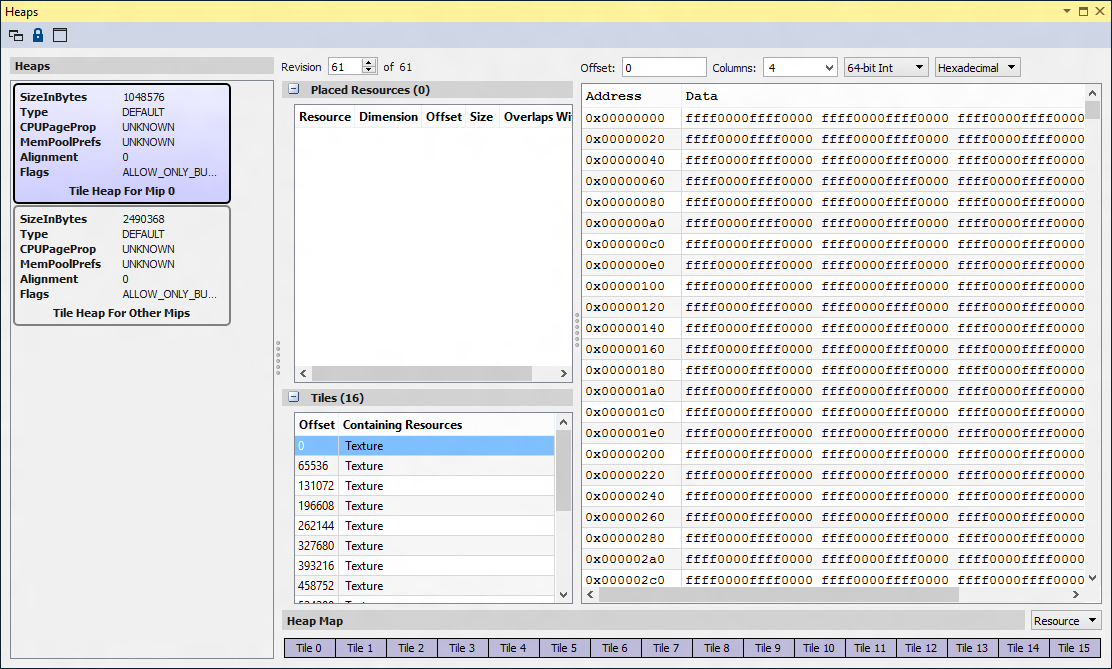
The right side of the Heaps view displays the memory data associated with the selected resource, which can also be seen on the Memory tab of the Resources view.
Heap Map
The Heap Map shows a high-level layout of how the heap is currently being used. You can view the usage either by Type (for example, Buffer, Texture2D, etc.) or by the name of the Resource.
Type:

Resource:

The Heap Map shows any overlapping regions within the heap.
D3D12 Root Parameters
The Root Parameters view displays all of the root parameters bound for the current event. This allows you to quickly change the state of what you're sampling from, constants, and other descriptors at a lightweight, faster rate than past APIs.
To access this view, go to Frame Debugger > Root Parameters.
To access this view, go to Nsight > Windows > Root Parameters.
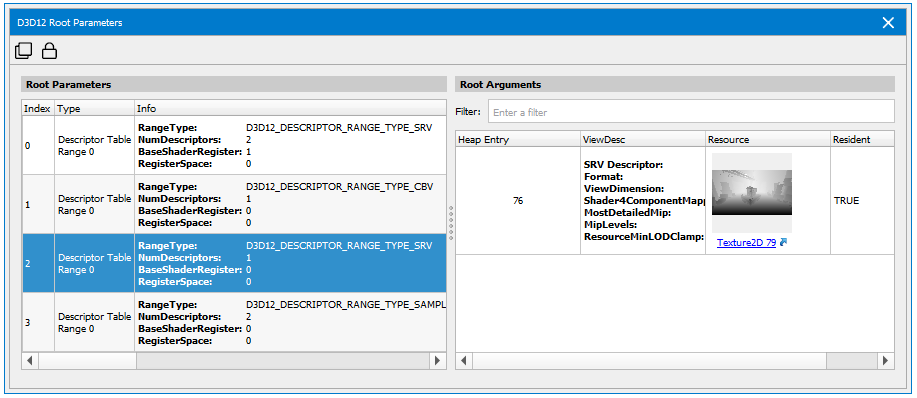
The root signature displays the structure definition of what's bound at that moment. Root parameters fill in that structure with the values you're sampling from and the constants you're using.
When you select a root parameter on the left, the root arguments for that parameter are displayed on the right. This shows residency information, any invalid descriptors are displayed in red. Using root parameters as a diagnostic tool can help prevent a GPU fault.
Note that if you click the hyperlink in the Resources column, it will bring up the Resources view.
Vulkan Specific Views
Vulkan Descriptor Sets View
The Descriptor Set view displays all of the descriptor sets currently allocated and bound by the application at the current event.
To access this view, go to Frame Debugger > Descriptor Sets.
To access this view, go to Nsight > Windows > Descriptor Sets.
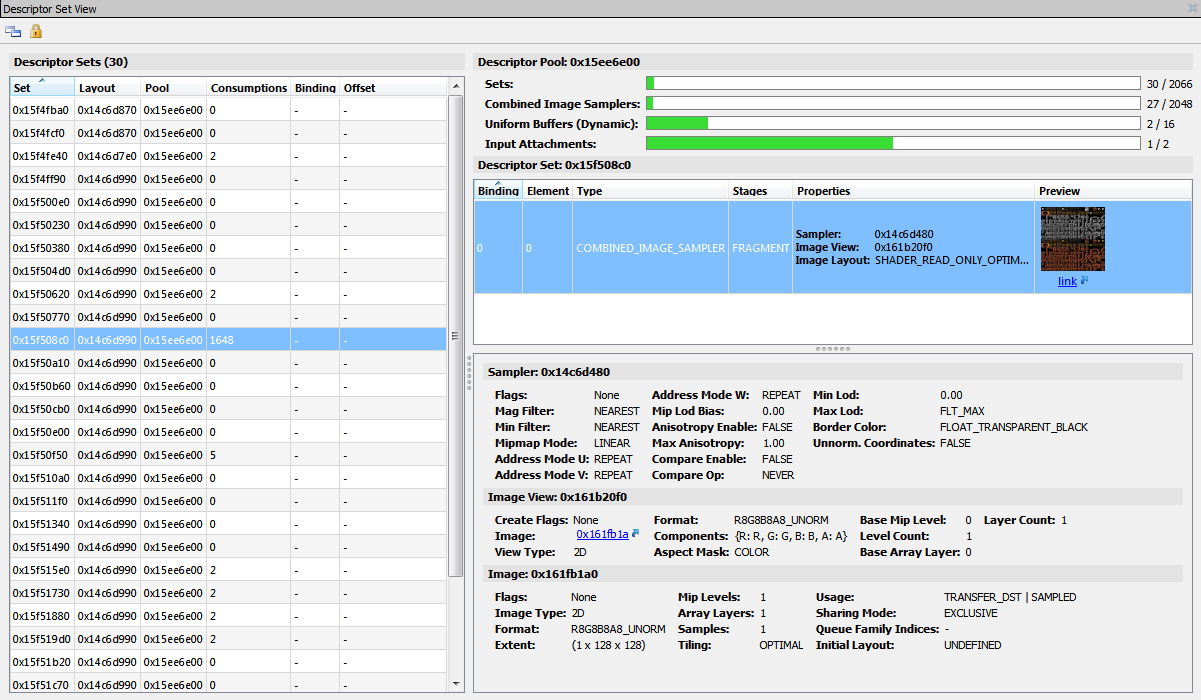
The left pane displays a selectable list of descriptor sets along with their layout, pool, consumption counts, and dynamics offsets.
When a set is selected, the right pane will display the resources currently associated with this descriptor set, as well as information related to the pool from which this descriptor set was allocated. In addition, clicking on a resource within the descriptor set will display more detailed information about that specific resource.
Note that if you click the hyperlink in the Preview column, it will bring up the Resources view associated with this image or buffer.
Vulkan Device Memory View
The Device Memory view provides a list of all device memory allocated by the application, along with detailed information about the resources contained in each memory region.
To access this view, go to Frame Debugger > Device Memory.
To access this view, go to Nsight > Windows > Device Memory.
The left-most pane contains information about all device memory objects currently allocated. Once a device memory object is selected, the contained resources will be listed in the middle pane, along with the resource layout map in the bottom left, and contained data on the right.
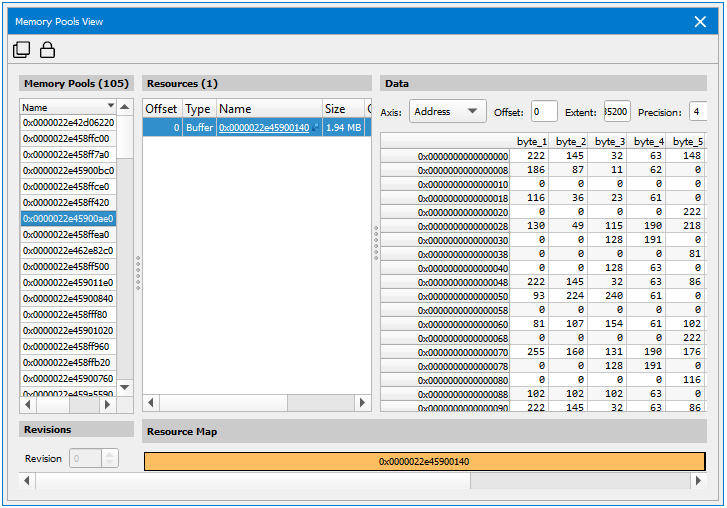
Vulkan Memory Pools
The Memory Pools view provides a list of all device memory allocated by the application, along with detailed information about the resources contained in each memory region.
To access this view, go to Frame Debugger > Memory Pools.
To access this view, go to Nsight > Windows > Memory Pools.
The left-most pane contains information about all device memory objects currently allocated. Once a device memory object is selected, the contained resources will be listed in the middle pane, along with the resource layout map in the bottom left, and contained data on the right.
Vulkan Texture and Sampler Pools
The Texture and Sampler Pools View provides a visualization of these different pool types. This can be useful for determining if a particular set of resources are in the resource pools they are expected to be in. The left-hand side allows you to select the pool you're interested in, based on type. Included in the list are appropriate parameters about how the pool was created. On the right side is a list of the resource descriptors, some information about the resource itself, and a thumbnail preview. There is a link below the thumbnail that allows you to open that resource in the Resources View for deeper inspection.
To access this view, go to Frame Debugger > Texture and Sampler Pools.
To access this view, go to Nsight > Windows > Texture and Sampler Pools.
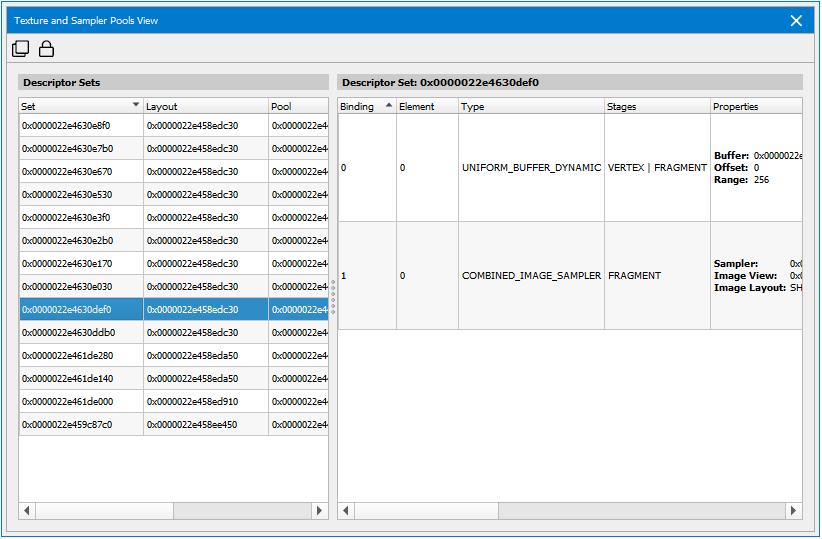
Generate C++ Capture UI
Compiling and Launching C++ Captures
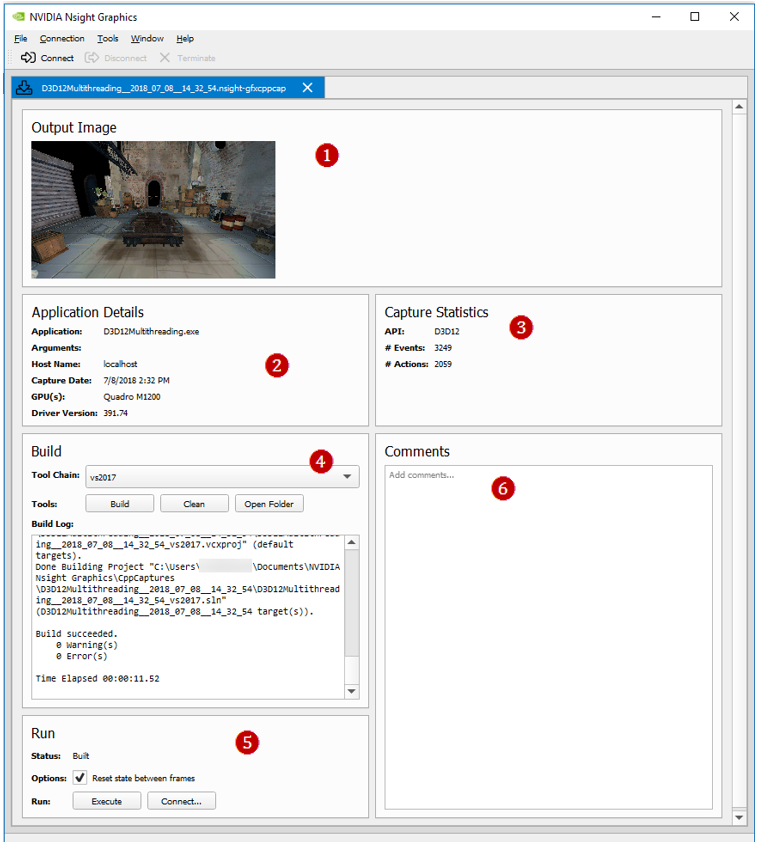
The additional features of an nsight-gfxcppcap file include:
-
Screenshot of the capture taken from the original application
-
Information about the captured application and its original system
-
Statistics about the captured API stream
-
Utilities to build the C++ capture without opening the generated Visual Studio project
-
User comments that are persisted within this file.
GPU Trace UI
GPU Trace profiles live applications. Once a capture is complete, the data is saved in a capture file and can be analyzed offline on any computer where NVIDIA Nsight Graphics is installed, without the need to have the specific GPU installed or the profiled application running.
The GPU Trace window is comprised of 5 sections:
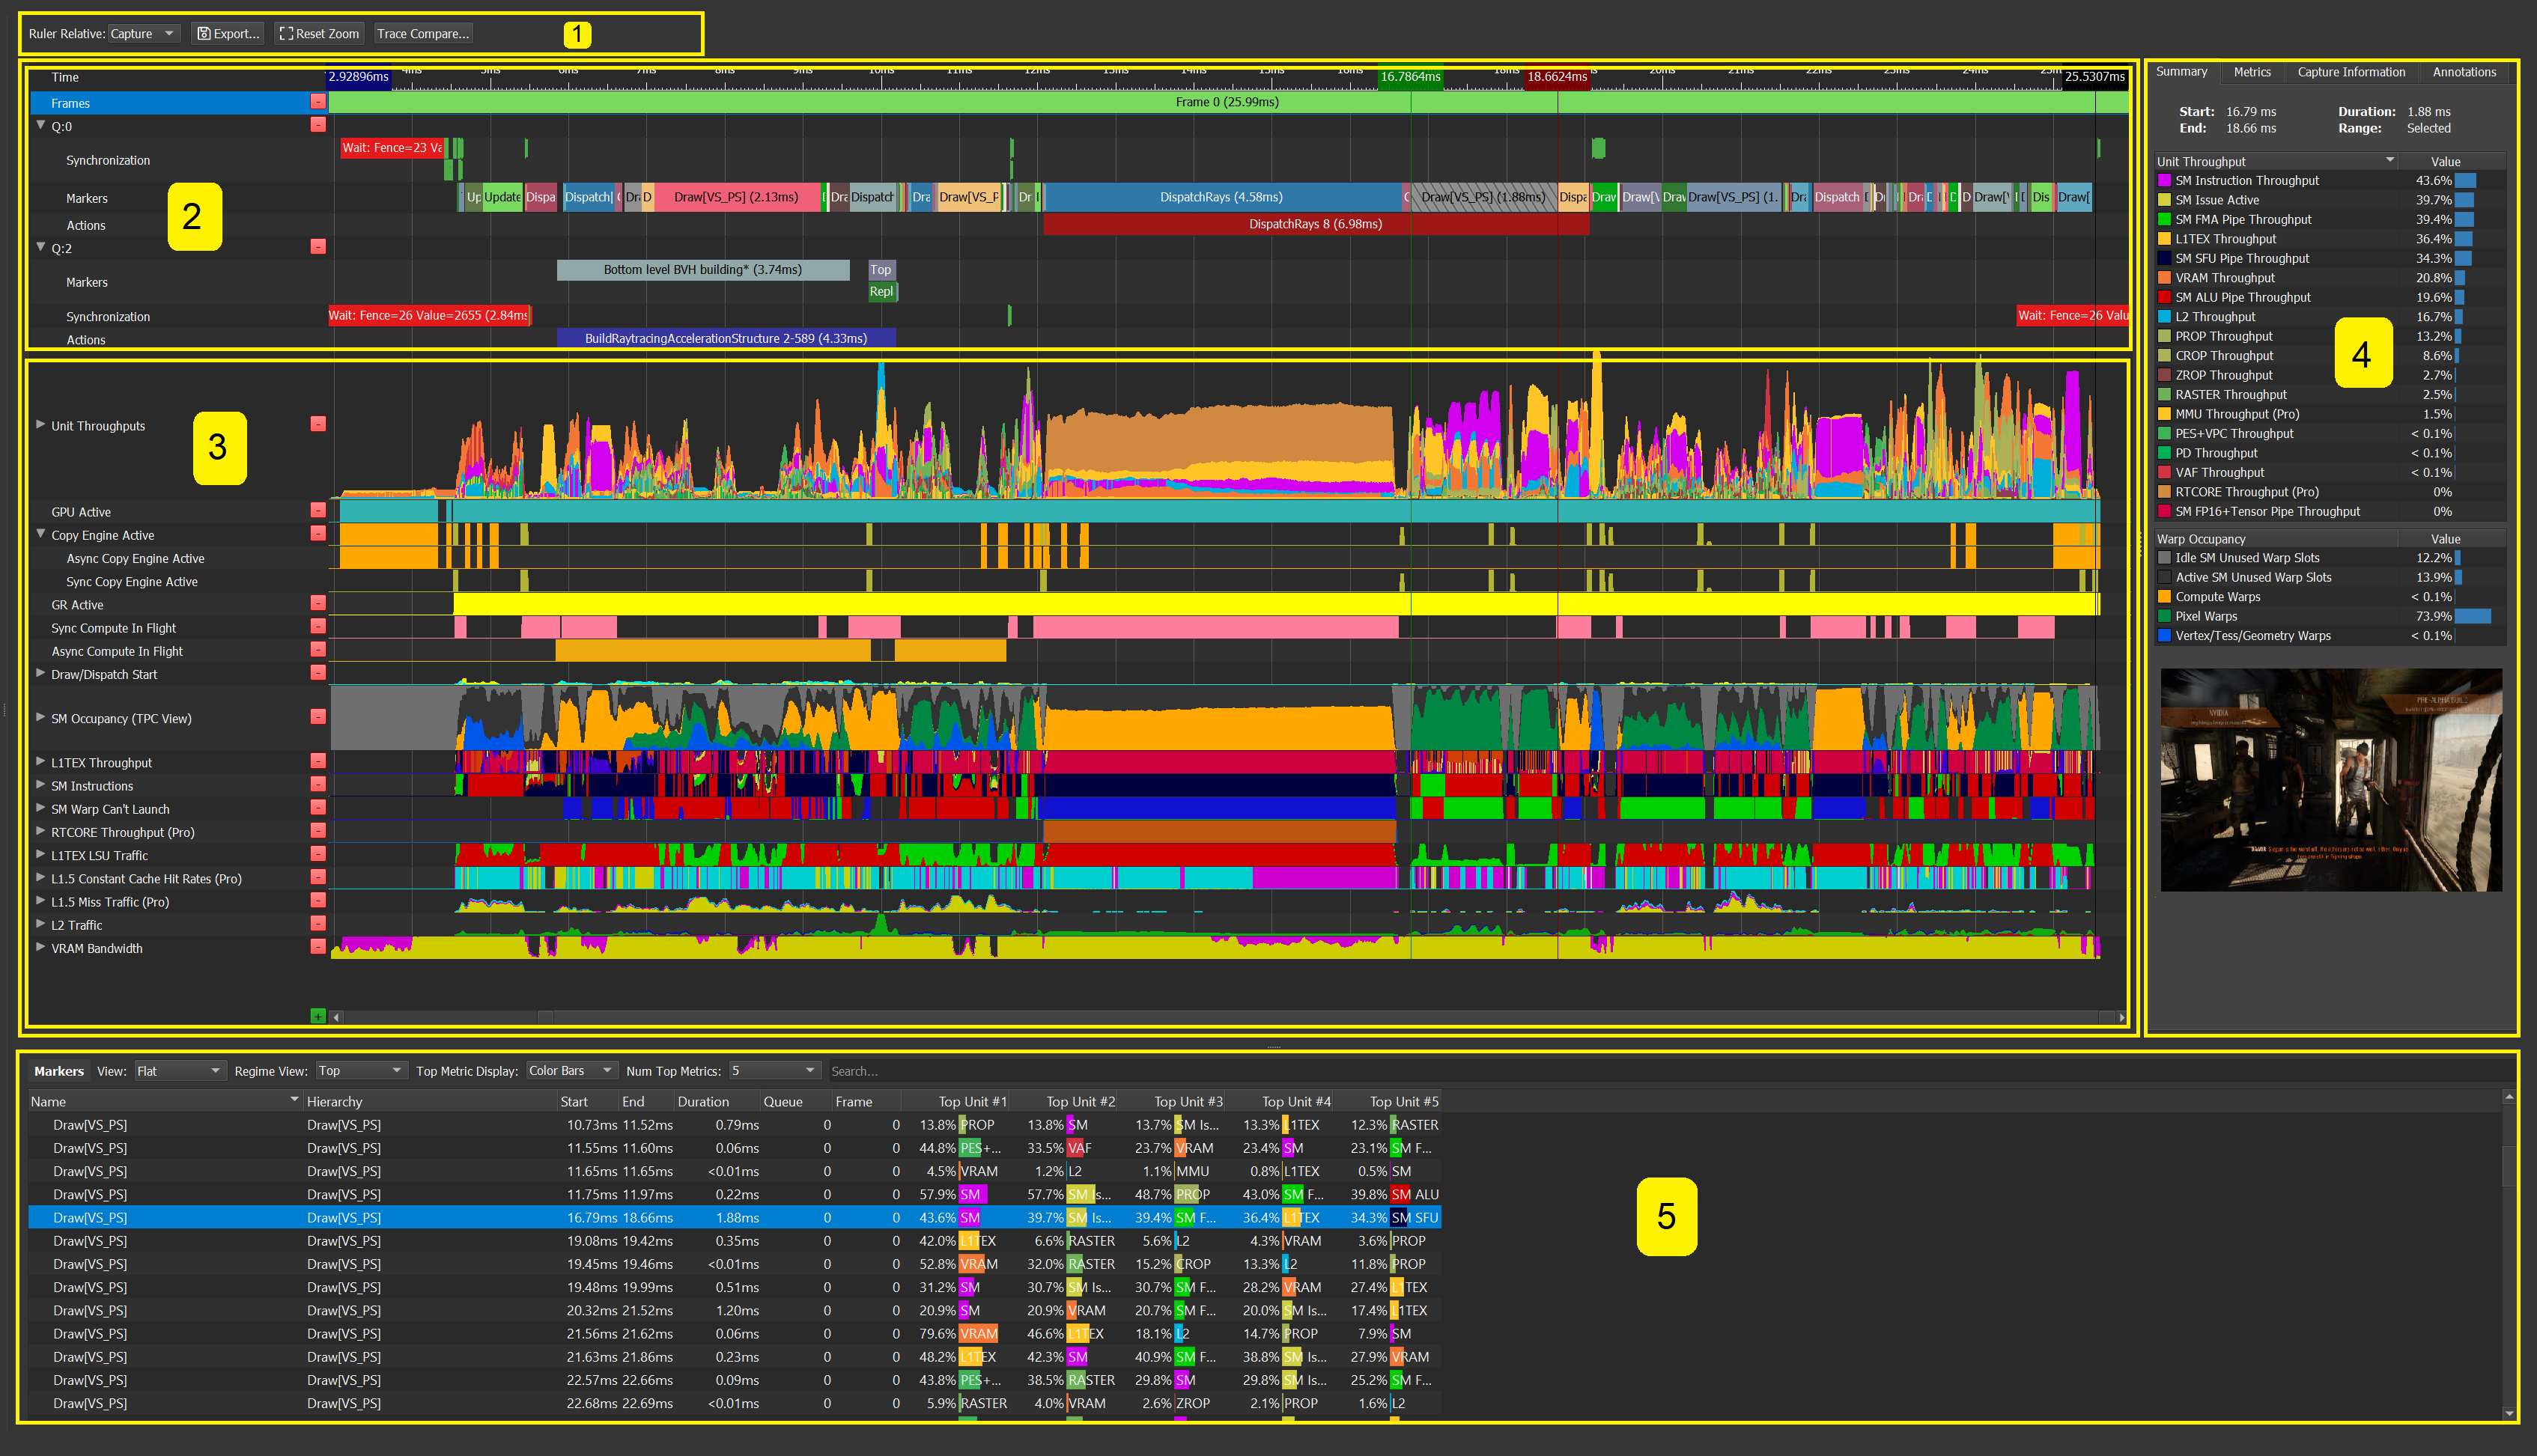
Capture Toolbar
At the left top of the Scrubber view, there are 3 buttons that extend the Scrubber's capabilities.
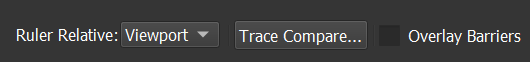
-
Ruler Relative: Controls the Zero point of the ruler. This can be:
-
Capture: Zero is when the capture begins.
-
Viewport: In this mode, if you select a regime and expand it, the beginning of the selected regime will be the beginning of the regime.
-
Cursor: Zero is where the mouse is.
-
-
Trace Compare: See Trace Compare.
At the right top of the scrubber view, there are the zoom buttons. These buttons may assist in navigating the scrubber to the desired regimes.

-
Start / End: Mark down the exact time for you start and end selection
-
Reset Zoom: Will reset the Scrubber zoom for the entire capture.
-
Zoom to Selection: Will zoom to the selected regimes. For multiple markers selectoin: Select multiple markers using mouse left-click + ctrl .
Scrubber: Frames Data and Per-Queue Events

Per-Queue Events
NVIDIA GPUs contain multiple independent engines that provide specialized functionality. These engines – such as the Graphics Queue, Compute Queue, and Copy Queue – can execute work in parallel.
In the GPU Trace Scrubber, you can observe actions and events that occurred throughout the frame execution, according to the queue it was executed on. The per-queue part of the Scrubber presents events, user markers, and actions.
Queue Synchronization Objects
NVIDIA GPUs contain multiple independent engines that provide specialized functionality. These engines – such as the Graphics Queue, Compute Queue and Copy Queue – can execute work in parallel. DirectX 12 enables the interface to synchronize work between queues. GPU Trace capture unveils when Wait and Signal commands are being executed with relevance to the queue. Once such a synchronization object bar is selected, a line connecting to the relevant event will be drawn. This makes it easy to understand when a wait event was triggered, when a signal event released it, and how much time a queue was in a 'waiting' state.
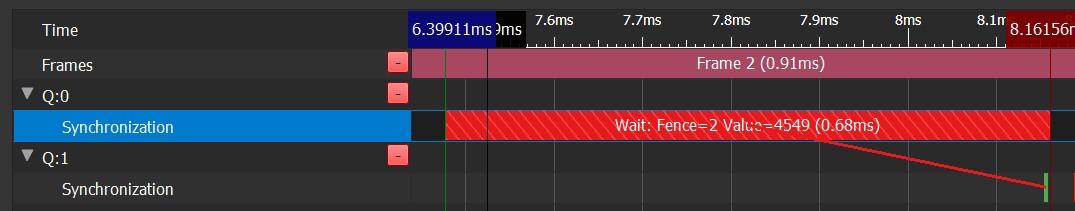
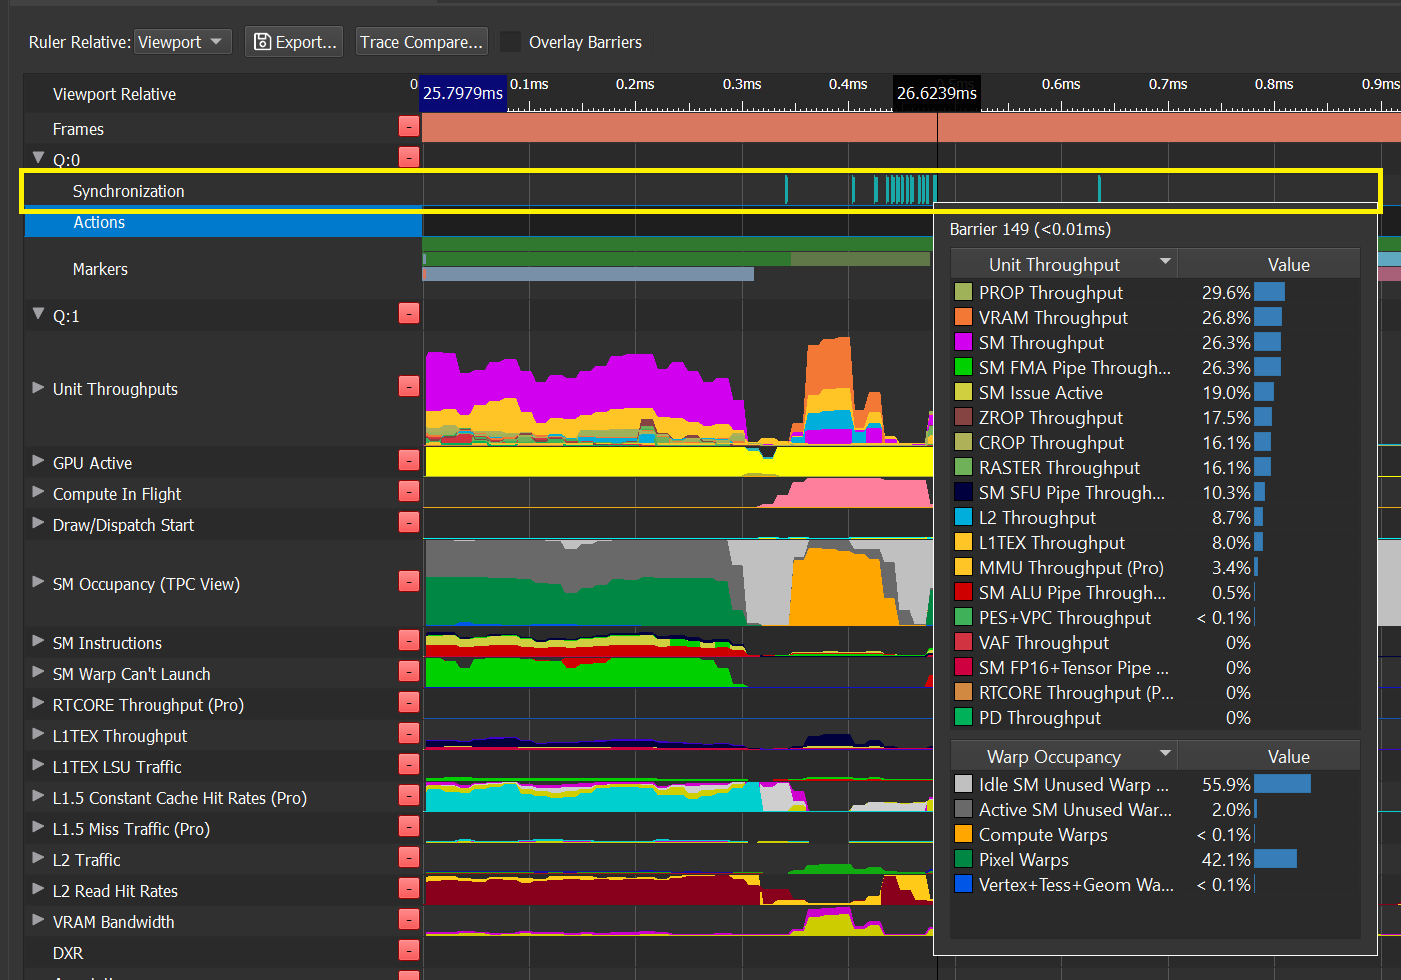
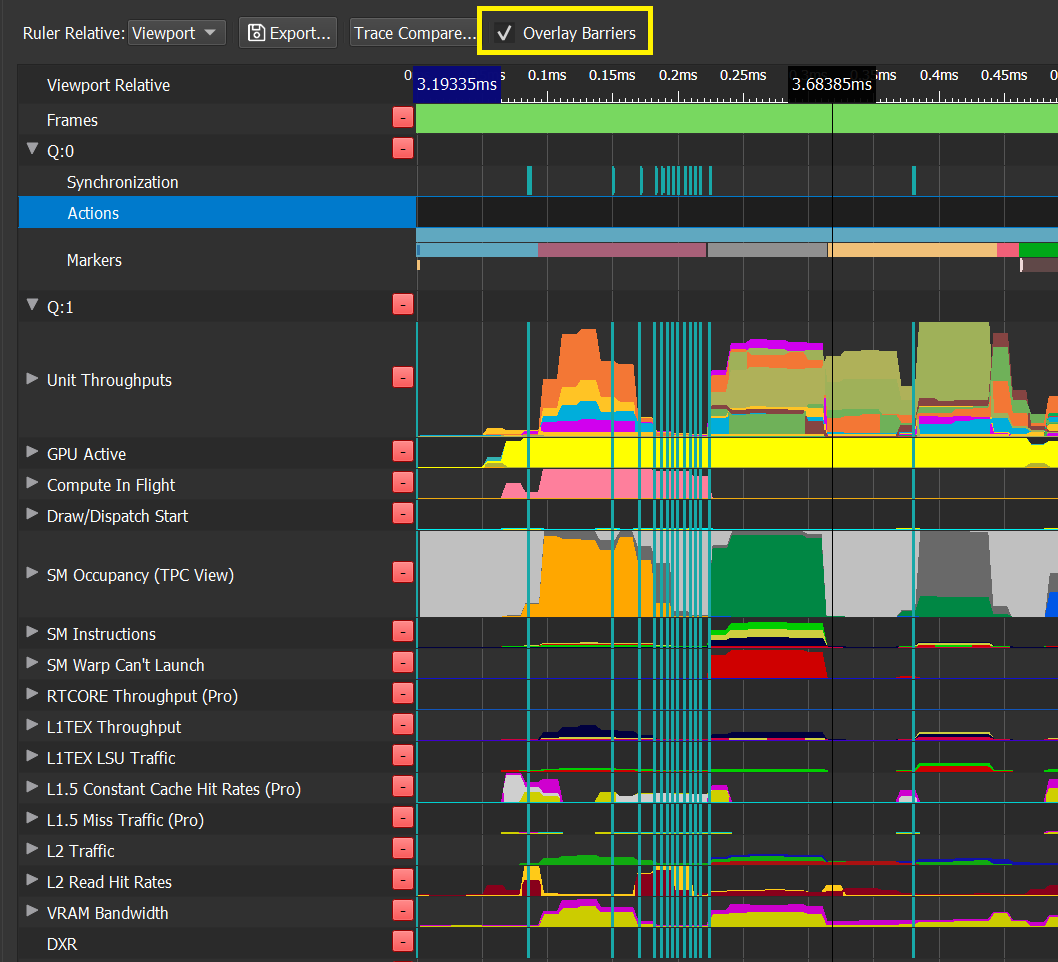

Actions Row
The Actions row shows the DXR actions, such as BuildRayTracingAccelerationStructure and DispatchRays, in correlation to the time it was executed and the queue it was executed on.
ExecuteCommandLists calls are also shown in the action row. In this case, the data presented in ExecuteCommandLists rectangle implies for the number of CommandsLists within the ExecuteCommandLists call.
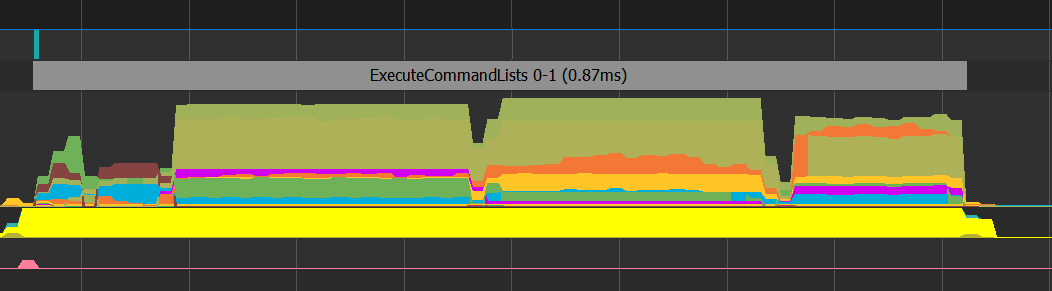
Scrubber: Metrics Graphs
The Metrics Data Rows can track NVIDIA GPU hardware units' activity using performance monitors. In this version of the GPU Trace, we enable you to capture this data and observe in detail the hardware utilization during the frame execution
|
Note: |
Note: In order to understand more what action items you can conclude from this data, the following blog is recommended: The Peak-Performance-Percentage Analysis Method for Optimizing Any GPU Workload https://devblogs.nvidia.com/the-peak-performance-analysis-method-for-optimizing-any-gpu-workload/ |
When hovering your mouse over the Scrubber, a tooltip appears that displays the average of the metrics data per the selected time. The data is sorted from high to low.
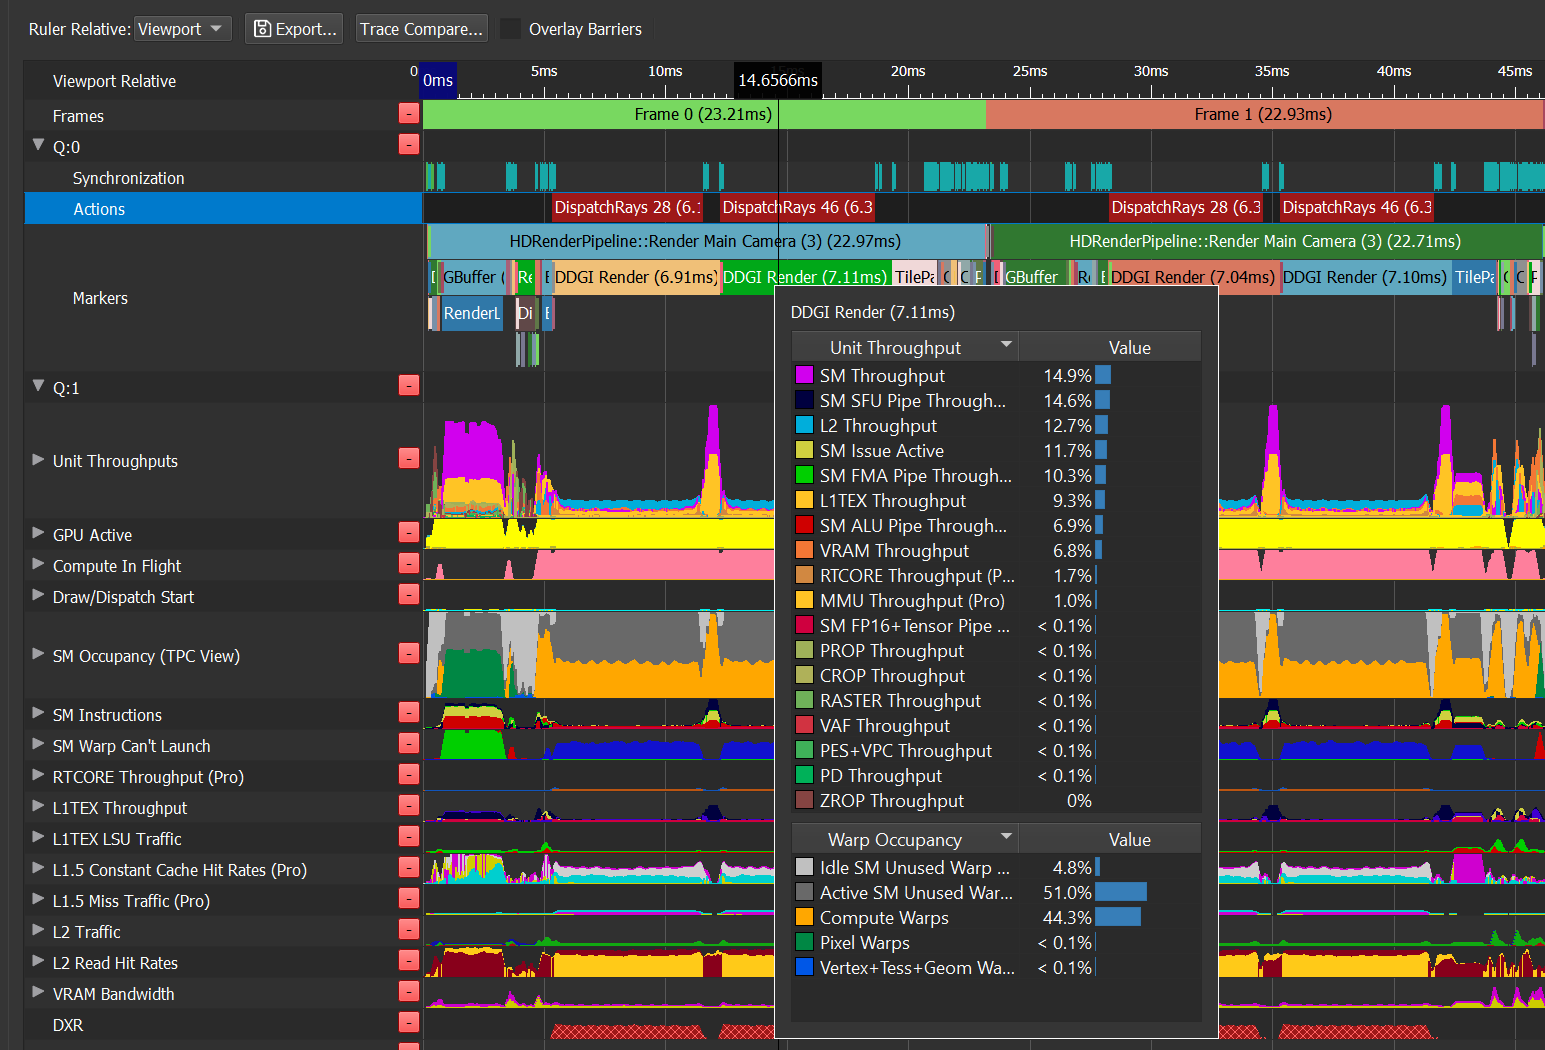
GPU Unit's Metrics Data Rows
GPU Trace presents hardware units' metric data captured throughout the frame execution. This data is presented in the Scrubber. Each counter data is presented in a specific row, while some counters are grouped for convenience. Hovering over the metric's name, a tooltip will be presented with the counter description. Group rows can be expanded to view individual counters.
The tooltip shows the counter data for the specific time where your mouse is pointed, or the average counter value for the selected range.
Handling Row in the Scrubber
GPU Trace captures a lot of data. It is possible to arrange the Scrubber in a way that will better meet your current needs and will allow you to focus on the area of your interest.
Removing Rows
Focus your performance triage operation by removing rows that are not the main concern by clicking the red - square.
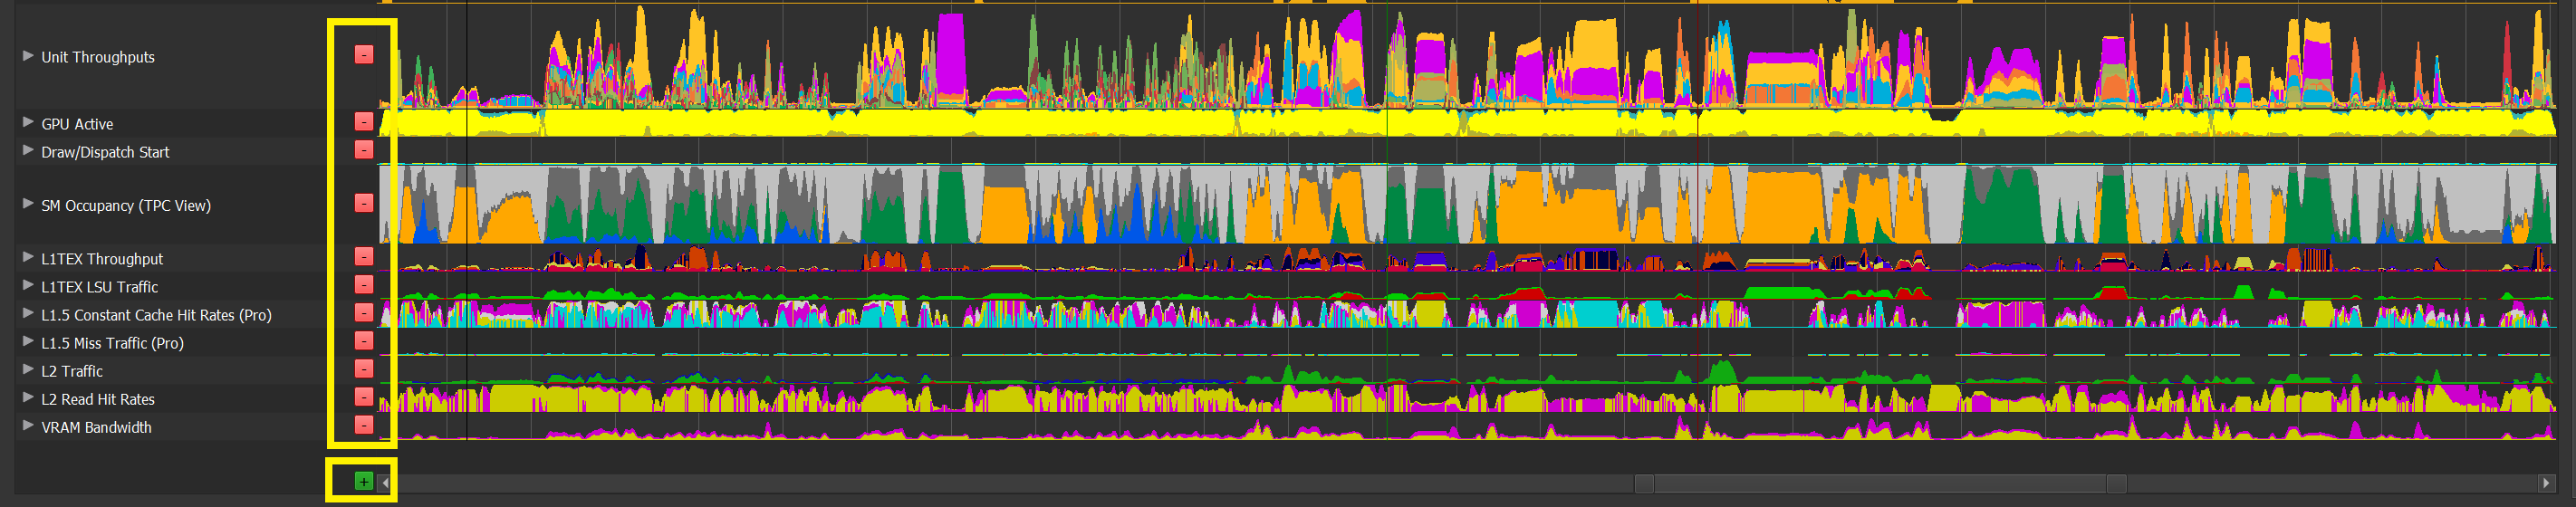
Clicking on the red - square will remove the row from the Scrubber view, but will not delete the data from the database. You can add the row back to the Scrubber by clicking the green + square at the bottom of the Scrubber.
Change Rows Location
You can change the Metrics Data Rows' location by pressing Alt + Left Click and dragging the rows to the desired location.
Information Tabs
The Information Tabs section provides general information on the capture, and also provides an additional view on the metrics data that were captured.
It contains 4 tabs:
Summary Tab
The upper section on the Summary tab provides details for the selected range. If no selection has been made, the information will be relevant to the entire visible range:
-
Start: The start time of the selected range or the visible range.
-
End: The end time of the selected range or the visible range.
-
Duration: The duration on the selected range or the visible range.
-
Range: An indicator whether the relevant data is applicable to a selected range on the visible range.
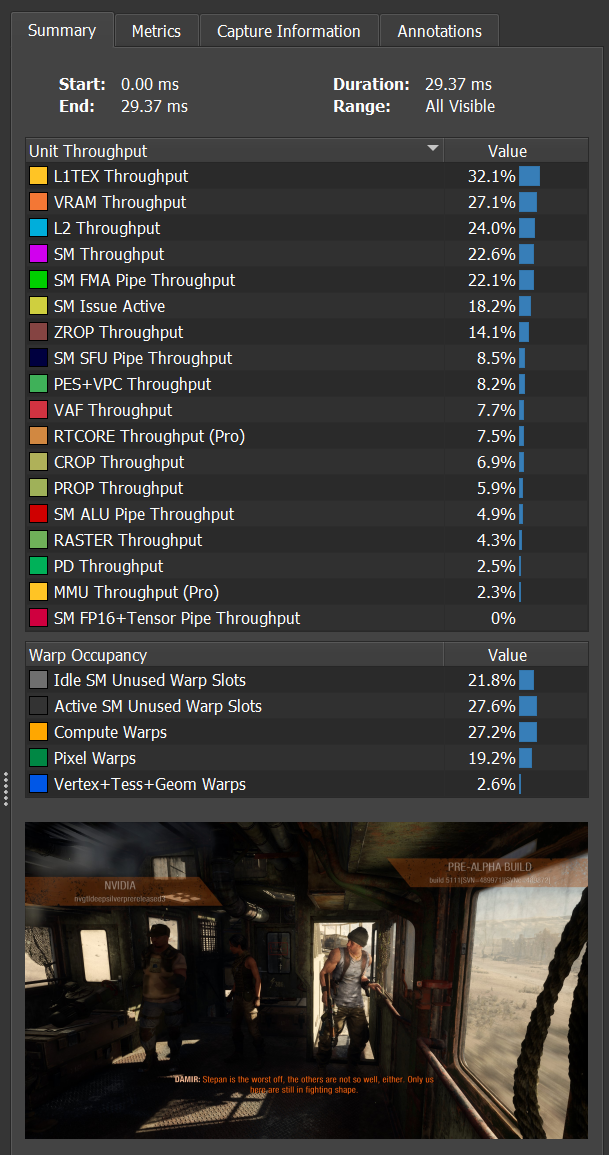
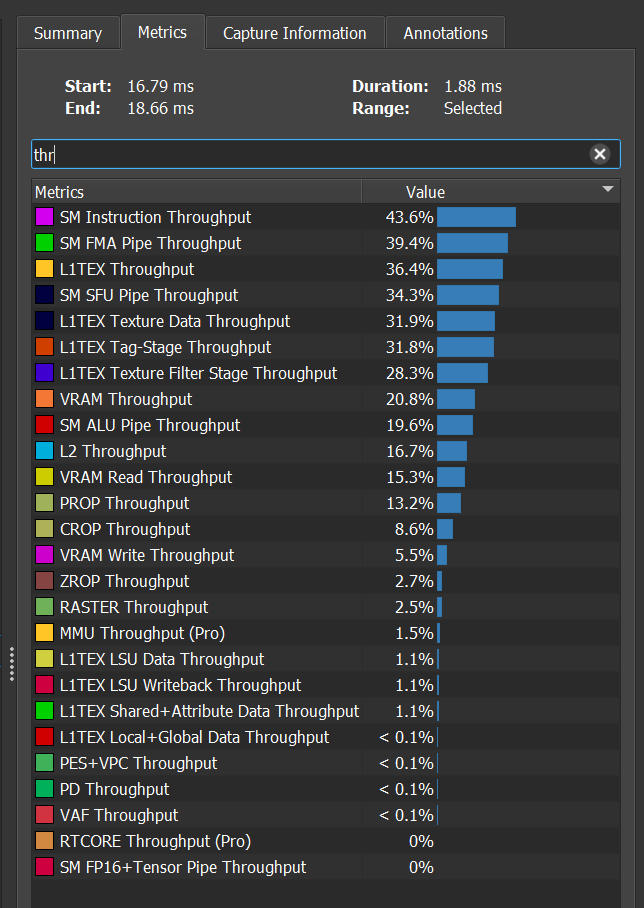
Capture Information Tab
The Capture Information tab provides general information of the capture, such the GPU model, CPU, and operating system that were used for the executable and comma line arguments run. This might be useful when trying to analyze workload behavior or reproduce issues.
Note that if there were any warnings or errors occurred while making this capture, they will appear in this tab.
Annotation Tab
GPU Trace allows you to insert your own custom user annotation. The remarks will be saved in the database.
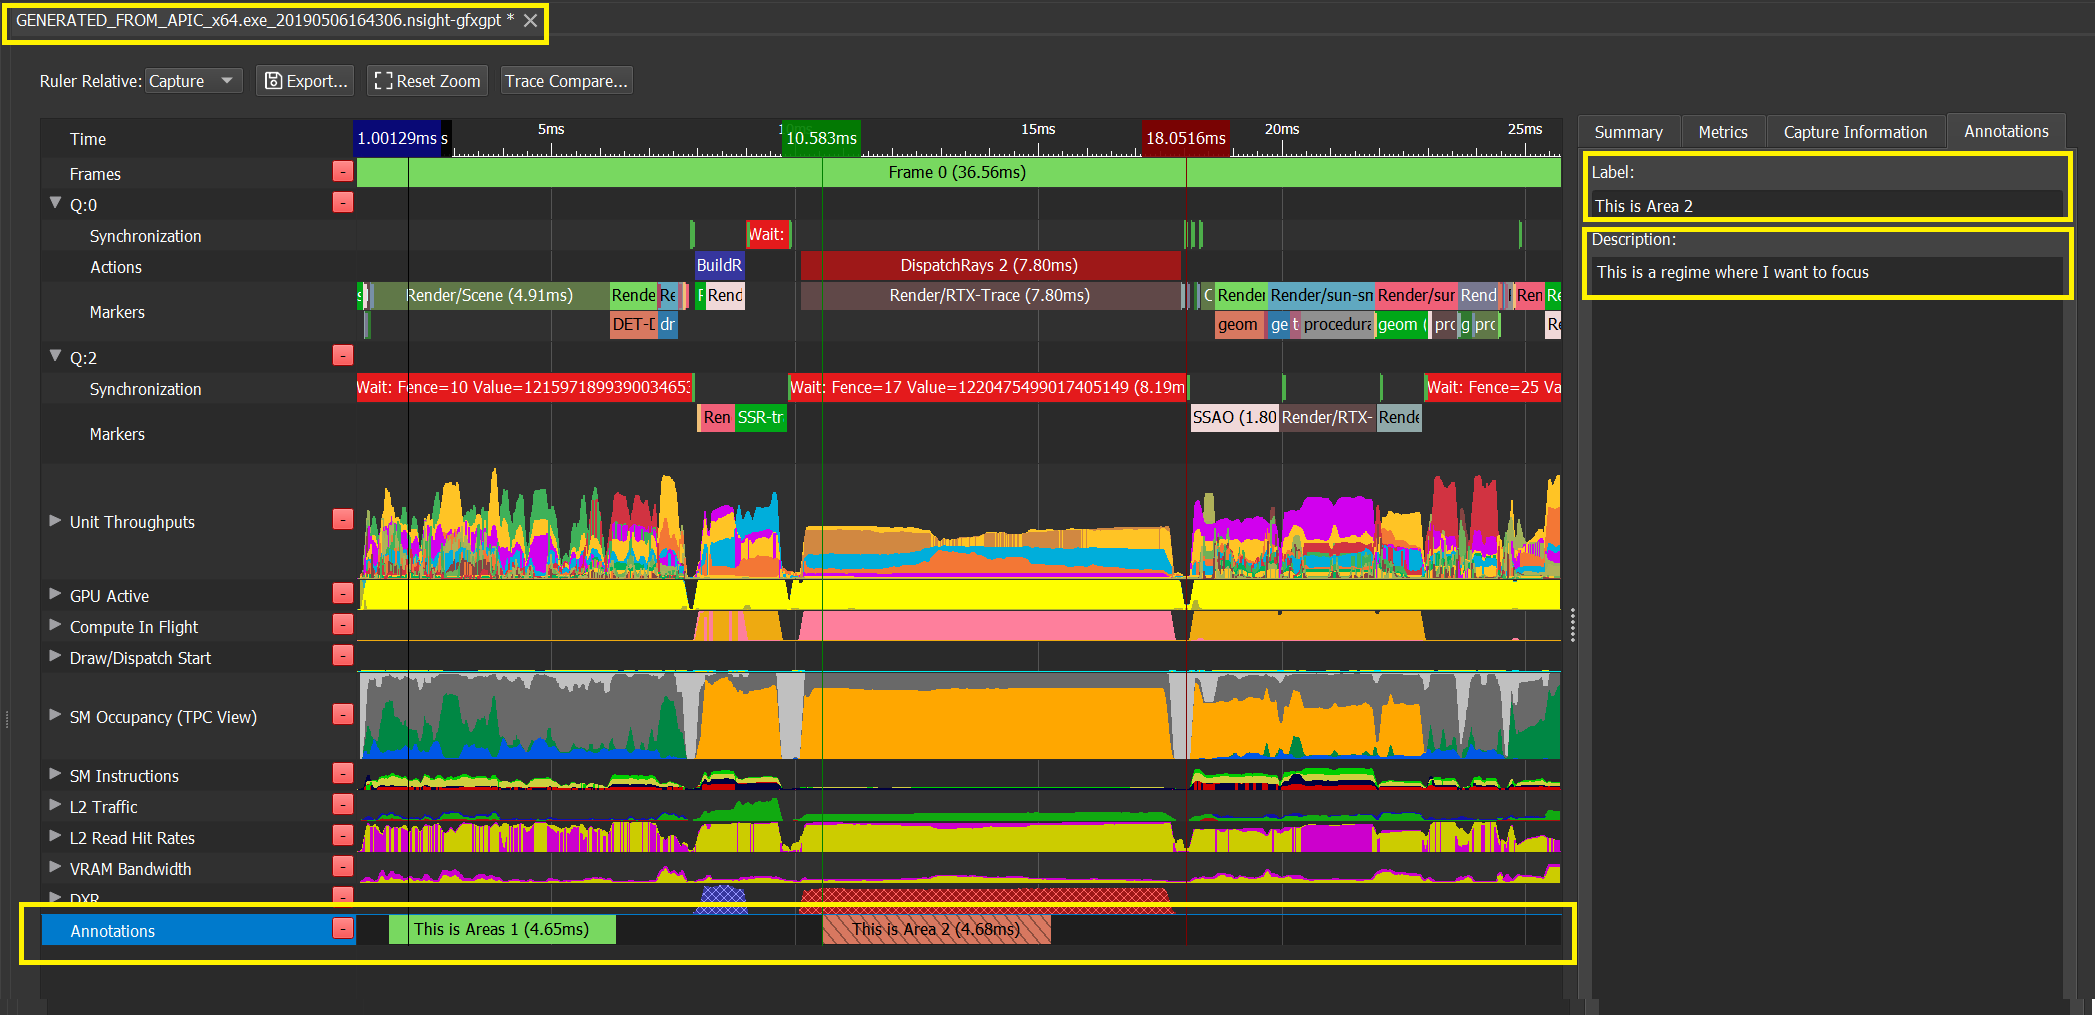
To add annotation:
-
Step 1: Click Shift+ Left Mouse Click to choose a regime in the annotation row.
-
Step 2: Switch to annotation tab to edit the regime name.
-
Step 3: If desired, add a description.
After creating the annotation, there is an asterisk near the capture name. Save the file in order to store the annotation for future reference.
Regime Table
The Regime Table is applicable to the user markers that exist in the captured application. It summarizes the user markers' data and correlates with the Scrubber so it is easier to find a regime and understand its metric data.
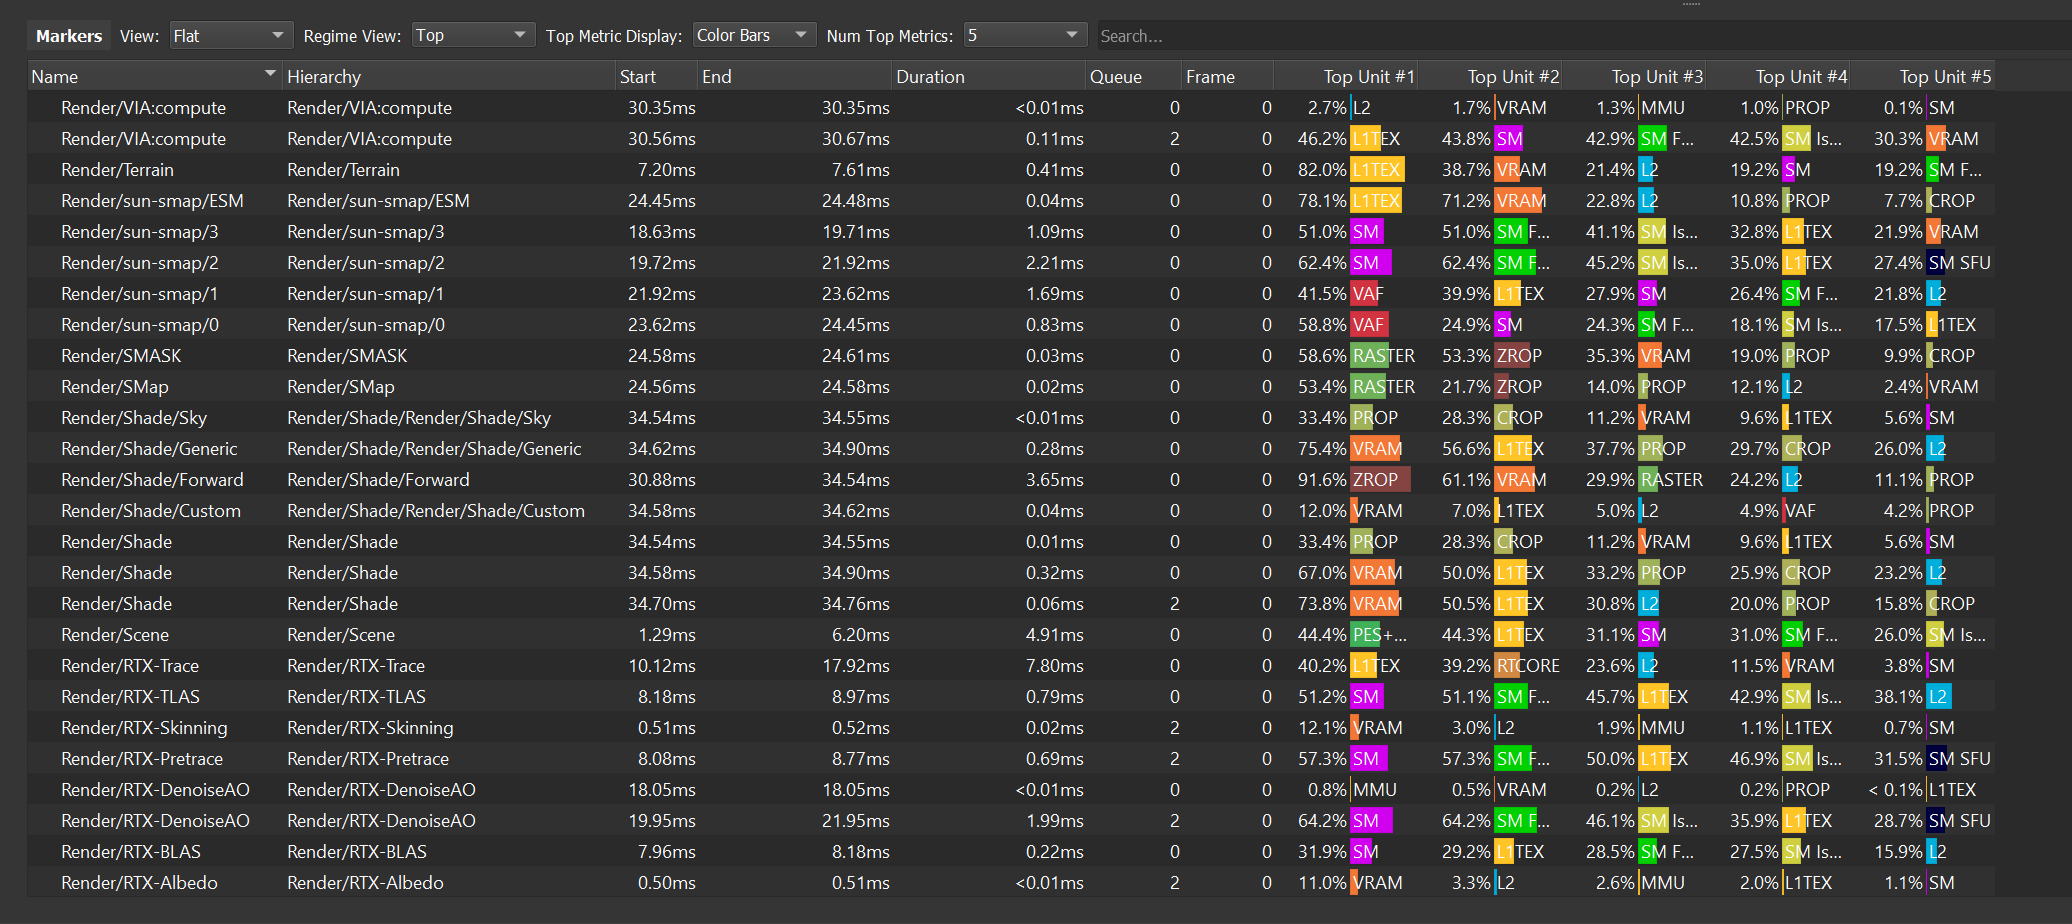
View: Flat vs Hierarchical
You can control in what order you would like to see the markers. Flat mode will show the marker name in the first row and the hierarchy in the second one. In the hierarchical mode, the markers are displayed in a tree view.
Regime View: Top vs. Summary
For convenience, you can control the data presented in the Regime Table. If you choose Summary, all the counters in the "Unit Throughput" row will be presented. If you switch to the Top view, only the top 5 will be presented.
Top Metric Display
You can choose if you would like to see the metrics data with color bars or without.
Number Top Metrics
Control the number of top metrics you would like to see.
Search Area
You can search for a specific marker name by simply typing the marker name or part of it.
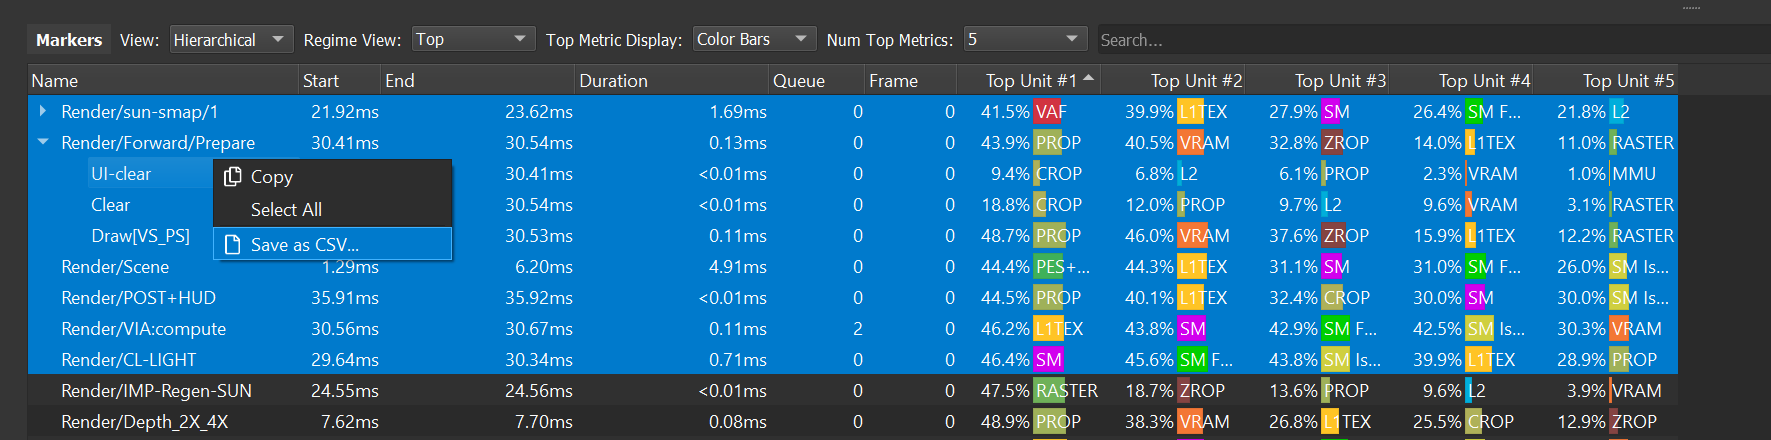
Trace Compare
The Trace Compare tool enables the GPU Trace user to easily analyze the effect of his code changes on a specific frame. It displays a simplified version of the GPU Trace time line for 2 frames. The frames are placed one on top of the other, with their start time aligned. Trace compare enables to compare either 2 frames from 2 different capture files or 2 frames within the same file.
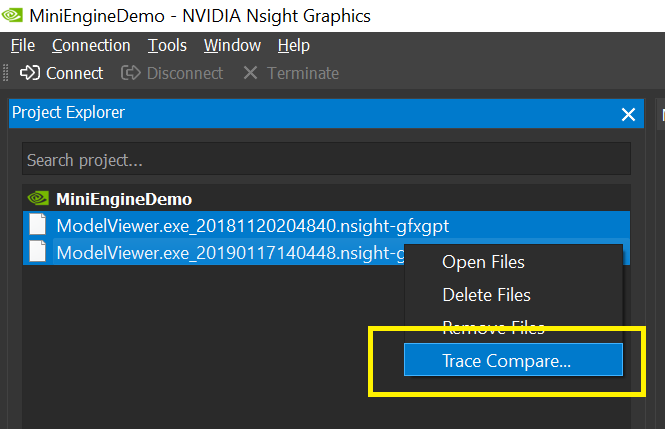
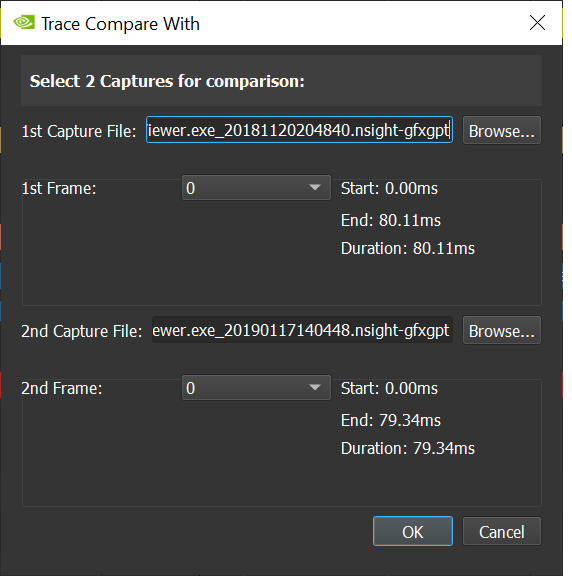
Using the Trace Compare Tool
Trace Compare displays the selected frames in a simplified version of the GPU Trace timeline, one on top of the other, aligning the frames' start time.
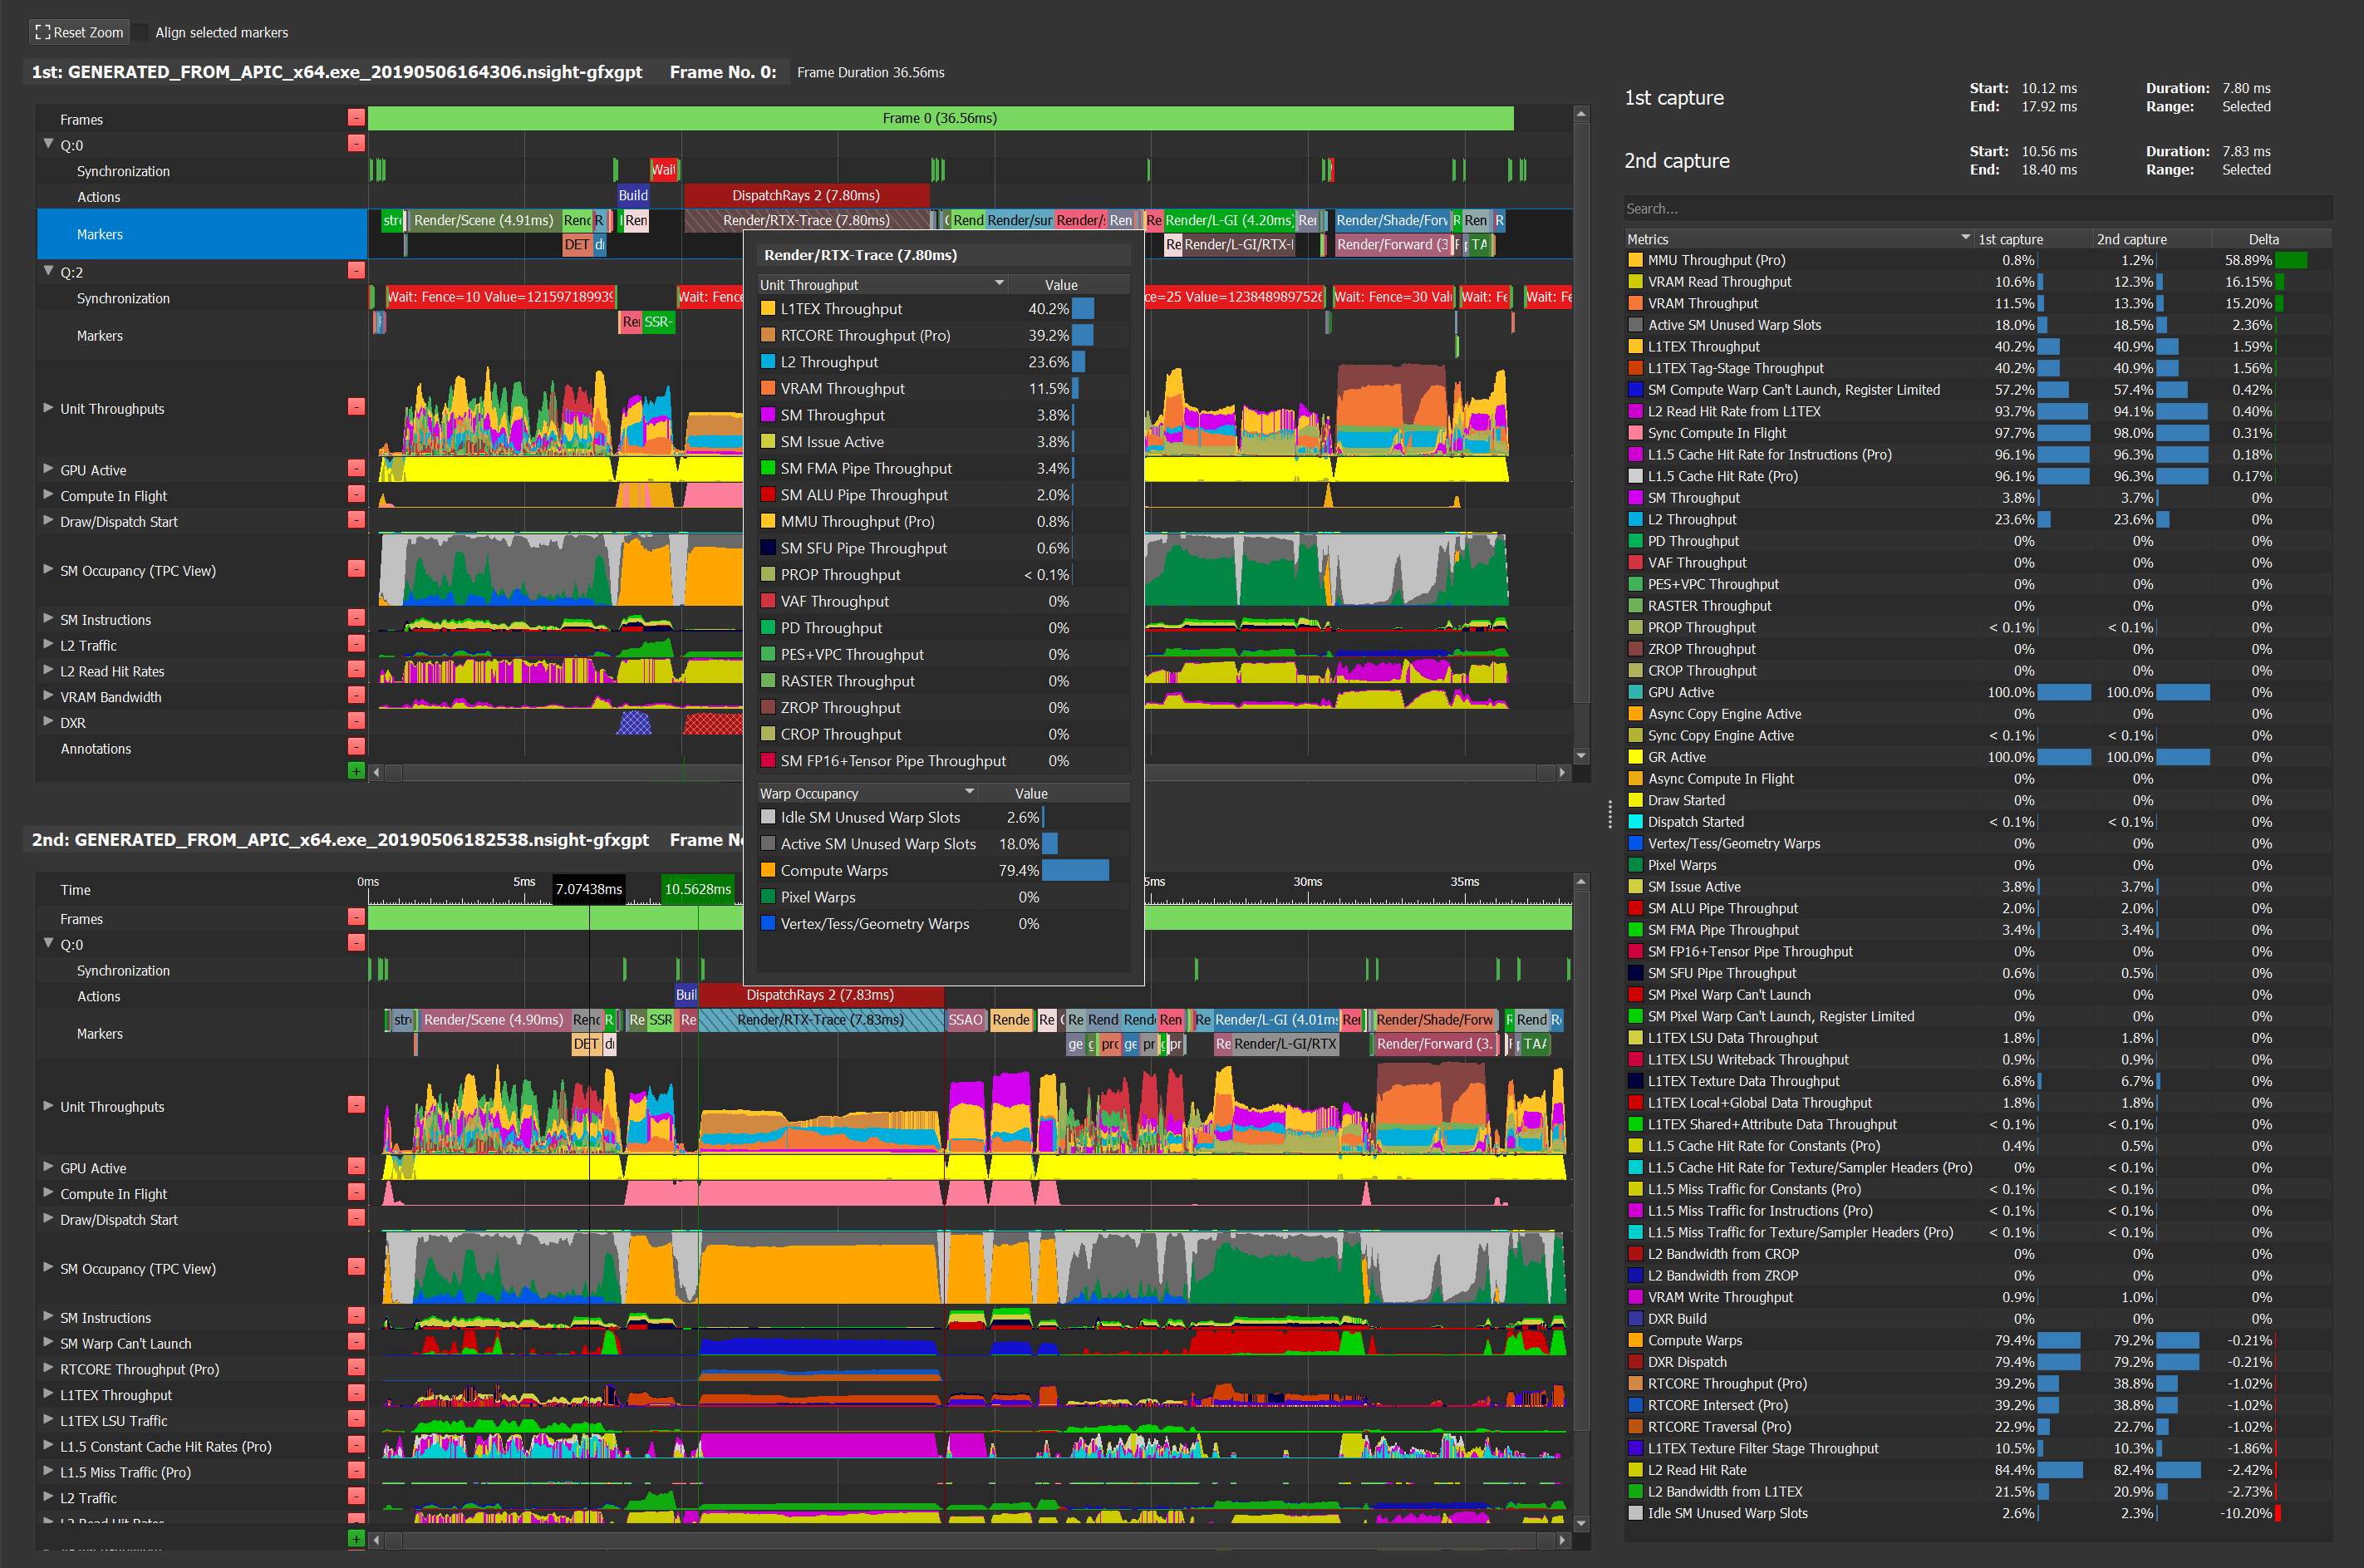
Markers are correlated as well, so when you click on a certain marker on one frame, the matching marker on the other frame will be chosen, if found.
Align to Marker
Sometimes it is easier to spot differences when the regime selected start times are aligned. Choose a specific marker and click the Align Selected Marker check box to activate the alignment.
Metrics Table in Trace Compare Mode
The detailed Metrics Table appears in this mode and shows the metrics data for each frame, side by side, and the delta between the values.
Additional Capture Options
Nsight Graphics framework enables launching an application with a specific set of command line arguments and / or environment variables. This is done via 'Connect to Process' dialog.
Below are special pre-defined environment variables:
Automatic Capture after X Number of Frames
Set WARPVIZ_CAPTURE_ON_FRAME to trigger a capture automatically after X number of frames elapsed.
For example:
WARPVIZ_CAPTURE_ON_FRAME=100 will trigger capture automatically, once, after 100 frames.
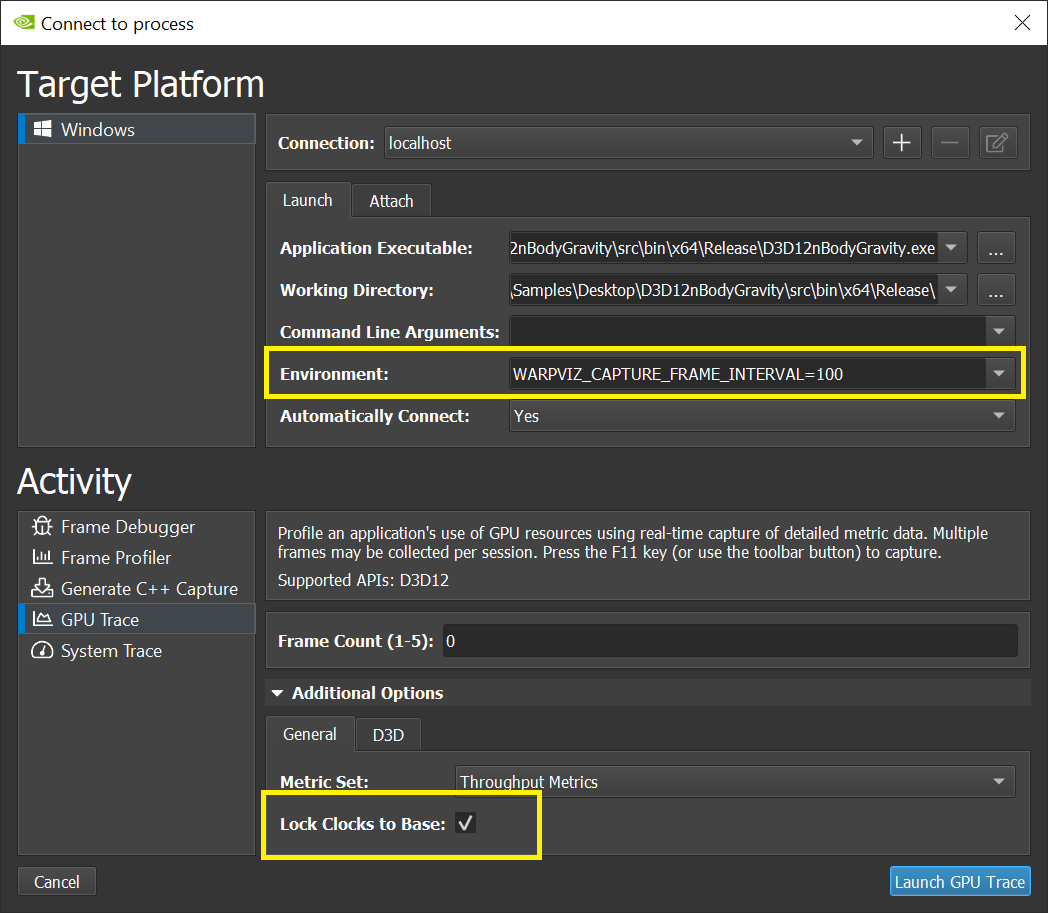
GPU Crash Dumps
GPU Crash Dump Monitor
GPU Crash Dump Monitor Settings
To configure the NVIDIA Nsight Aftermath Monitor settings, left-click the NVIDIA Nsight Aftermath Monitor icon in the Microsoft Windows system notification area (system tray) or right-click the icon and select the Settings option from the pop-up menu.
Aftermath Settings
The Aftermath Settings page allows you to configure various Nsight Aftermath driver options and set up a whitelist of applications for which to capture GPU crash dumps. These driver settings can only be modified if the NVIDIA Nsight Aftermath Monitor was started with Windows Administrator privileges.
Supported Aftermath Modes are the following:
-
Disabled disables all GPU crash dump creation.
-
Global enables crash dump creation for all applications using the D3D12 and D3D11 APIs.
-
Whitelist allows you to limit the GPU crash dump creation to a specific set of applications on the whitelist.
Generate Shader Debug Information enables debug information generation for (DXIL) shaders.
Note:
Enabling this setting will cause additional compilation overhead for generating the debug information and general driver overhead for handling the debug information during shader compilation.
Enable Resource Tracking enables driver side tracking of resources (textures, buffers, etc.) used to augment the GPU fault information in crash dumps.
Note:
Enabling this feature will cause additional driver overhead for tracking resource information.
Enable Call Stack Capturing enables automatic tracking of CPU call stacks for draw calls, dispatches, and copies. This data is collected for these calls, or can augment the data collected via Aftermath user markers. Enabling this feature will cause additional driver overhead for gathering the necessary information.
Note:
As with other crash dumps (like Windows minidump files), when this feature is enabled, the GPU crash dump file may contain the file path for the crashing applications executable, as well as the file paths for all DLLs loaded by the application.
Command Line Settings
All crash dump monitor settings can be also configured through command line parameters. The available options are:
-
--help Print help message with a list of available options.
-
--version Print the release version of the executable.
-
--crashdump-dir arg Set crash dump directory.
-
--debuginfo-dir arg Set debug info dump directory.
-
--prompt-on-crash Prompt to open NVIDIA Nsight Graphics after a crash is generated.
-
--hostname argThe host name of the machine on which to look for already existing NVIDIA Nsight Graphics instances.
Aftermath settings can be configured through a separate command line tool installed next to the crash dump monitor application: nv-aftermath-control.exe. The available configuration options are:
-
--mode arg Set Nsight Aftermath mode. Supported options for arg are: Disabled, Whitelist, or Global.
-
--debuginfo Generate shader debug information.
-
--resource-tracking Enable resource tracking.
-
--callstacks Enable call stack capturing.
-
--whitelist arg Add application to the Nsight Aftermath whitelist. arg must be of the following form:
ApplicationName MyApp ExecutableName myApp.exe
This option can be repeated to add multiple applications to the whitelist. This option also clears a previously set up whitelist.
Modifying Aftermath settings requires Windows Administrator privileges. Therefore, when this tool is run, a User Account Control confirmation window may pop-up asking for permission to modify system settings.
New Crash Dump Notification Dialog
If the NVIDIA Nsight Aftermath Monitor is configured to prompt on new crash dumps, every time a new GPU crash dump file is stored to the crash dump directory, a notification dialog will pop up indicating that a new GPU crash dump is available. This dialog shows the name generated for the new crash dump and also allows you to directly open it in a newly launched instance of NVIDIA Nsight Graphics or in an already running instance of NVIDIA Nsight Graphics.
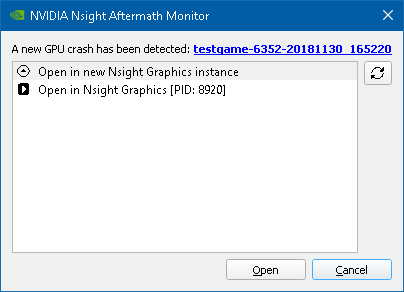
GPU Crash Dump Inspector
The GPU Crash Dump Inspector window is comprised of two major views:
-
In the left part of the window, there is a set of tabs that provide summary information for the open GPU crash dump file, as well as information about the captured crash.
-
In the right part of the window, there is a multi-purpose area that shows detailed information based on selections made in some of the sections of the left-side tabs.
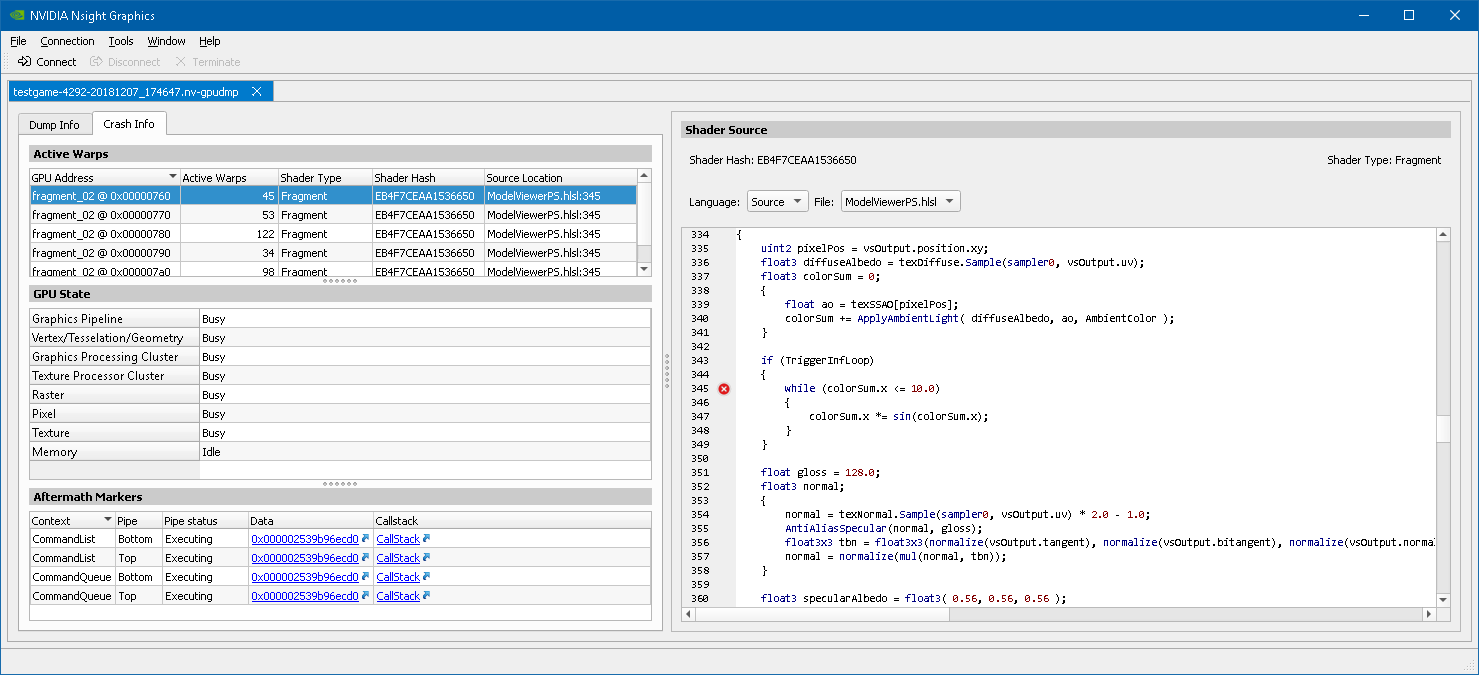
Dump Info
The Dump Info tab provides summary information for the open GPU crash dump file and the data contained in the dump. It is comprised of the following sections:
-
The Dump Details section summarizes information about the GPU crash dump file, such as the file name, the date and time the dump was created, and the size of the file.
-
The Application section summarizes information about the application for which the GPU crash dump file was captured, like the name of the executable, the process identifier of the corresponding process, and which graphics API was used.
-
The Exception Summary section summarizes information about the reason for the GPU crash or GPU hang captured in the GPU crash dump file. It shows what state the graphics adapter and D3D device were in when the device recovery was triggered (TDR).
-
The System Info section summarizes the information about the system on which the GPU crash dump file was captured. This include information about the operating system, the graphics driver, and the GPU on which the has crash happened.
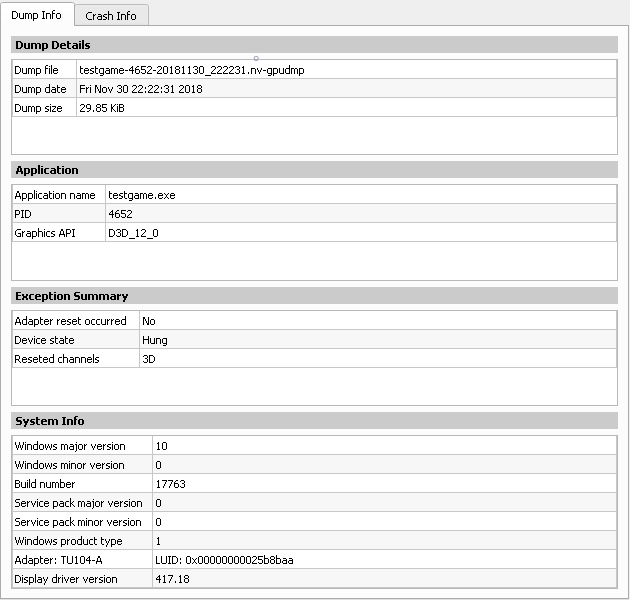
Crash Info
The Crash Info tab provides detailed information for data captured in the open GPU crash dump file. The available sections will vary based on the type of the crash and what information was captured into the crash dump.
-
The Active Warps section, if available, shows all active shader executions at the time of the crash or hang. Each row shows the summary for all the warps executing at a specific shader address, including the number of warps, the type of the shader, the shader hash, and the corresponding location within the source shader (if source shader debug information is available). Clicking a row in the table will open the corresponding Shader View.
-
The Page Fault section, if available, shows information about the GPU page fault that caused the crash. Besides the address that caused the page fault, it may also show information about the resource that is mapped or was mapped at that address.
-
The GPU State section shows a high-level summary of the state of various parts of the GPU. This can be helpful to track down which parts of the graphics pipeline were active or have faulted in the case of a crash.
-
The Aftermath Markers section, if available, shows a summary of the Aftermath event markers last processed by the GPU for each of the registered Aftermath contexts. Clicking the links in the table will open the corresponding Aftermath Markers View or Aftermath Call Stack View. See also the event marker documentation in GFSDK_Aftermath.h for more detail.
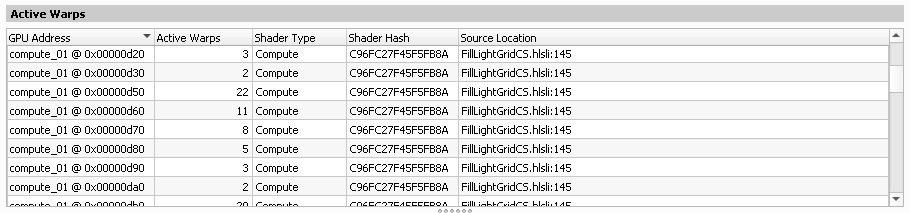
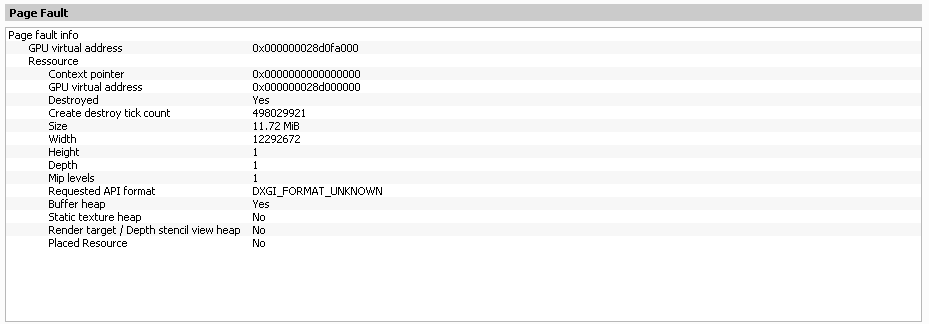
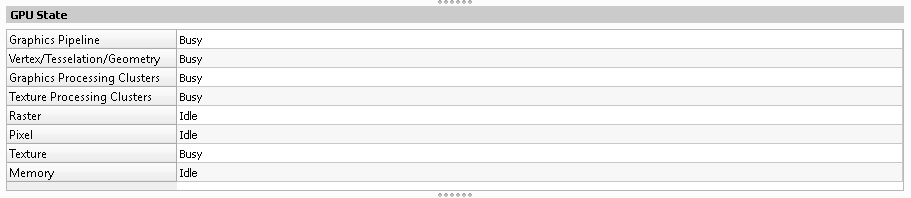
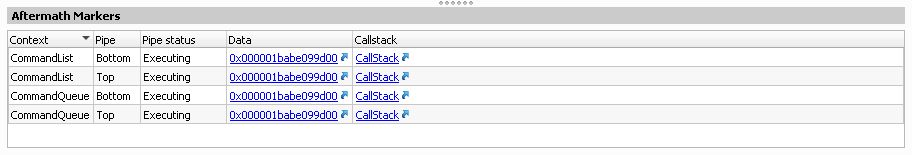
Shader View
The Shader Source view shows the shader code related to the selection made in the Active Warps view. Depending on what information is available for the shader the Language selection box provides the following options:
-
If Source is selected the view shows the high-level shader source (HLSL) of the shader corresponding to the row selected in the Active Warps view. If the shader was compiled from several source files the File selection box allows to switch between the source files. The shader source line that was executed when the crash dump was created is marked with a red circle.
-
If IL is selected, the view shows the DXIL of the shader corresponding to the row selected in the Active Warps view. The DXIL statement that was executed when the crash dump was created is marked with a red circle.
-
If SASS is selected the view shows the native shader assembly (SASS) of the shader corresponding to the row selected in the Active Warps view. The instruction about to be executed when the crash dump was created is marked with a red circle.
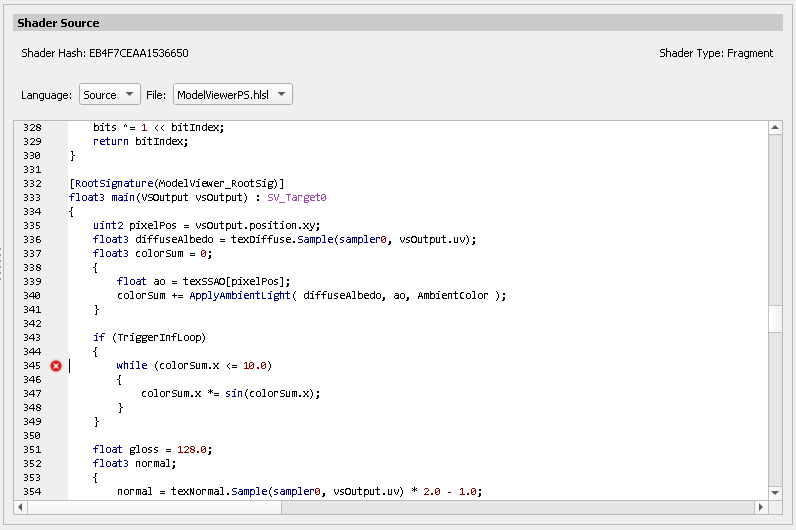
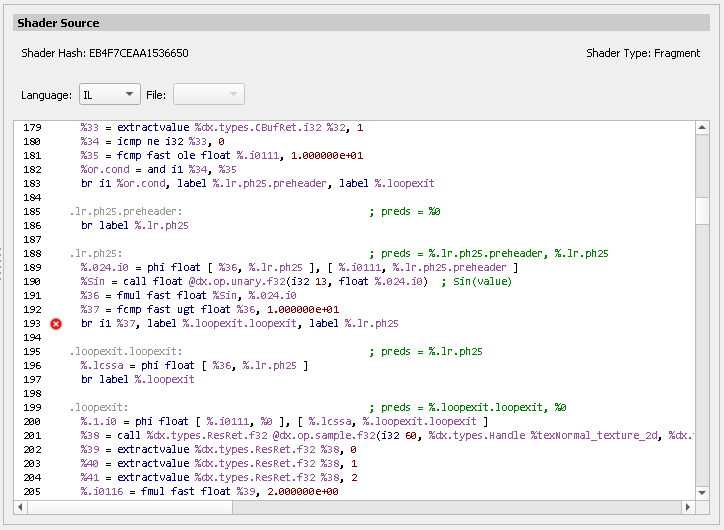
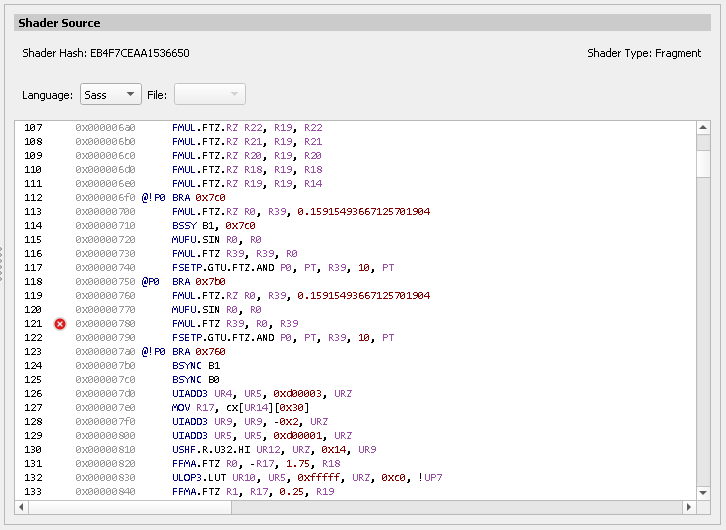
Aftermath Marker Data View
The Aftermath Marker Data view allows inspection of the Aftermath event marker data provided by the application. Since Aftermath event marker data is typeless the marker data view supports different Data view modes for interpretation of the raw data:
-
As string interprets the event marker data as zero-terminated UTF-8 character string.
-
As wide string interprets the event marker data as zero-terminated wide character string.
-
Custom allows to inspect the raw event marker byte data or to provide a custom interpretation of the data using a Structured Memory Configuration.
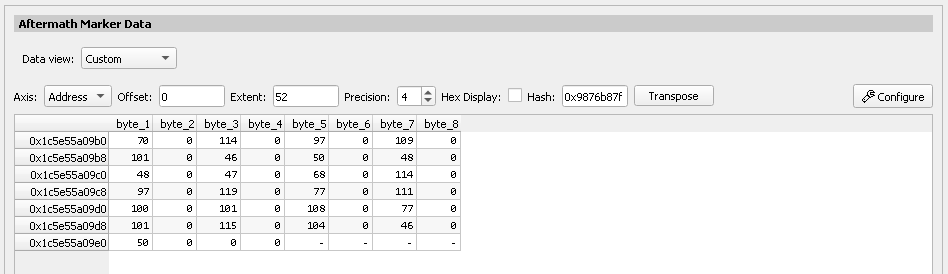
Aftermath Marker Call Stack View
The Aftermath Marker Call Stack view shows the call stack for the last draw, dispatch, or copy call processed by the GPU. Resolving the call stack to source location requires a properly set up PDB search path in the Crash Dump Inspector Settings. Alternatively, clicking the Unknown Symbol link allows to provide a PDB file for a specific call stack element.
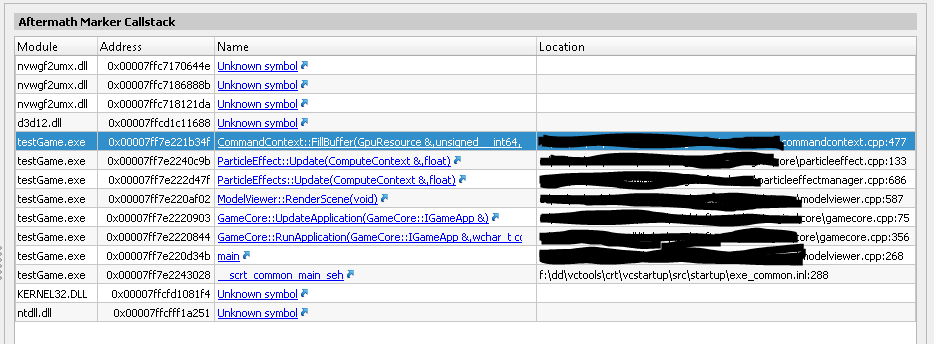
Project Explorer
The Project Explorer offers a view of all data associated with the current project. It will contain data files, sorted by the time of generation. Note that you may also include arbitrary links to other files as a useful aid in correlating data.
In addition to navigating via the Project Explorer, you may wish to see the files that were recently generated. Load these through File > Recent Files, or File > Open File.
Options
The Options dialog, accessed via the Tools > Options... menu, allows you to configure NVIDIA Nsight Graphics in a number of different ways. Each section is detailed below. The options selected are persisted in user settings for the next time you run the tool.
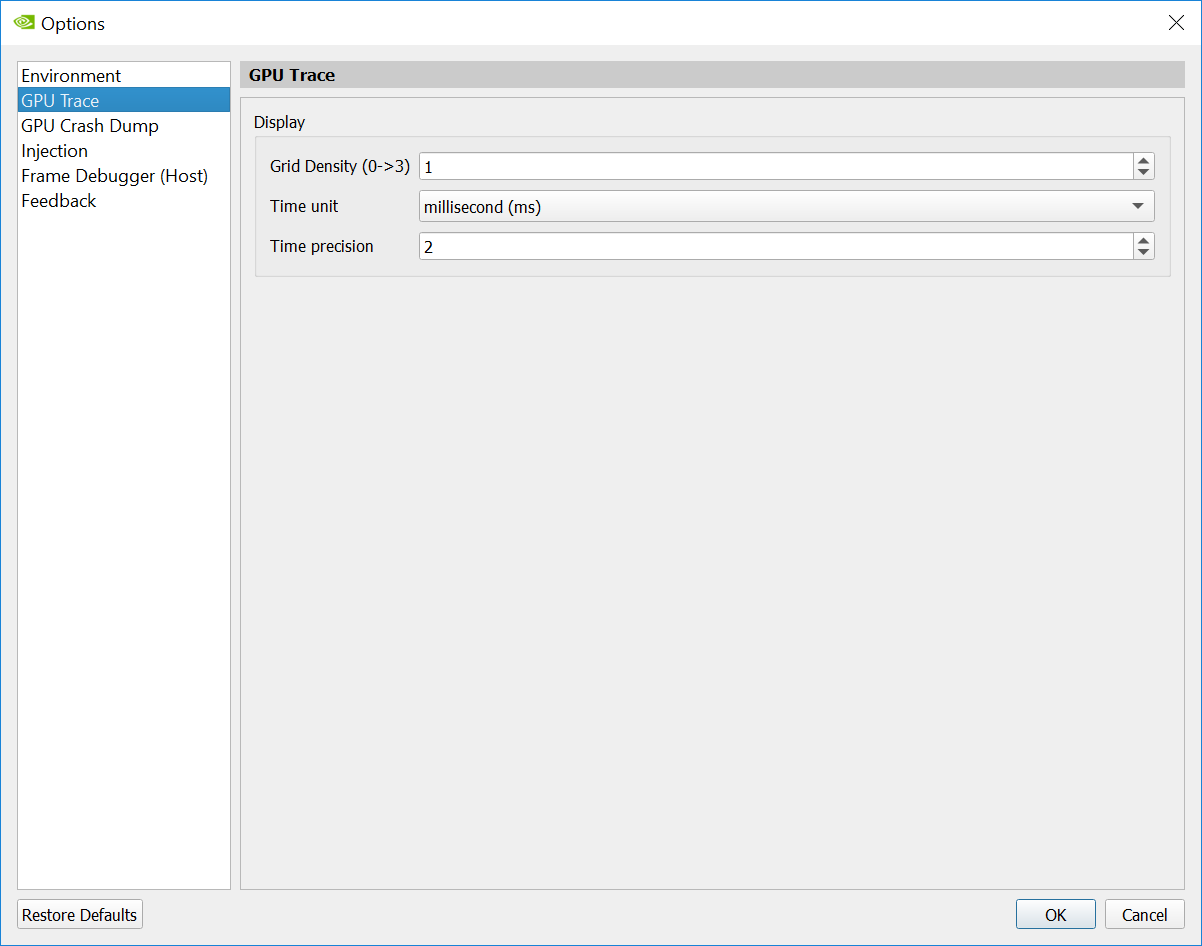
GPU Crash Dump
On the GPU Crash Dump tab, you can configure settings used by the NVIDIA Nsight Aftermath GPU Crash Dump Inspector.
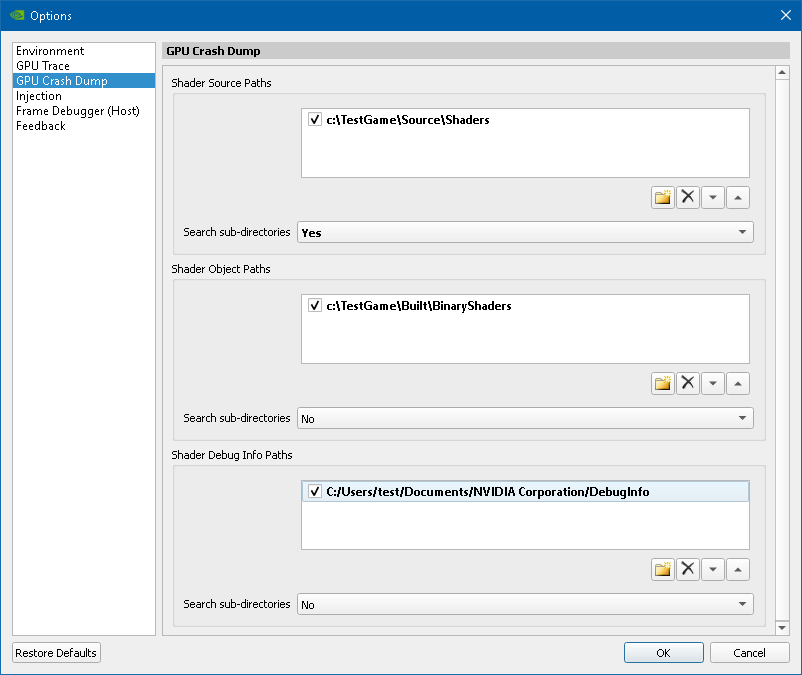
-
Shader Source Paths allows you to provide a list of directories where source shaders can be found. It is possible to recursively search the configured directories by enabling the Search sub-directories option.
-
Shader Object Paths allows you to provide a list of directories where pre-compiled binary shader objects can be found. It is possible to recursively search the configured directories by enabling the Search sub-directories option.
-
Shader Source Paths allows you to provide a list of directories where shader debug information files generated by the NVIDIA Nsight Aftermath Monitor can be found. It is possible to recursively search the configured directories by enabling the Search sub-directories option.
-
PDB Search Paths allows you to provide a list of directories where PDBs for the application that is analyzed and the DLLs it has loaded can be found. It is possible to recursively search the configured directories by enabling the Search sub-directories option.
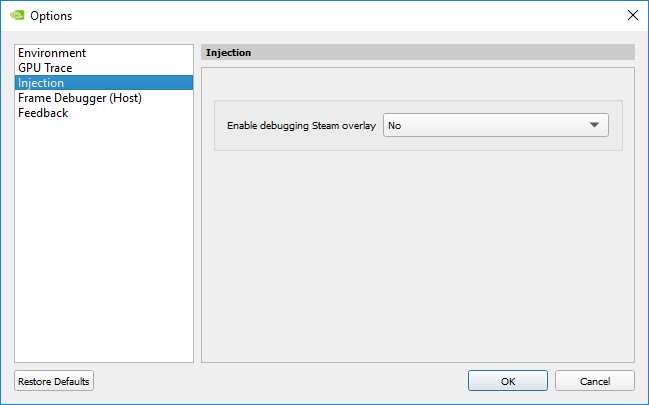
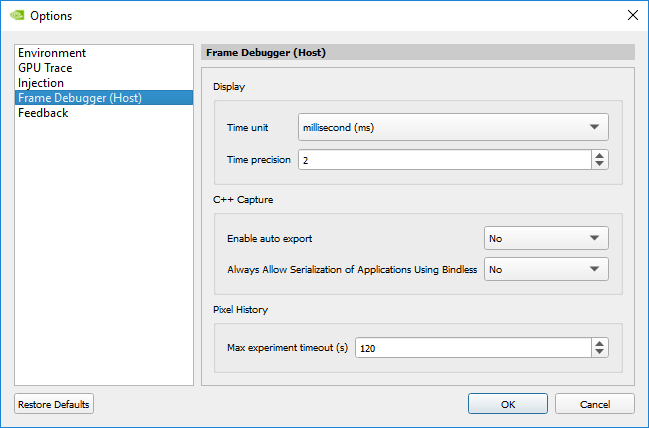
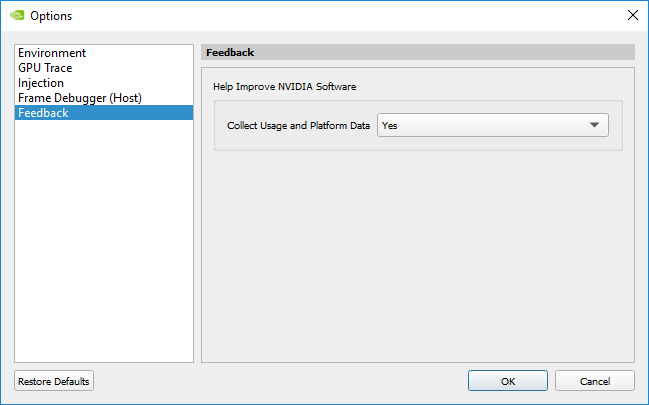
Common Capabilities
NVIDIA Nsight Graphics supports docking multiple windows within the main window. Any window may be moved, adjusted, tabbed, or pulled out from the docking system that it provides. Most default layouts have multiple documents already specified, but if you wish to adjust these documents you can do so at any time.
Beyond positioning, when frame debugging or profiling, there are buttons that are common across several frame debugger views.
- The Clone button makes a copy of the current view, so that you can compare different parts of the API Inspector (or other cloned views) for the current action.
- The Lock button freezes the current view so that changing the current event does not update this view. This is helpful when trying to compare the same state on two different actions.
Notices
Notice
THE INFORMATION IN THIS GUIDE AND ALL OTHER INFORMATION CONTAINED IN NVIDIA DOCUMENTATION REFERENCED IN THIS GUIDE IS PROVIDED “AS IS.” NVIDIA MAKES NO WARRANTIES, EXPRESSED, IMPLIED, STATUTORY, OR OTHERWISE WITH RESPECT TO THE INFORMATION FOR THE PRODUCT, AND EXPRESSLY DISCLAIMS ALL IMPLIED WARRANTIES OF NONINFRINGEMENT, MERCHANTABILITY, AND FITNESS FOR A PARTICULAR PURPOSE. Notwithstanding any damages that customer might incur for any reason whatsoever, NVIDIA’s aggregate and cumulative liability towards customer for the product described in this guide shall be limited in accordance with the NVIDIA terms and conditions of sale for the product.
THE NVIDIA PRODUCT DESCRIBED IN THIS GUIDE IS NOT FAULT TOLERANT AND IS NOT DESIGNED, MANUFACTURED OR INTENDED FOR USE IN CONNECTION WITH THE DESIGN, CONSTRUCTION, MAINTENANCE, AND/OR OPERATION OF ANY SYSTEM WHERE THE USE OR A FAILURE OF SUCH SYSTEM COULD RESULT IN A SITUATION THAT THREATENS THE SAFETY OF HUMAN LIFE OR SEVERE PHYSICAL HARM OR PROPERTY DAMAGE (INCLUDING, FOR EXAMPLE, USE IN CONNECTION WITH ANY NUCLEAR, AVIONICS, LIFE SUPPORT OR OTHER LIFE CRITICAL APPLICATION). NVIDIA EXPRESSLY DISCLAIMS ANY EXPRESS OR IMPLIED WARRANTY OF FITNESS FOR SUCH HIGH RISK USES. NVIDIA SHALL NOT BE LIABLE TO CUSTOMER OR ANY THIRD PARTY, IN WHOLE OR IN PART, FOR ANY CLAIMS OR DAMAGES ARISING FROM SUCH HIGH RISK USES.
NVIDIA makes no representation or warranty that the product described in this guide will be suitable for any specified use without further testing or modification. Testing of all parameters of each product is not necessarily performed by NVIDIA. It is customer’s sole responsibility to ensure the product is suitable and fit for the application planned by customer and to do the necessary testing for the application in order to avoid a default of the application or the product. Weaknesses in customer’s product designs may affect the quality and reliability of the NVIDIA product and may result in additional or different conditions and/or requirements beyond those contained in this guide. NVIDIA does not accept any liability related to any default, damage, costs or problem which may be based on or attributable to: (i) the use of the NVIDIA product in any manner that is contrary to this guide, or (ii) customer product designs.
Other than the right for customer to use the information in this guide with the product, no other license, either expressed or implied, is hereby granted by NVIDIA under this guide. Reproduction of information in this guide is permissible only if reproduction is approved by NVIDIA in writing, is reproduced without alteration, and is accompanied by all associated conditions, limitations, and notices.
Trademarks
NVIDIA, the NVIDIA logo, and cuBLAS, CUDA, CUDA-GDB, CUDA-MEMCHECK, cuDNN, cuFFT, cuSPARSE, DIGITS, DGX, DGX-1, DGX Station, NVIDIA DRIVE, NVIDIA DRIVE AGX, NVIDIA DRIVE Software, NVIDIA DRIVE OS, NVIDIA Developer Zone (aka "DevZone"), GRID, Jetson, NVIDIA Jetson Nano, NVIDIA Jetson AGX Xavier, NVIDIA Jetson TX2, NVIDIA Jetson TX2i, NVIDIA Jetson TX1, NVIDIA Jetson TK1, Kepler, NGX, NVIDIA GPU Cloud, Maxwell, Multimedia API, NCCL, NVIDIA Nsight Compute, NVIDIA Nsight Eclipse Edition, NVIDIA Nsight Graphics, NVIDIA Nsight Systems, NVLink, nvprof, Pascal, NVIDIA SDK Manager, Tegra, TensorRT, Tesla, Visual Profiler, VisionWorks and Volta are trademarks and/or registered trademarks of NVIDIA Corporation in the United States and other countries. Other company and product names may be trademarks of the respective companies with which they are associated.