

Alerting#
Alerting is a critical component of data center operations, providing real-time notifications when teams can respond instantly and prevent minor problems from escalating into costly outages. This Enterprise RA includes alerting across Kubernetes, GPU, CPU and networking metrics, ensuring operations teams are quickly informed of critical issues impacting reliability and performance. With Prometheus collecting metrics, firing alerts, and Alertmanager routing these events as emails, infrastructure teams can stay on top of potential problems and safeguard infrastructure health.
Configuring Grafana for Alerting#
Folder Creation#
Creating folders in Grafana is important for not only organizing alerts but giving alert groups a unique identifier. To create a folder in the Grafana using the UI, navigate to the Dashboards page from the main sidebar menu. Click on the New button on the top right and select New Folder from the dropdown menu. You should get a screen similar to the image below where you can enter a unique name for the folder – Grafana automatically generates a unique UID for every new folder. After creating it, you can find the folder’s UID in its settings or in the URL. The UID will be leveraged in our configuration file below and is important for automating alert provisioning.
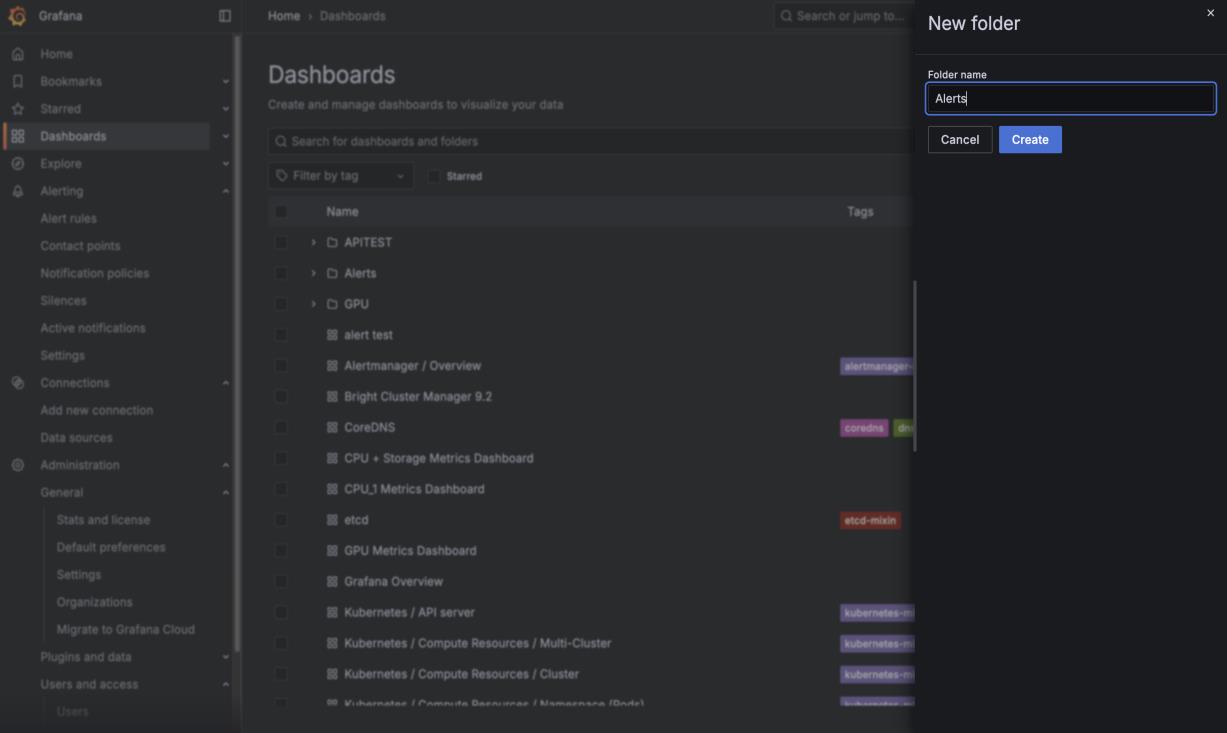
Figure 17 Grafana New Folder dialog showing folder name entry and automatic UID generation#
Contact Point Creation#
Contact Points in Grafana make your monitoring actionable, allowing your team to respond quickly to incidents and escalate problems before they impact users. To create a contact point using the Grafana UI select Contact Points under Alerting on the left-hand menu. Click on Create Contact Point to open the setup dialog. As shown in the image below, give the contact point a name and input the addresses that are supposed to receive notifications. For the purposes of this Enterprise RA, we will only be notifying through e-mail so under Integration select the Email option. Under Optional Email settings, you can also edit the message or subject line for a specific contact point.
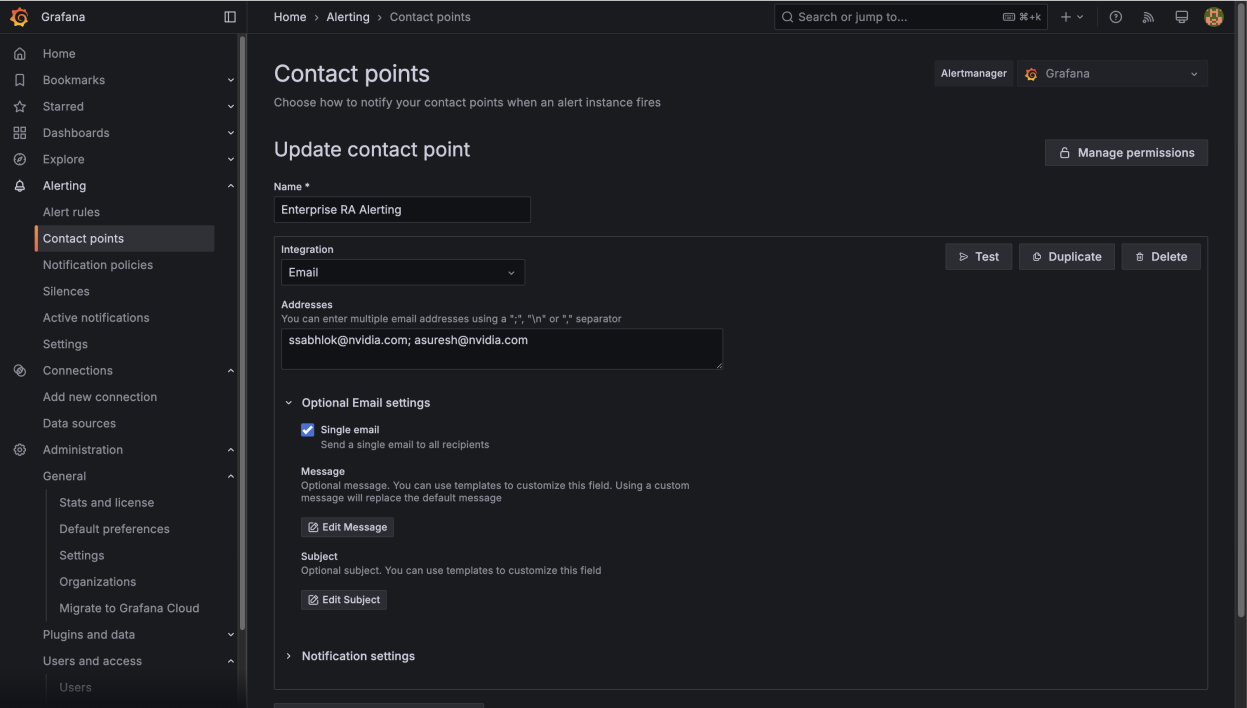
Figure 18 Grafana Contact Point creation dialog with email integration selected#
Setting up SMTP Server for configuration#
To configure SMTP for Grafana when running on Kubernetes, first locate the ConfigMap managing the Grafana.ini file in your monitoring or Prometheus namespace through the command below.
Example 18. Command to find the Grafana ConfigMap
root@eratme-433-bcm-01:~# kubectl get cm -n prometheus
…
kube-prometheus-stack-grafana              1      80d
Once located, add your SMTP server settings (such as the host name, from_address and password) so your Grafana application can send e-mails to the addresses you have specified under your contact points. If the [smtp] section has not been created, make sure to add it as the last entry of the grafana.ini section as shown in the example below.
Example 19. Command to modify the Grafana ConfigMap with vim
root@eratme-433-bcm-01:~# kubectl edit cm kube-prometheus-stack-grafana -n prometheus

apiVersion: v1
data:
  grafana.ini: |
    [analytics]
    check_for_updates = true
    [grafana_net]
    url = https://grafana.net
    [log]
    mode = console
    [paths]
    data = /var/lib/grafana/
    logs = /var/log/grafana
    plugins = /var/lib/grafana/plugins
    provisioning = /etc/grafana/provisioning
    [server]
    domain = ''
    root_url = %(protocol)s://%(domain)s:%(http_port)s/grafana/
    serve_from_sub_path = true
    [smtp]
    enabled = true
    host = smtp.client.com:XX
    skip_verify = true
    from_address = era-alerts@client.com
    password = "hifromthe3rateam"
    from_name = Grafana Alerts
kind: ConfigMap
…
After saving your changes, make sure you restart the Grafana deployment for changes to take effect. A screenshot example of an alert from Grafana is below
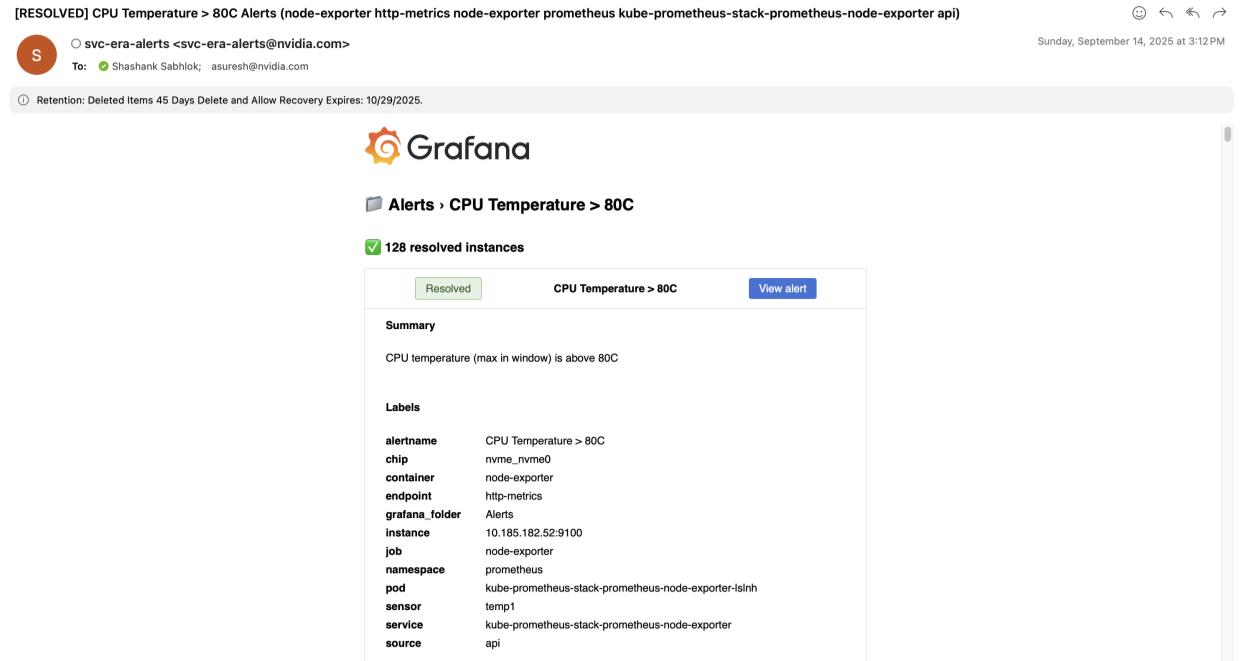
Figure 19 Example Grafana alert email notification#
Automated Alert Uploads#
As alert rule count grows, manually setting up alerts in the Grafana UI or using repetitive curl commands can be time-consuming and lead to configuration inconsistencies. To simplify the process, this Enterprise RA leverages a Python script that reads alert configurations from JSON files and bulk uploads them into Grafana (available on GitHub). This workflow streamlines alert provisioning, helps ensure consistency, and makes it easier to manage changes across large-scale environments. The following sections outline how to use the script, along with its main features and benefits for operational teams.
Note
We use a Python upload script from GitHub to post alerts directly to the target folder in Grafana, rather than copying JSON files into a provisioned path such as /etc/grafana/provisioning/alerting inside the Grafana Kubernetes pod with persistent volume. This latter method has resulted in inconsistent behavior, especially in Grafana OSS setups.
Script Overview#
This Enterprise RA script organizes its configuration using a centralized config.yaml file (as shown in the example below). All key details—including the Grafana server URL, API authentication token, default folder UID and alert rule JSON file paths need to be specified in this YAML file, allowing for easy updates and portability. Administrators can choose to list individual alert JSONs or enable a folder scan via the json_folder parameter, streamlining the selection process when large numbers of rules are involved.
Example 20. Parameters available in config.yaml
grafana_url: "https://YOUR IP ADDRESS:PORT"
api_token: "YOUR API TOKEN"
disable_provenance: true
default_folder_uid: "hifromthe3rateam"
json_files:
  - "gpu_alert_temp.json"
  - "gpu_alert_util.json"
  - "gpu_alert_pwr.json"
  - "cpu_temp.json"
  - "cpu_util.json"
  - "tensor_core_util.json"
  - "k8s_kubelet_down.json"
  - "k8s_apiserver_down.json"
  - "k8s_pending_pods.json"
  - "k8s_failed_pods.json"
  - "k8s_node_down.json"
  - "k8s_cpu_namespace.json"
  - "k8s_mem_namespace.json"
  - "storage_disk_util.json"
#json_folder: "./my_json_alerts"
Once the configuration has been modified, run the script using the Python command: python grafana_upload.py. Python must be installed on your system; most Linux environments include Python by default, and installation packages are available at python.org. Once configured, the script iterates through each alert rule JSON, uploading it to Grafana via API and providing immediate feedback on the outcome of each upload. The script checks for duplicate alert UIDs to prevent redundant entries and prints clear status messages indicating the success or failure of each operation. This structured approach ensures reliable bulk uploads, enables efficient alert management and reduces the risk of inconsistencies in production environments.
Example 21. Excerpt from running the grad_upload.py script to bulk upload alert JSONs
root@eratme-433-bcm-01:~# python graf_upload.py
Checking existing Grafana alert rules ...
/usr/local/lib/python3.10/dist-packages/urllib3/connectionpool.py:1097:
InsecureRequestWarning: Unverified HTTPS request is being made to host
'10.185.182.61'. Adding certificate verification is strongly advised. See:
https://urllib3.readthedocs.io/en/latest/advanced-usage.html#tls-warnings
  warnings.warn(
Uploading 13 alert JSON files to
https://10.185.182.61:30443/grafana/api/v1/provisioning/alert-rules ...
SKIPPED 'cpu_util.json': Alert rule 'CPU Utilization > 80%' already exists in folder
'dey37zy9mhurkb'.
SKIPPED 'k8s_apiserver_down.json': Alert rule 'Kubernetes - API Server Down' already
exists in folder 'dey37zy9mhurkb'.
  warnings.warn(
Uploading: k8s_kubelet_down.json ... SUCCESS (rule id: 41, uid: feysyft9r89a8c)
  warnings.warn(
Uploading: tensor_core_util.json ... FAILED: invalid alert rule: no queries or
expressions are found
Once all the alerts have been bulk uploaded, you can expect your new created Alerts folder to look similar to the figure below:
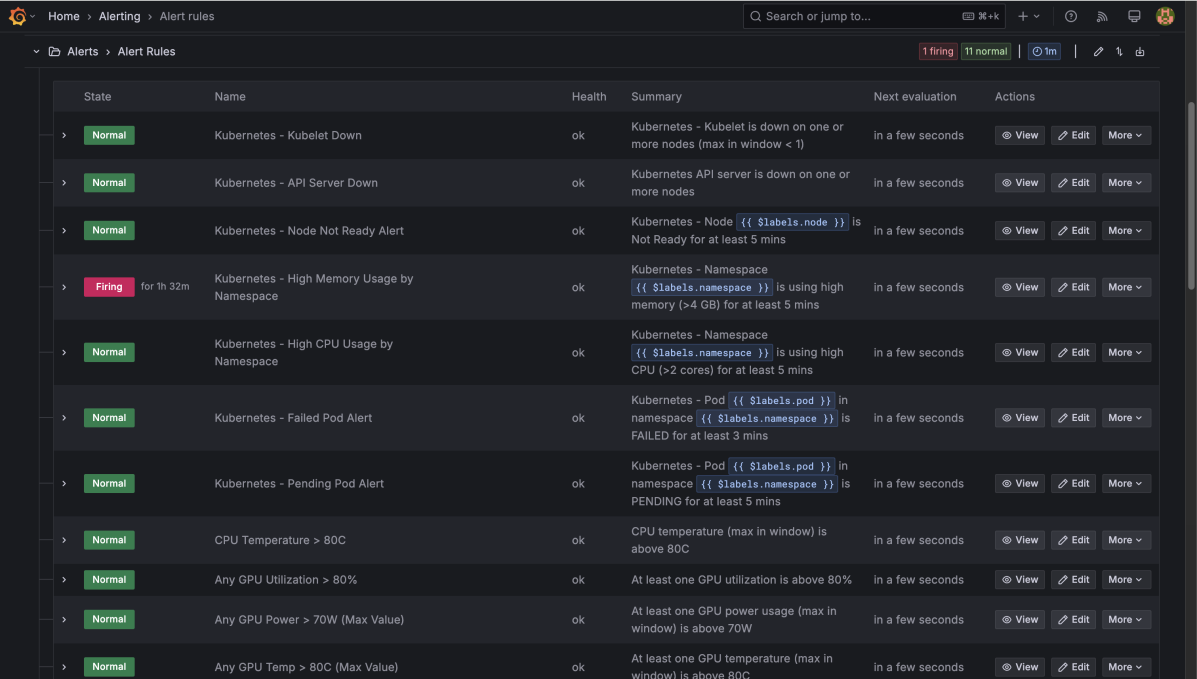
Figure 20 Grafana Alerts folder showing bulk uploaded alert rules#
For each alert, specify the contact point to ensure notifications reach the right stakeholders in your stack, whether for hardware or Kubernetes components. This allows team members to receive relevant alerts based on their role. In the example below, the k8s_kubelet_down alert is configured through the Grafana UI to fire alerts at the Enterprise RA Alerting contact point.
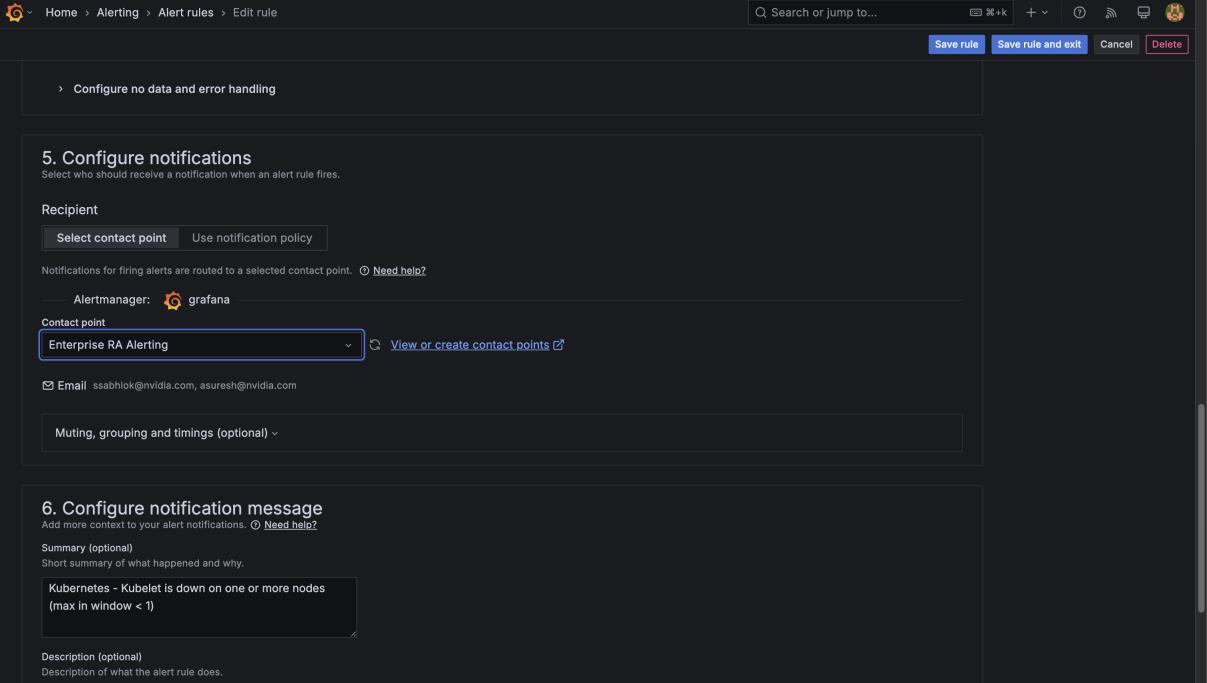
Figure 21 Grafana alert rule configuration showing contact point assignment for k8s_kubelet_down#
Alert Rule JSONs#
The script supports a wide range of alert scenarios, with each alert defined in a separate JSON file. Common alert types include monitoring metrics such as CPU usage, GPU utilization, memory availability, disk space, and network latency. Each JSON file contains all necessary parameters for Grafana to assess the corresponding metric and trigger alerts based on the health and status of your infrastructure. To update or customize an alert rule, open the corresponding JSON file in a text editor and modify key parameters as required. Adjust the threshold fields to set when the alert should trigger—for example, setting “threshold”: 80 causes the alert to fire if average CPU utilization exceeds 80%. Edit the “expr” field to define the metric or logic being evaluated, tailoring it to your data source or monitoring strategy. The “for” field at the bottom of the JSON specifies how long the condition must be true before the alert fires (e.g., “for”: “1m” means one minute). Additionally, each alert JSON should include a “folderUID” at the top to align with the structure of POST requests into Grafana OSS, although the alert ultimately appears in the folder indicated in config.yaml as described earlier.
Example 22. A JSON example for the GPU Temperature Alert
{
  "orgID": 1,
  "folderUID": "hifromthe3rateam",
  "ruleGroup": "Alert Rules",
  "title": "Any GPU Temp > 80C (Max Value)",
  "condition": "C",
  "data": [
    {
      "refId": "A",
      "queryType": "",
      "relativeTimeRange": {
        "from": 600,
        "to": 0
      },
      "datasourceUid": "prometheus",
      "model": {
        "expr": "DCGM_FI_DEV_GPU_TEMP",
        "interval": "",
        "intervalMs": 1000,
        "legendFormat": "",
        "editorMode": "code",
        "maxDataPoints": 43200,
        "refId": "A",
        "instant": true,
        "datasource": {
          "type": "prometheus",
          "uid": "prometheus"
        }
      }
    },
    {
      "refId": "C",
      "queryType": "",
      "relativeTimeRange": {
        "from": 0,
        "to": 0
      },
      "datasourceUid": "__expr__",
      "model": {
        "type": "threshold",
        "expression": "A",
        "refId": "C",
        "conditions": [
          {
            "evaluator": {
              "type": "gt",
              "params": [80]
            },
            "operator": {
              "type": "and"
            },
            "query": {
              "params": ["A"]
            },
            "reducer": {
              "type": "max",
              "params": []
            },
            "type": "query"
          }
        ],
        "datasource": {
          "type": "__expr__",
          "uid": "__expr__"
        },
        "intervalMs": 1000,
        "maxDataPoints": 43200
      }
    }
  ],
  "noDataState": "NoData",
  "execErrState": "Error",
  "for": "1m",
  "labels": {
    "source": "api"
  },
  "annotations": {
    "summary": "At least one GPU temperature (max in window) is above 80C"
  },
  "isPaused": false
}
Table 5. JSON alerts available on the Enterprise RA GitHub
Stack Layer |
File Name |
Description (Alert if…) |
|---|---|---|
Kubernetes |
k8s_pending_pods.json |
A pod is in pending state for at least 5 minutes |
Kubernetes |
k8s_failed_pods.json |
Pods has failed for at least 3 minutes |
Kubernetes |
k8s_node_down.json |
A Kubernetes node has been down for at least 5 minutes |
Kubernetes |
kube_apiserver_down.json |
The Kubernetes API Server is down for at least 1 minute |
Kubernetes |
k8s_kubelet_down.json |
The kubelet has been down for at least 5 minutes |
Kubernetes |
k8s_cpu_namespace.json |
A namespace in Kubernetes is occupying more than 2 CPU cores for at least 5 minutes |
Kubernetes |
k8s_mem_namespace.json |
A namespace in Kubernetes is occupying more than 4 GB memory for at least 5 minutes |
GPU |
gpu_alert_util.json |
A GPU is utilized more than 80% for at least a minute |
GPU |
gpu_alert_pwr.json |
The power consumption of any GPU exceeds 70W for at least a minute |
GPU |
gpu_alert_temp.json |
Any GPU temperature exceeds 80 Celsius for at least a minute |
CPU |
cpu_util.json |
On average, any CPU is utilized for more than 80% for at least a minute |
CPU |
cpu_temp.json |
Any CPU temperature exceeds 80 Celsius for at least a minute |
Disk Storage |
storage_disk_util.json |
Total bytes on a filesystem that are currently free/unallocated goes below 10 bytes |
Disk Write Time |
disk_write_time.json |
Any disk has a read time greater than 10 seconds |
Disk Read Time |
disk_read_time.json |
Any disk has a read time greater than 5 seconds |
Port Down Status |
network_port_down.json |
Any switch interface is down for more than 1 minute |
Unreachable Switch |
network_unreachable_switch.json |
Any switch is unreachable for more than 1 minute |
BGP Peer State Change |
network_bgp_peer_state_change.json |
Any BGP peer that was recently Established moves to a non-Established state (Idle/Active) for more than 1 minute |
For networking‑related alerts such as Port Down Status, specify the UID of the NetQ VictoriaMetrics TSDB in the alert JSON (datasourceUid field), because it is different from the standard Prometheus data source UID used by other alerts.
Note
Alert thresholds and time intervals in the table are example values; adjust them for your cluster setup and always reference the appropriate product datasheet or specifications when configuring. For example, for RTX Pro 6000 Servers BSE GPUs reference the product specification (NVOnline: 1117304) to get the Thermal Qualification Temperatures for the GPU Temperature Alert.