

Technical Prerequisites for Observability#
NVIDIA Enterprise RAs – Prerequisites#
This Observability Guide for Enterprise RAs is designed to layer seamlessly on top of NVIDIA’s enterprise AI infrastructure, providing visibility into AI workloads running across compute, network and software layers. To get started, it is recommended that customers follow Enterprise RA hardware infrastructure guidance for NVIDIA accelerated computing with NVIDIA Spectrum-X networking to power the next generation of data centers architecture for AI and HPC workloads.
This guide builds upon the foundation provided by the guidance in the Software Reference Stack and Automation guide for NVIDIA Enterprise RAs (as indicated in the diagram above) which offers a modular and optional software stack for deploying and managing AI workloads at scale. Core components of this Software Reference Stack – such as GPU Operator, Network Operator and Prometheus ensure that the infrastructure and workloads are ready for deep observability. Moving forward in this document, it is assumed that the software stack prescribed has been deployed and tested across nodes.
Note
For detailed overview of these software components please refer to the Software Reference Stack and Automation for NVIDIA Enterprise RAs | NVOnline: 1130533
Verifying Kube Prometheus and Grafana Setup#
For the purposes of visualizations and alerting, we will be leveraging Prometheus as a time series database and Grafana for dashboarding and data visualization. The setup wizard for NVIDIA Base Command Manager (BCM) facilitates the installation of the Kube Prometheus stack including Prometheus operator, Node Exporter, Kube State Metrics and Grafana. Please refer to Appendix A for details on which port to keep open for these tools. You can verify the setup with the following Kubernetes commands:
Example 1. Commands for verifying deployments
root@pdxera-bcm01:~# kubectl get ns
NAME                   STATUS   AGE
cm                     Active   150d
cm-permissions         Active   134d
cmkpm-system           Active   134d
default                Active   150d
gpu-operator           Active   150d
ingress-nginx          Active   150d
kube-node-lease        Active   150d
kube-public            Active   150d
kube-system            Active   150d
kubernetes-dashboard   Active   150d
metallb-system         Active   150d
network-operator       Active   150d
nfs-provisioner        Active   121d
nim-operator           Active   126d
prometheus             Active   150d
web                    Active   89d

root@pdxera-bcm01:~$ kubectl get deployments -n prometheus
NAME                                       READY   UP-TO-DATE   AVAILABLE   AGE
kube-prometheus-stack-grafana              1/1     1            1           141d
kube-prometheus-stack-kube-state-metrics   1/1     1            1           141d
kube-prometheus-stack-operator             1/1     1            1           141d
prometheus-adapter                         1/1     1            1           141d
root@pdxera-bcm01:~$ kubectl get serviceMonitor -n prometheus
NAME                                             AGE
kube-prometheus-stack-alertmanager               141d
kube-prometheus-stack-apiserver                  141d
kube-prometheus-stack-coredns                    141d
kube-prometheus-stack-grafana                    141d
kube-prometheus-stack-kube-controller-manager    141d
kube-prometheus-stack-kube-etcd                  141d
kube-prometheus-stack-kube-proxy                 141d
kube-prometheus-stack-kube-scheduler             141d
kube-prometheus-stack-kube-state-metrics         141d
kube-prometheus-stack-kubelet                    141d
kube-prometheus-stack-operator                   141d
kube-prometheus-stack-prometheus                 141d
kube-prometheus-stack-prometheus-node-exporter   141d
Note
For guidance on external access setup of Kube Prometheus and Grafana please refer to NVIDIA’s Software Reference Stack and Automation for Enterprise RAs | NV Online: 1130533
Configuring Persistent Storage for Grafana#
By default, Grafana stores its dashboards, data sources, user settings, plugins in the /var/lib/grafana directory inside the pod. If this directory is not backed with persistent storage, all configurations and user data will be lost whenever the pod is rescheduled, the node reboots, or the deployment is updated. For production environments, it’s important to ensure data persistence, as metrics and dashboards are typically captured over weeks and months. To ensure data durability during pod restarts and deployment rollouts, it is recommended that a Persistent Volume Claim (PVC) is attached to the Grafana instance. The PVC can leverage your existing enterprise storage infrastructure (in our case a NFS system) to provide persistent storage.
Steps to configure a PVC for Grafana#
To start, ensure a Storage Class is configured with suitable persistent backend storage. In the example below our Storage Class is called nfs-client and a separate monitoring namespace has been created for Grafana and Kube Prometheus. Once declared, create a PVC with sufficient storage to retain the Grafana data over time.
Example 2. Manifest to create PVC for Grafana
apiVersion: v1
kind: PersistentVolumeClaim
metadata:
  name: grafana-data
  namespace: monitoring
spec:
  accessModes:
    - ReadWriteOnce
  resources:
    requests:
      storage: 5Gi
  storageClassName: nfs-client
This PVC can be applied to your cluster by saving it to a file (e.g. pvc.yaml) and running the Kubernetes apply command. Once created, verify that it is correctly bound to the Persistent Volume (PV):
Example 3. Commands to apply and verify the PVC
root@pdxera-bcm01:~$ kubectl apply -f pvc.yaml
root@pdxera-bcm01:~$ kubectl get pvc -n monitoring
NAME           STATUS   VOLUME         CAPACITY   ACCESS MODES   STORAGECLASS   VOLUMEATTRIBUTESCLASS   AGE
elasticsearch  Bound    pvc-3042c813   5Gi        RWO            local-path     <unset>                 70d
grafana-data   Bound    pvc-1b30e4e1   5Gi        RWX            nfs-client     <unset>                 39d
You should see the PVC status as Bound.
The next step is to modify the existing Grafana Deployment to use the PVC. Specifically, add a volumeMounts entry in the Grafana container specification to mount the PVC to /var/lib/Grafana, and add a corresponding volumes entry to the pod specification pointing to the PVC. Below is an example from our Grafana deployment:
Example 4. Extract from a Grafana deployment manifest with changes to incorporate a PV
…

volumeMounts:
      - mountPath: /tmp/dashboards/dcgm.json
          name: nv-dashboard-volume
          subPath: dcgm.json
      - mountPath: /etc/grafana/grafana.ini
          name: config
          subPath: grafana.ini
      - mountPath: /var/lib/grafana
          name: grafana-storage


…

   volumes:
      - configMap:
          defaultMode: 420
          name: nvidia-dcgm
        name: nv-dashboard-volume
      - configMap:
          defaultMode: 420
          name: kube-prometheus-stack-grafana
        name: config
      - name: grafana-storage
        persistentVolumeClaim:
          claimName: grafana-data
      - emptyDir: {}
        name: sc-dashboard-volume
      - configMap:
          defaultMode: 420
          name: kube-prometheus-stack-grafana-config-dashboards
        name: sc-dashboard-provider
      - emptyDir: {}
        name: sc-datasources-volume
Finally, you can verify if the PVC is correctly mounted by exec’ing into the Grafana pod:
Example 5. Commands to execute commands inside the Grafana Pod
root@pdxera-bcm01:~$ kubectl exec -it grafana-pod -n monitoring -- sh

/usr/share/grafana $ df -h | grep /var/lib/grafana
                 5.7T      1.7T      3.7T  32% /var/lib/grafana
Network Monitoring with NVIDIA NetQ#
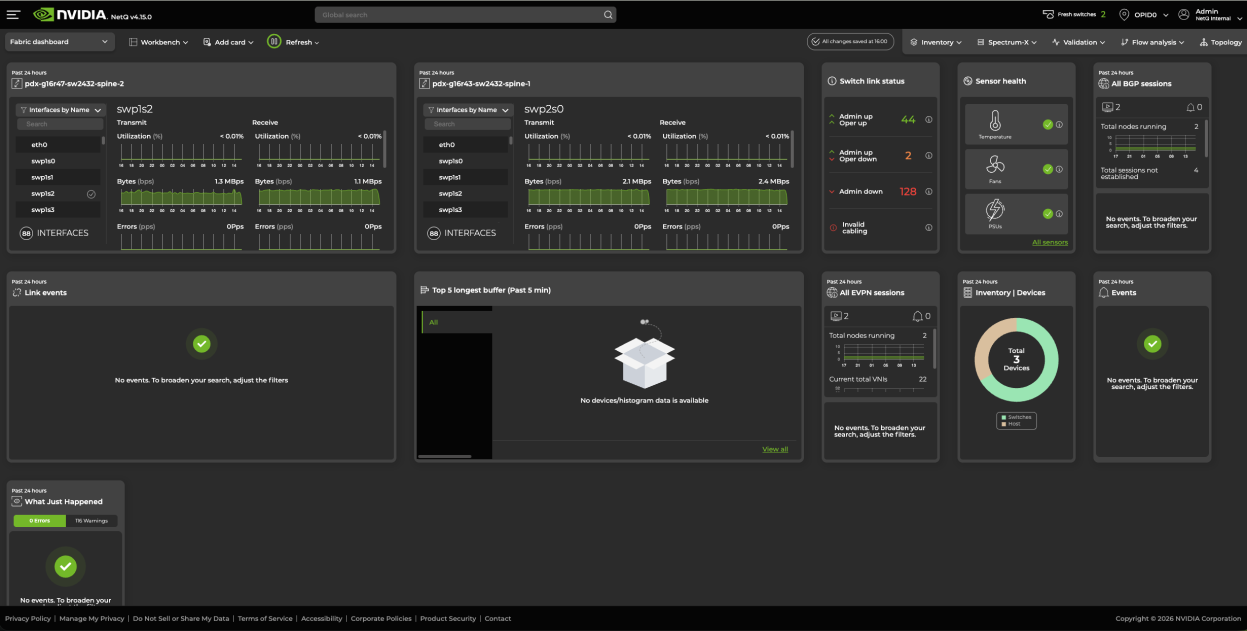
Figure 2 NVIDIA NetQ network monitoring dashboard#
NVIDIA NetQ is NVIDIA’s network operations and telemetry platform for Cumulus Linux–based switches and NVIDIA network adapters. It collects detailed statistics about links, routing, NVSwitch, and platform health, and makes them available to external tools such as Prometheus and Grafana. To install NetQ on your control node, and configure NetQ CLI/Agents on your switches follow the instructions here. This guide assumes that a NetQ server is installed and reachable by the switches, which in turn have NetQ CLI and NetQ agents running on them.
Note
For more information on configuring Spectrum switches and setting up VRFs please refer to the Networking Configuration & Logical Architectural Guide for NVIDIA Enterprise RAs | NVOnline: 1133364 is for the 2-4-3-200 node architecture
The following commands configure the NetQ agent on the switch to send telemetry, statistics, What Just Happened (WJH) events and ASIC monitoring data to the NetQ server using the management VRF so the data can be displayed on the NetQ UI as shown above. Note, the agent needs to be restarted so all these settings take effect.
Example 6. NetQ agent configuration to export switch telemetry to the NetQ UI
# Configure NetQ agent to use server 10.XXX.XXX.XXX over the mgmt VRF
netq config add agent server 10.XXX.XXX.XXX vrf mgmt

# Enable NetQ agent statistics collection and export
netq config add agent stats

# Configure a CPU usage limit for the NetQ agent (value typically follows)
netq config add agent cpu-limit

# Enable What Just Happened (WJH) event collection in the NetQ agent
netq config add agent wjh

# Enable ASIC monitoring in the NetQ agent
netq config add agent asic-monitor

# Restart the NetQ agent to apply configuration changes
netq config restart agent
Each switch in your setup must export OpenTelemetry (OTel) metrics to the NetQ server. This is configured through the following NVUE commands on Cumulus Linux. For this guide, the Spectrum switches are running Cumulus Linux 5.12
Example 7. Commands to enable and verify telemetry on the networking switch
# Turn global telemetry on
nv set system telemetry enable on

# Write histogram stats snapshots to a memory backed file
nv set system telemetry snapshot-file name /var/run/cumulus/histogram_stats

# Keep upto 120 histogram snapshot files
nv set system telemetry snapshot-file count 120

# Take a histogram snapshot every 10 seconds
nv set system telemetry snapshot-interval 10

# Enable OTLP export so telemetry is actually sent
nv set system telemetry export otlp state enabled

# Send telemetry using the mgmt VRF
nv set system telemetry export vrf mgmt

# Set OTLP gRPC collector destination to 10.XXX.XXX.XXX on port 30008
nv set system telemetry export otlp grpc destination 10.XXX.XXX.XXX port 30008

# Use insecure (non-TLS) gRPC for OTLP export
nv set system telemetry export otlp grpc insecure enabled

# Enable exporting of buffer usage statistics via telemetry
nv set system telemetry buffer-stats export state enabled

# Enable exporting of control-plane statistics via telemetry
nv set system telemetry control-plane-stats export state enabled

# Enable export of histogram-style telemetry statistics
nv set system telemetry histogram export state enabled

# Collect/export egress buffer stats for traffic class 0,3,6,12 to gauge priority
nv set system telemetry interface-stats egress-buffer traffic-class 0
nv set system telemetry interface-stats egress-buffer traffic-class 3
nv set system telemetry interface-stats egress-buffer traffic-class 6
nv set system telemetry interface-stats egress-buffer traffic-class 12

# Enable exporting of per-interface telemetry statistics
nv set system telemetry interface-stats export state enabled

# Enable low-level physical interface telemetry class
nv set system telemetry interface-stats class phy state enabled

# Collect/export ingress buffer stats for priority groups 0,1, 4 on interfaces
nv set system telemetry interface-stats ingress-buffer priority-group 0
nv set system telemetry interface-stats ingress-buffer priority-group 1
nv set system telemetry interface-stats ingress-buffer priority-group 4

# Set telemetry interface stats sample interval to 30 seconds
nv set system telemetry interface-stats sample-interval 30

# Enable exporting of platform statistics (CPU, memory, sensors, etc.)
nv set system telemetry platform-stats export state enabled

# Enable exporting of BGP routing telemetry statistics
nv set system telemetry router bgp export state enabled

# Enable exporting of general routing telemetry statistics
nv set system telemetry router export state enabled

# Enable exporting of Routing Information Base (RIB) telemetry statistics
nv set system telemetry router rib export state enabled

# Enable detailed environment sensor platform telemetry (temps, fans, PSUs)
nv set system telemetry platform-stats class environment-sensor state enabled

# Define snapshot group to capture all per-port packet statistics
nv set system telemetry snapshot port-group packet-all-pg interface all

# Include all packet counters in the snapshot group
nv set system telemetry snapshot port-group packet-all-pg stats-type packet-all

# Capture packet snapshots every 20 seconds
nv set system telemetry snapshot port-group packet-all-pg timer-interval 20

# Write packet snapshot data to /var/lib/cumulus/all_packet_stats
nv set system telemetry snapshot port-group packet-all-pg snapshot-file name /var/lib/cumulus/all_packet_stats

# Keep up to 120 packet snapshot files
nv set system telemetry snapshot port-group packet-all-pg snapshot-file count 120

# Apply the configuration
nv config apply -y

# Show system configuration
nv show system telemetry

# Show OTLP gRPC export destination for system telemetry
nv show system telemetry export otlp grpc destination

# Show system telemetry health status
nv show system telemetry health
Replace 10.XXX.XXX.XXX with the IP of your NetQ server. Port 30008 is the default OTLP port used by NetQ for metrics ingestion so please ensure that it is updated.
As shown in the example below, a healthy output should show nv-telemetry-service, routing-telemetry-service, and platform-stats-service in active state along with an “Export Destination Status” table with the NetQ server IP and port, Connectivity: OK, and non‑zero export counters.
Example 8. Health output that verifies system telemetry is sent to the NetQ Server IP.
nv show system telemetry health
operational
----------------------------------  -----------------
service-status
  nv-telemetry-service              active
  platform-stats-service            active
  histogram-export-service          active
  sdk-stats-service                 active
  routing-telemetry-service         active
internal-metrics
  process
    cpu-seconds                     24449
    memory-rss-kilobytes            111648768
    runtime-heap-alloc-bytes        35428336
    runtime-total-alloc-bytes       4548898418280
    runtime-total-sys-memory-bytes  57826320
    uptime-seconds                  531056
  [receivers]                       otlp/global
  [receivers]                       prometheus/global
  processors
    [memory-limiter]                memory_limiter/1
    [batch]                         batch/1
  [exporters]                       otlp/global/1

Export Destination Status
============================
    Destination           Connectivity  Export Counter  Drop Counter
    --------------------  ------------  --------------  ------------
    10.XXX.XXX.XXX:30008  Pass          3099406634      0
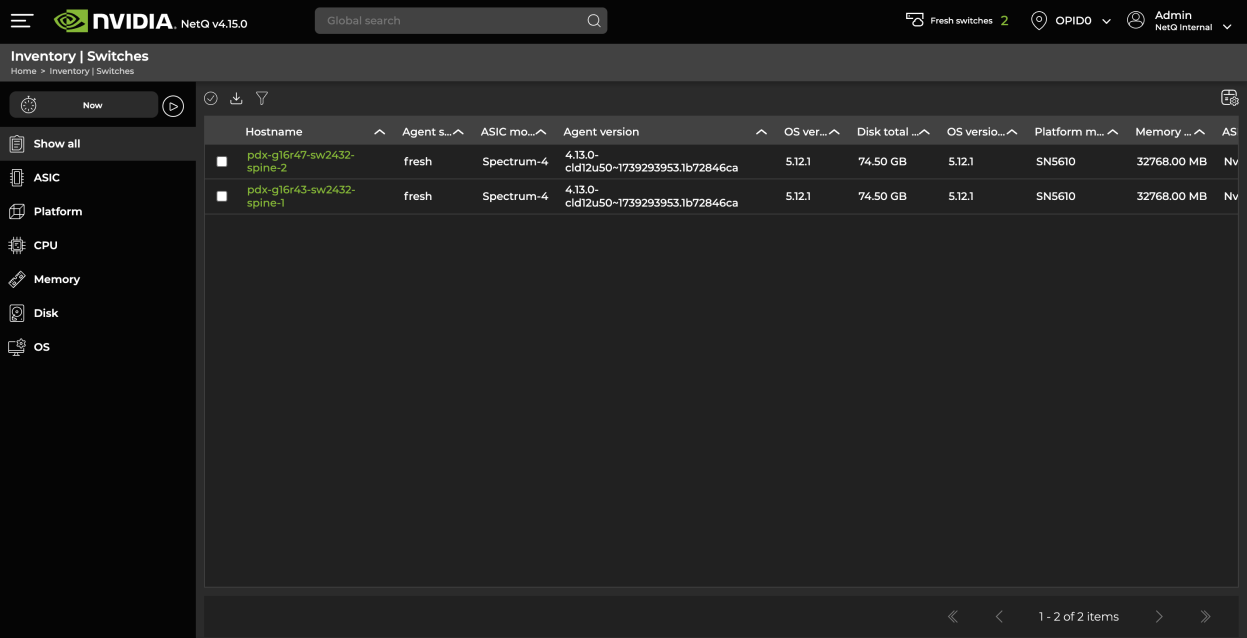
Figure 3 NetQ Inventory Switches view confirming switches appear with status fresh#
NetQ can accept OTLP traffic in secure (TLS) or insecure mode. In many NetQ deployments it is simple from a setup standpoint to start with an insecure deployment and enable TLS later. On the NetQ server, use the netq CLI to alter the OLTP security mode: sudo netq set otlp security-mode insecure
Once OTLP export and security are aligned, confirm that the NetQ agent and telemetry pipeline are healthy. On the switches run netq config status agent verbose. A healthy output shows NetQ subagents (netlink process, gRPC stream, ASIC monitor) marked as alive. Furthermore, on the NetQ UI navigate to Inventory -> Switches and verify that all the spines appear with status fresh – this confirms NetQ is receiving basic telemetry from the devices even before Grafana is connected.