

Configuration of Data Sources#
Base Command Manager – Prometheus#
NVIDIA Base Command Manager (BCM) offers out-of-the-box telemetry for monitoring and managing compute clusters. It leverages a native Prometheus instance that integrates smoothly with Grafana, enabling centralized visualization of relevant metrics alongside broader infrastructure monitoring. This instance of Prometheus is installed in the BCM head node.
To establish connectivity, Grafana requires authentication to access metrics from BCM. The recommended approach is certificate-based authentication, which ensures secure and controlled access to the cluster management API. The first step involves defining a management profile as a root user in BCM so that you have access to the right cluster management API calls that are necessary for Grafana to retrieve monitoring data, maintaining security best practices.
Example 9. Commands to define a management profile as a root user in BCM
root@pdxera-bcm01:~# cmsh
[pdxera-bcm01]% profile
[pdxera-bcm01->profile]% add grafana
[pdxera-bcm01->profile*[grafana*]]% set services cmmon
[pdxera-bcm01->profile*[grafana*]]% set tokens private_monitoring_token plot_token
get_labeled_entity_token
[pdxera-bcm01->profile*[grafana*]]% commit
[pdxera-bcm01->profile[grafana]]% quit
Once the profile is defined, run the show command to confirm it’s been created as desired.
Example 10. Command to confirm if a profile has been created
[pdxera-bcm01->profile] % use grafana
[pdxera-bcm01->profile[grafana]] % show
Parameter          Value
------------------ ------------------------------
Name               grafana
Revision
Nonuser            no
Services           CMMon
Tokens    PRIVATE_MONITORING_TOKEN,PLOT_TOKEN,GET_LABELED_ENTITY_TOKEN
Subsequently, we will issue a certificate with this profile, which will be leveraged by Grafana to authenticate into the BCM API.
Example 11. Commands to create certificates in BCM as a root user
root@ pdxera-bcm01:~# cmsh
[pdxera-bcm01]% cert
[pdxera-bcm01->cert]% createcertificate
Name:             createcertificate - Create a new certificate
Usage:            createcertificate  <key-length> <common-name> <organization>
<organizational-unit> <locality> <state> <country> <profile> <sys-login> <days>
<key-file> <cert-file>
Arguments:
          key-file   Path to key file that will be generated
          cert-file  Path to pem file that will be generated

[pdxera-bcm01->cert]% createcertificate 2048 "Grafana" "Bright Computing"
"Engineering" "Amsterdam" "NH" "NL" grafana nobody 3650 /root/grafana.key
/root/grafana.pem

Tue Apr 12 21:58:52 2025 [notice] mdv-test: New certificate request with ID: 2
Certificate key written to file: /root/grafana.key Certificate pem written to file:
/root/grafana.pem
We now have a key in /root/grafana.key and a certificate in /root/grafana.pem which will be needed in the next step as we configure Grafana. We will also need the CA certificate, which can be found in /cm/local/apps/cmd/etc/cacert.pem. Note that you will find two certificates in the cacert.pem. You will need to paste both certificates as the CA cert value in setting up BCM as a data source for Grafana.
Example 12. Example of the cacert.pem file
-----BEGIN CERTIFICATE-----
<alphanumeric certificate characters> <----- Certificate
-----END CERTIFICATE-----
-----BEGIN CERTIFICATE-----
<alphanumeric certificate characters> <----- Root Certificate
-----END CERTIFICATE-----
With authentication in place, navigate to Grafana and select Data Sources under Connections and add a new source of type Prometheus. Assign a meaningful name such as bcm-prom to easily identify the BCM data stream. Provide the Prometheus server URL, ensuring that HTTPS is used for the connection to maintain encrypted communication.
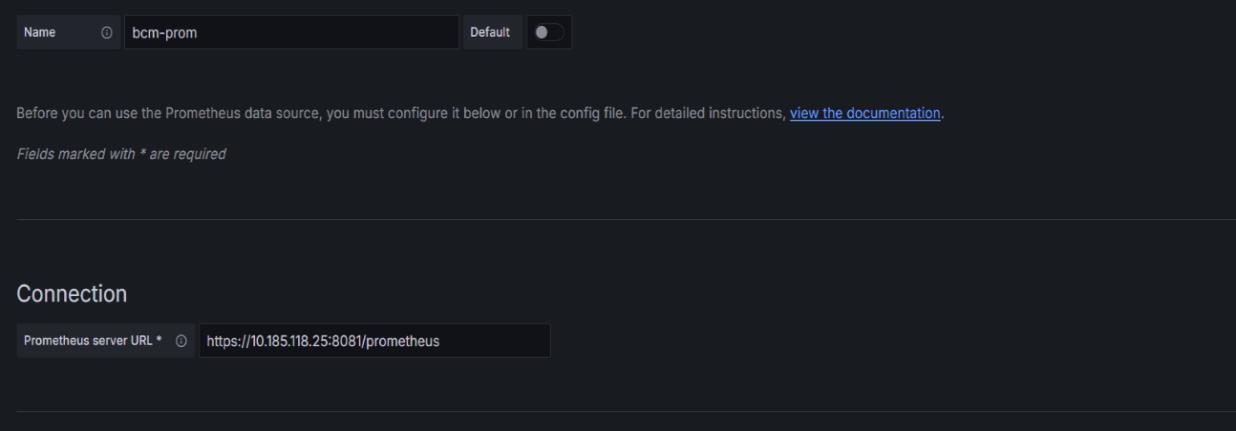
Figure 4 Grafana data source configuration showing the BCM Prometheus server URL#
Under the authentication settings, paste the chain of CA certificates, client certificates and private key into the respective fields to complete the setup.
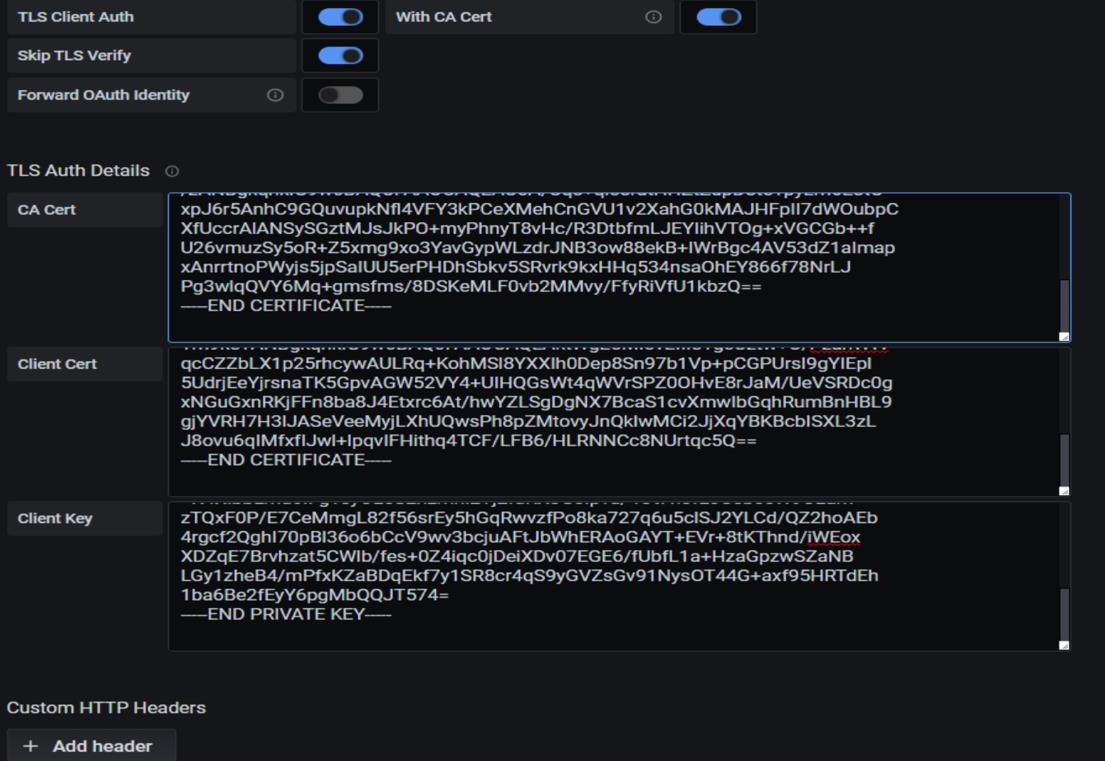
Figure 5 Grafana TLS/SSL settings showing CA certificate, client certificate and private key fields#
It is important to adjust the HTTP method to GET - failure to make this change may result in connectivity errors with Grafana. Once done, clicking on the Save & Test button should result in a “Data Source is working” message, confirming that Grafana can now pull telemetry from BCM.
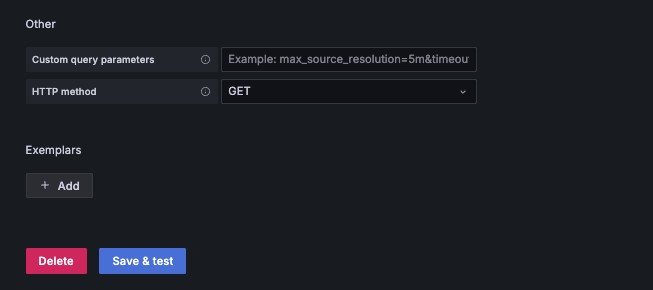
Figure 6 Grafana HTTP settings showing GET method selected and Save & Test button#
To validate the metric stream, create a new Grafana visualization using the bcm-prom data source. Navigate to the Dashboards page using the menu pane on the left of the screen. Select New and then choose New dashboard followed by Add visualization. You will be promoted to select a data source where bcm-prom should be an option. After selecting it, you can enter a PromQL query under Query A to validate the data. The example query below shows a Grafana visualization tracking total core CPU usage in user mode.
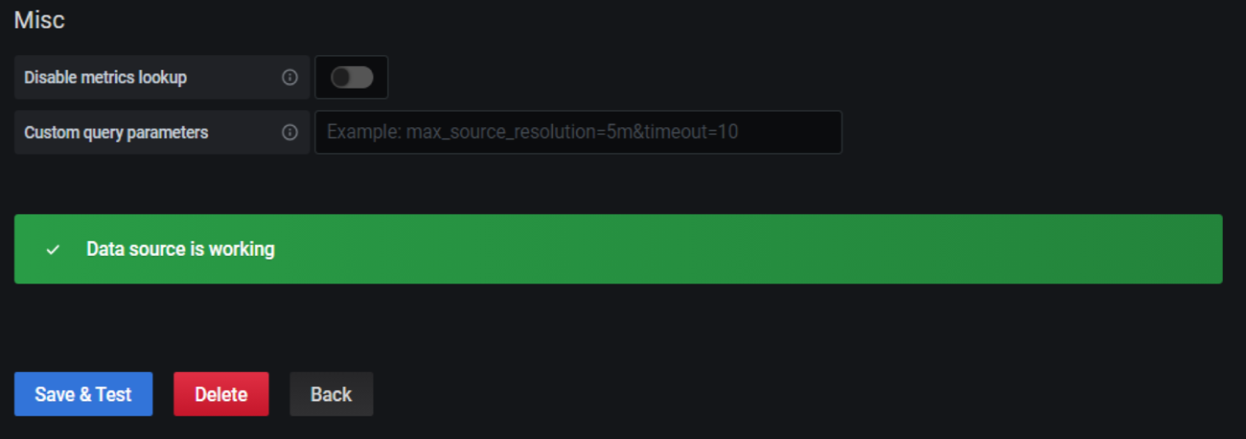
Figure 7 Grafana visualization with a PromQL query validating total core CPU usage in user mode from BCM#
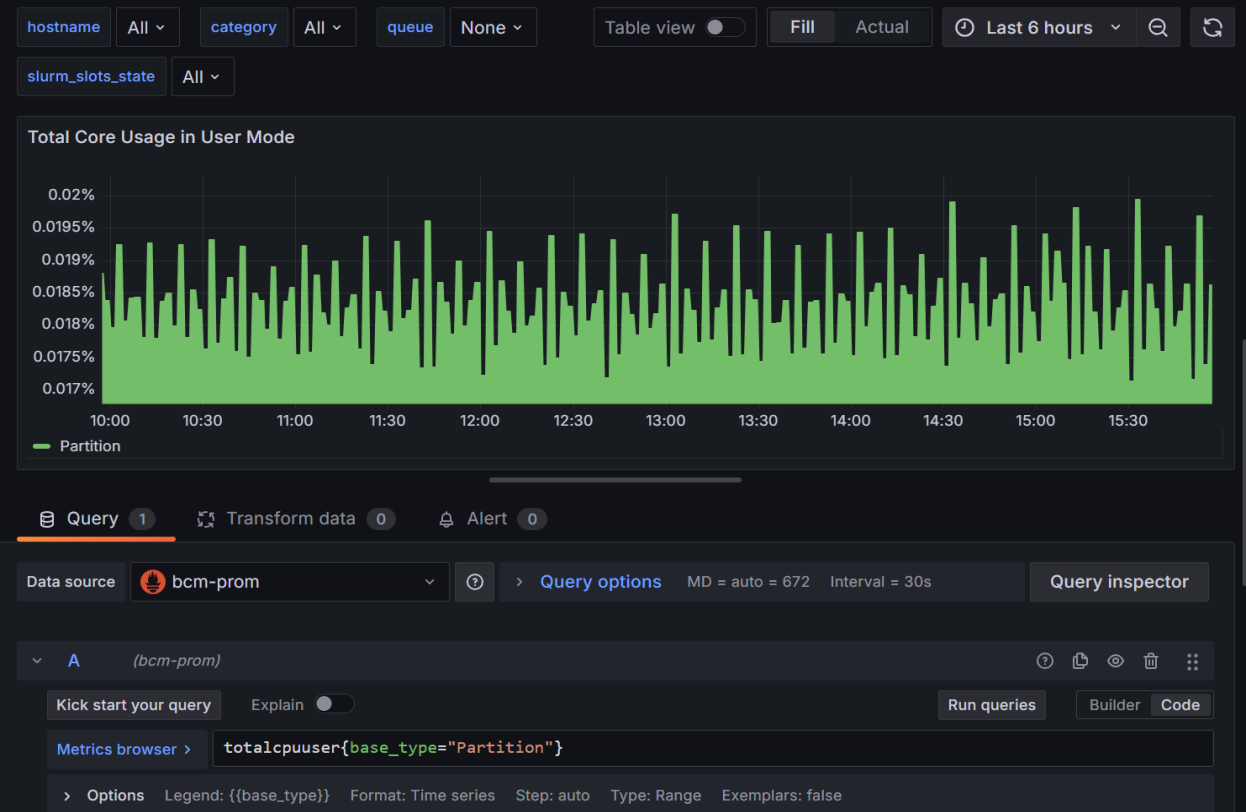
Figure 8 Grafana CPU utilization visualization powered by BCM Prometheus data source#
DCGM Exporter#
The NVIDIA GPU Operator simplifies the deployment and monitoring of GPUs in Kubernetes environments by deploying DCGM Exporter alongside NVIDIA Drivers and Kubernetes device plugins. The DCGM Exporter collects real-time GPU telemetry data such as memory usage, temperature and power consumption, and is exposed through a Service Monitor. When Prometheus Operator is deployed alongside the GPU Operator, the exporter is automatically discovered allowing for GPU metric scraping without any manual configuration.
Note
For instructions on how to deploy the GPU Operator or the Prometheus Operator, please refer to the NVIDIA’s Software Reference Stack and Automation for Enterprise RAs | NV Online: 1130533
As part of the GPU Operator deployment, DCGM Exporter is also provisioned. Confirm this by verifying that all pods resembling dcgm-exporter-xxx are running.
Example 13. Command to verify pods in the GPU Operator namespace
kubectl get pods -n gpu-operator
Since metrics should be scraped automatically, verify that you can see DCGM exporter metrics in your instance of Kube Prometheus, by navigating to the Prometheus UI and trying a sample query such as DCGM_FI_DEV_GPU_TEMP:
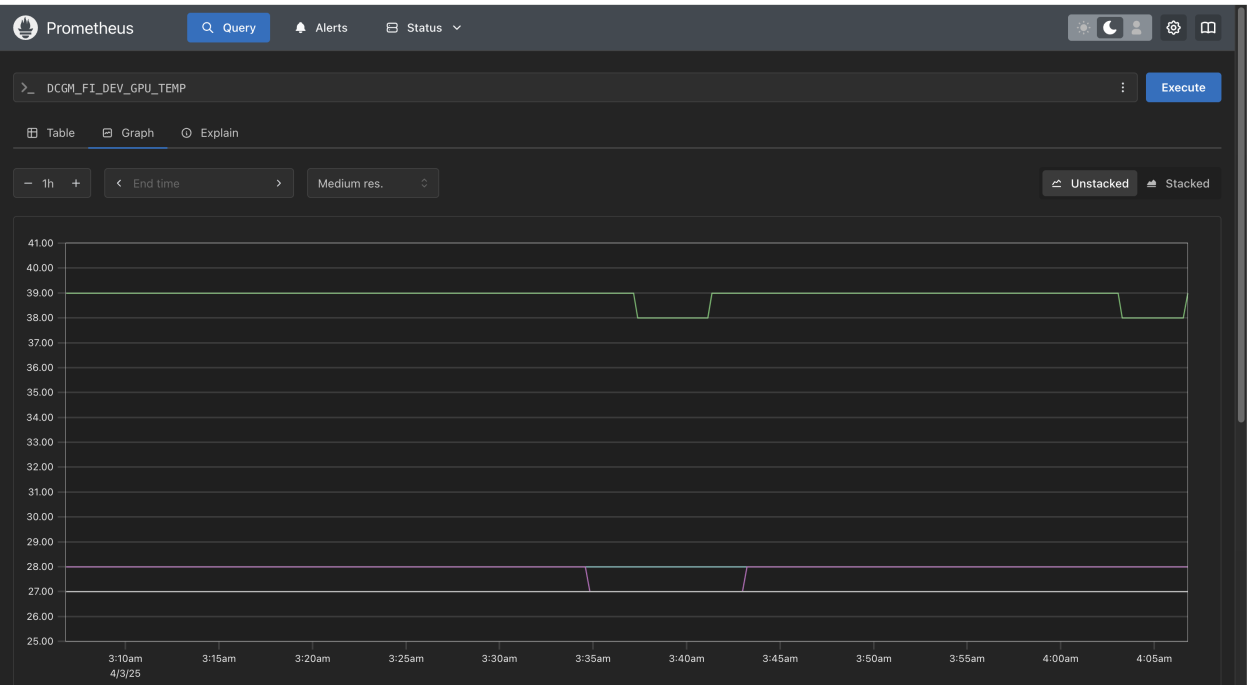
Figure 9 Prometheus UI showing a DCGM_FI_DEV_GPU_TEMP query result confirming GPU metric scraping#
NIM Metrics – Kube Prometheus#
The NIM Operator (latest version 3.0.2 as of February 2026) simplifies the deployment and lifecycle management of NVIDIA NIM microservices at the Kubernetes cluster level. It enables streamlined execution of AI inference pipelines, including Retrieval Augmented Generation (RAG) and Multi-LLM workflows, with built in support for model caching to reduce latency.
The section outlines the steps to configure the NIM Operator for Observability, ensuring the NIM metrics can be collected and visualized through Kube Prometheus and Grafana.
Before proceeding further, ensure that you have configured your Kubernetes secret with your NVIDIA GPU Cloud (NGC) API key to authenticate to gain access to the NVIDIA NGC catalog, enabling you to download model, containers and other resources.
Note
For detailed step-by-step guide to setup NGC API Key, refer to https://docs.nvidia.com/nim/large-language-models/latest/getting-started.html#export-the-api-key
Once setup, proceed to configure the NIM cache and NIM service custom resources in Kubernetes. NIM cache is a Kubernetes custom resource that pre-downloads and stores AI model profiles on persistent storage, enabling faster startup for NIM microservices. The moment you create a NIM cache resource, the NIM Operator starts a pod that lists the available model profiles. If you specify one or more model profile IDs to cache, the Operator starts a job that caches the model profiles that you specified. A NIM service is used to launch and serve the cached models. It can be configured to export metrics by setting the spec.metrics.enabled flag to true.
Example 14. Manifest for NIM Service
apiVersion: apps.nvidia.com/v1alpha1
kind: NIMService
metadata:
  name: meta-llama3-1-8b-instruct
spec:
  image:
    repository: nvcr.io/nim/meta/llama-3.1-8b-instruct
    tag: "1.3"
    pullPolicy: Always
    pullSecrets:
      - ngc-secret
  authSecret: ngc-api-secret
  storage:
    nimCache:
      name: meta-llama3-8b-instruct
      profile: ''
  replicas: 1
  resources:
    limits:
      nvidia.com/gpu: 1
  expose:
    service:
      type: ClusterIP
      port: 8000
  metrics:
    enabled: true
Apply the manifest:
Example 15. Kubernetes command to create the NIM Service
$ kubectl apply -n nim-service -f service.yaml
Verify that the Service Monitor has been configured correctly by running the following command:
Example 16. Kubernetes command to verify the Service Monitor
kubectl get servicemonitor -n nim-service meta-llama3-1-8b-instruct -o yaml
This should return the YAML below. Check the following:
The port matches the LLM service’s exposed metrics port
Endpoint path is set to /v1/metrics
Labels match the NIM service labels to facilitate Prometheus association
Example 17. Manifest for the ServiceMonitor that facilitates the scraping
apiVersion: monitoring.coreos.com/v1
kind: ServiceMonitor
metadata:
  annotations:
    nvidia.com/last-applied-hash:
84238486e4b5589a0018bfbea19590c1ecf46999816953bf2b47d5de9b7aea9b
    openshift.io/scc: nonroot
  creationTimestamp: "2025-02-27T05:38:22Z"
  generation: 1
  labels:
    app.kubernetes.io/instance: meta-llama3-1-8b-instruct
    app.kubernetes.io/managed-by: k8s-nim-operator
    app.kubernetes.io/name: meta-llama3-1-8b-instruct
    app.kubernetes.io/operator-version: ""
    app.kubernetes.io/part-of: nim-service
  name: meta-llama3-1-8b-instruct
  namespace: nim-service
  ownerReferences:
  - apiVersion: apps.nvidia.com/v1alpha1
    blockOwnerDeletion: true
    controller: true
    kind: NIMService
    name: meta-llama3-1-8b-instruct
    uid: b97ea2a5-1021-4851-b244-4f5552bd9493
  resourceVersion: "68785693"
  uid: fbc999e4-0600-493b-9714-088660d10f32
spec:
  endpoints:
  - path: /v1/metrics
    port: service-port
  namespaceSelector:
    matchNames:
    - nim-service
  selector:
    matchLabels:
      app.kubernetes.io/instance: meta-llama3-1-8b-instruct
      app.kubernetes.io/managed-by: k8s-nim-operator
      app.kubernetes.io/name: meta-llama3-1-8b-instruct
      app.kubernetes.io/operator-version: ""
      app.kubernetes.io/part-of: nim-service
Once configured, Kube Prometheus will automatically scrape NIM metrics and expose them for visualization. Below is a Prometheus graph showing the LLM GPU KV Cache usage for a NIM.
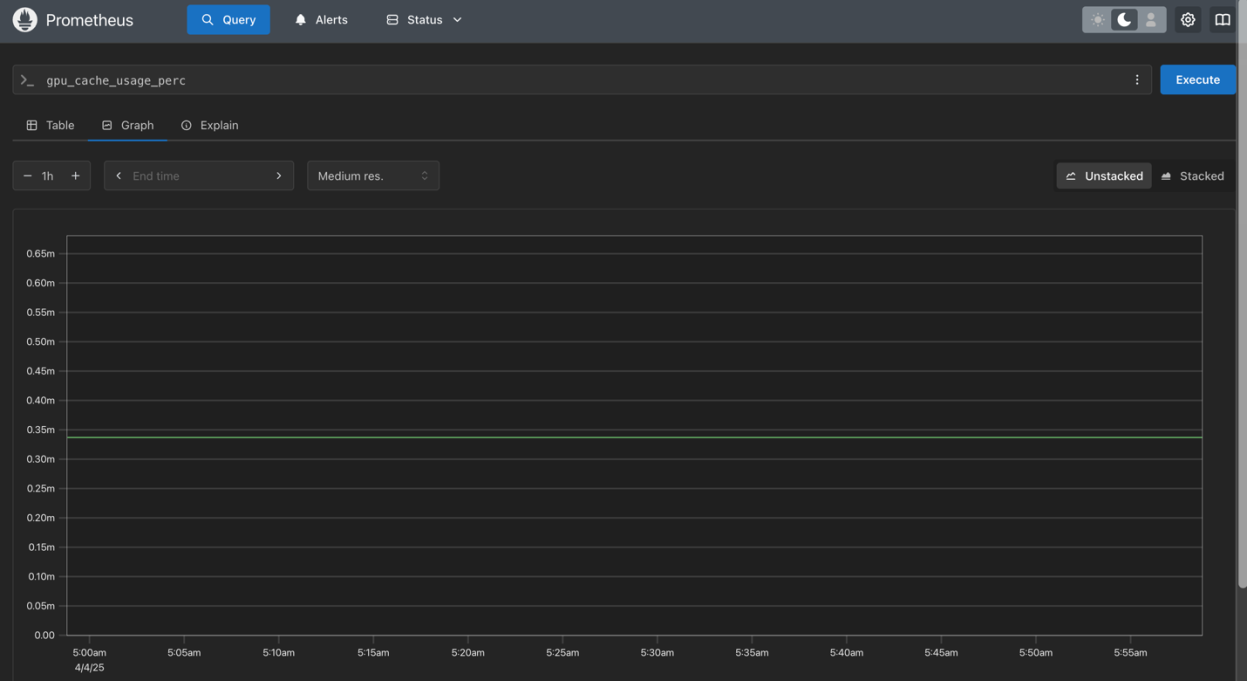
Figure 10 Prometheus graph showing the LLM GPU KV Cache usage for a NIM#
Once the data from NIMs and DCGM is present in Kube Prometheus, you should be able to select the Prometheus data source in Grafana, and see the metrics flow through. The link between the Kube Prometheus data source and Grafana should have been established automatically at installation time.
Similar to the steps followed above, click on the Kube Prometheus data source, scroll to the bottom and click on Test Connection to verify that the Prometheus API can be queried. A green box should show up saying that the test query was successful.
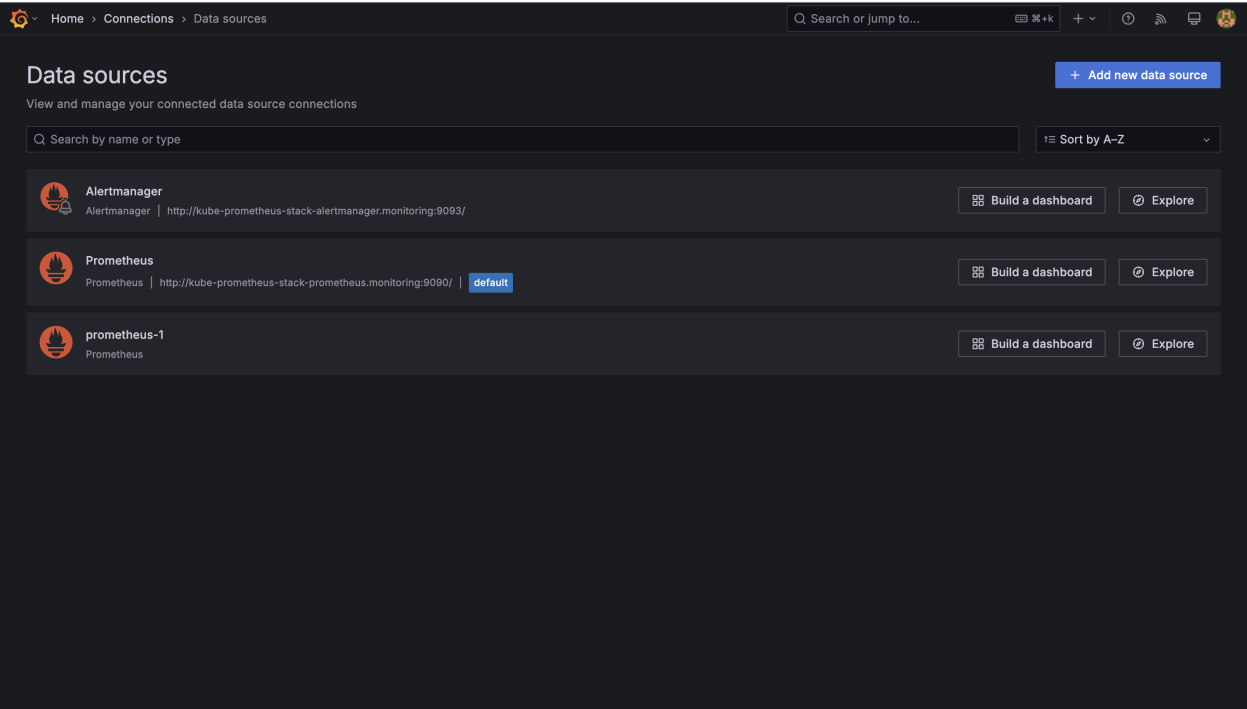
Figure 11 Grafana showing a successful connection test for the Kube Prometheus data source#
NetQ Prometheus#
Spectrum Switches export OTLP metrics into a time‑series database (TSDB) that runs inside the NetQ server. From Grafana’s perspective, this TSDB behaves like a Prometheus‑compatible endpoint that accepts PromQL‑style queries (for example, nvrouting_, nvswitch_). Similar to how we did for BCM’s Prometheus above, we need to add another data source for NetQ Prometheus which can be done through Connections -> Data sources. You may want to give the data source a different name such as netq-tsdb or netq-prom to differentiate it from kube-prometheus or bcm-prom.
The Prometheus server URL will be https://10.XXX.XXX.XXX/api/netq/vm/ (NetQ server from above) where the /api/netq/vm/ path exposes the NetQ TSDB in a Prometheus-compatible way. To authenticate, configure access using an API token obtained via the NetQ CLI. To obtain the token SSH into the server that is hosting NetQ and run the netq show vm-token expiry 180 command. On the same page, navigate to the Authentication section. In the HTTP headers section, select Add Header. In the Header field, enter Authorization and keep the default HTTP method as GET, which is what the NetQ TSDB expects. In the Value field, enter the token that you generated earlier. Ensure ‘Skip TLS certificate validation’ is checked under TLS Settings. Click Save & test at the bottom of the page. If the connection is successful, Grafana will report that the data source is working. After this step, the netq-tsdb data source becomes available in Grafana’s query editor. You can then query network metrics using PromQL‑style expressions, for example node_os_info to list switches and OS details.
Note
The NetQ UI and Grafana dashboards draw their data from different sources. The NetQ UI is populated from information received via the NetQ agents, while the Grafana dashboards are populated from OTLP telemetry streamed from the switches. As a result, the NetQ UI can show a device as healthy even if Grafana is missing metrics for that device because the OTLP export or TSDB path is misconfigured.