Rack View
The Rack View provides a simulated visual representation of a selected rack, including its devices, ports, and statuses. This view is populated using data from a PTP Excel file.

The page is initially blank, and user has 2 options:
This hierarchical selection process allows users to navigate from a Data Hall to SU and then to specific Racks. This feature is only available if the user has provided the DC Floor Layout file while loading the P2P file. Below are the steps the user should follow:
Select a Data Hall: Begin by selecting a Data Hall from the dropdown menu. This step determines the scope of available SUs and Racks that the user can access.

2. Display and Select SU: Once a Data Hall is selected, all the associated SUs within that hall will appear in two forms:
Dropdown Menu: A list of available SUs for easy selection.
Squares representing each SU displayed on the page.

The user can either choose an SU from the dropdown menu or click on one of the SU squares in the visual layout.
3. Display and Select RacksUpon selecting an SU, all racks within it will be displayed in two ways:
Dropdown Menu: A list of all racks within the selected SU.
all racks displayed side by side on the page.Each rack will include its name, the name all nodes inside it and how many unit each node reserve

The user can either choose an rack from the dropdown menu or click on one of the Rack name to see the simulated visual representation for the selected rack.
If the DC Floor layout is not loaded, user can directly select a rack from the rack menu to see the simulated visual representation for it.
The rack menu will contain all racks recognized by the CVT tool.

Once a rack is selected, the corresponding visualization of the rack, along with its devices and ports, will be displayed.

The tool support visualization for the following switches and hosts:
Supported Ethernet Switches and Hosts
Switch SN5600

SMC SuperServer

Dell PowerEdge XE9680 Rack Server

Default Server

Supported InfiniBand Switches and Hosts
Switch MQM8700

Switch MQM9700

Default Server

Default Switch

Supported XDR Switches
BlackMamba XDR switch

Each port on the device is color-coded to visually represent its status, making it easier to identify and troubleshoot issues. The status of each port is indicated by the following colors:
Ports are color-coded based on their related issues:

White: Null (no connection or data).

Green: Active and functioning properly.

Light Red: Indicates issues such as:
Unknown Neighbor.
Underperforming Link (BER).
Extra Cable.

Dark Red: Issues not covered by the above categories.
Split Port Status
Split ports occur when a single physical port is divided into multiple logical ports. For example, in the BlackMamba switch, a single physical port may be divided into two logical ports, named sw<num>p1 and sw<num>p2.
The color-coding system for split ports follows these guidelines:
Uniform Status Across Logical Ports: If all logical ports of a split port share the same status, the coloring will match that of a non-split port.
Mixed Issues with Different Severities: If the logical ports have issues of varying severity, the background color will reflect highest severity.
Mixed Active and Issue States: If one or more logical ports have issues while others are active, the background color will be orange

, indicating a mixed state.
Port Hover Details
When hovering over a port, a tooltip appears displaying:
Port-specific information.
Details of the associated issue.

Symbol | Name | Description | Color |

| Power Supply Unit LED | Shows the health of the power supply units. | Amber if fail, Green if everything ok |

| Fan Status LED | Shows the health of the fans | Amber if fail, Green if everything ok |
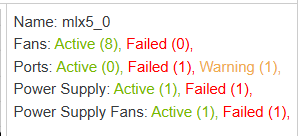
Beside each device in the rack, a summary panel provides an overview of its status, including:
Fans: Count of active and failed fans.
Ports: Count of active, warning, and failed ports.
Power Supplies: Count of operational and failed power supply units.
Power Supply Fans: Count of operational and failed power supply fans.
At the top of the view, an aggregated summary for the entire rack is displayed.
