Prometheus Endpoint
The NMX-M will have the capability to expose a Prometheus metrics endpoint for telemetry scraping purposes. Meaning, the NMX-M will present the telemetry data in a format compatible with the Prometheus protocol, allowing for efficient data collection and monitoring. The telemetry data exposed via the Prometheus metrics endpoint will include various telemetry data collected from NMX-T.
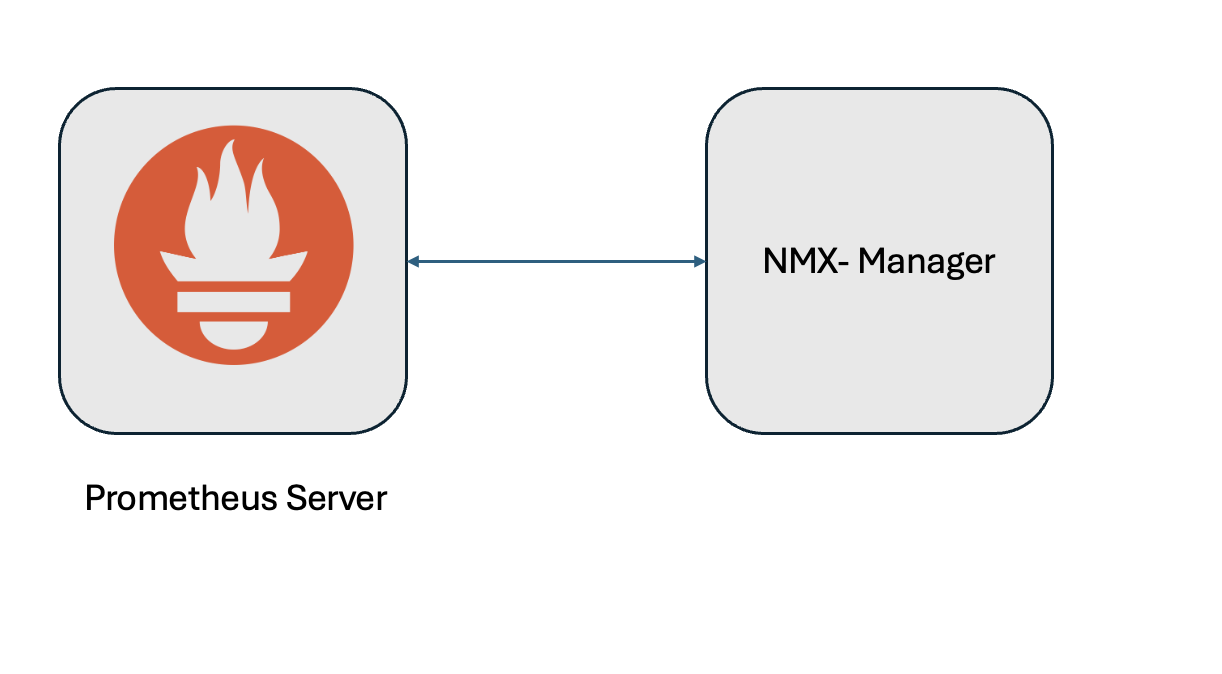
The following diagram illustrates how Prometheus metrics can be scraped from the NMX-M.
To enable Prometheus to scrape metrics from the NMX-M, it must be configured as a target endpoint in the Prometheus server configuration. This setup is similar to configuring any other Prometheus endpoint.
To configure the NMX-M as a Prometheus endpoint, you need to add the NMX-M's endpoint details to the Prometheus.yml configuration file.
The below is an example configuration snippet:
            global:
  scrape_interval: 15s
  evaluation_interval: 15s
scrape_configs:
  - job_name: "prometheus"
    scheme: https
    basic_auth:
      username: 'rw-user'
      password: 'rw-password'
    static_configs:
      - targets: ['10.xxx.xx.xx']
    metrics_path: '/nmx/v1/metric'
    tls_config:
      insecure_skip_verify: true
    params:
      id: ['e83134ff-89fb-45eb-97ae-920b35f8fde5']
where:
job_name | Specifies the name of the scraping job. |
id | NVlink5 domain id. |