Tests
This page is only supported for Admin users.
The Golden BER Test is designed to monitor Bit Error Rates (BER) and analyze the interface counters. The process begins by resetting interface counters on connected agents using the command sudo mlxlink –pc. The test then runs for a user-specified duration, during which the agents periodically report updated counter values every 10 minutes to a centralized collector. When the test completes, the final Amber file is sent to the collector.
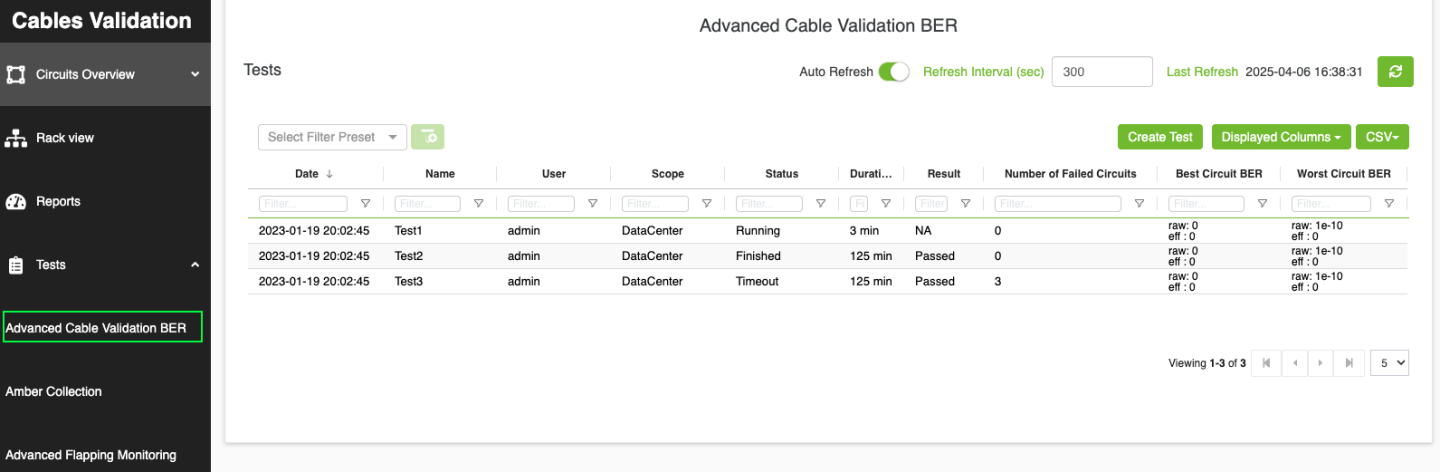
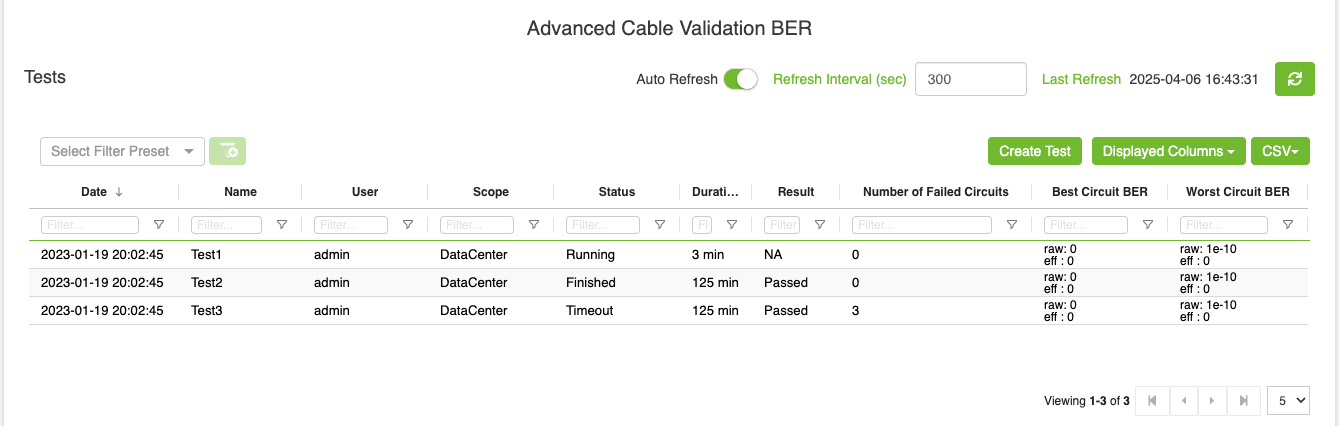
In the UI, the test is presented in a tabular format with the following columns:
Date: The creation date of the test.
Name: The name assigned to the test.
User: The creator of the test.
Scope: Test scope, which usually includes SU<n>/DH<n>, the DataCenter, or comma-separated racks or nodes.
Duration: The total runtime of the test.
Result: Displays the test's outcome, which can be:
NA: Initial state, test not yet completed.
Failed: If any circuit's BER status is not "Good." BER status is determined by comparing factors such as SerDes Technology (16nm/7nm/5nm), Link Speed Active, Active FEC, Raw BER, and Effective BER against specific thresholds(the same logic used in the Underperforming link ). Depending on these values, the status is categorized as Good, Poor, or Marginal.
Passed: All circuits have a "Good" BER status.
Status: test status, and it could be one of the following values:
Running: test is running.
Timeout: The test running time exceeded the test duration
Finished: The test is successfully finished, and the collector has received the collected Amber files.
Pending: The test is in its initial state.
Stopped: An error occurred while the test is running.
Number of Failed Circuits: The count of circuits with a "Failed" BER status.
Best Circuit BER: The lowest value of Raw BER or Effective BER during the test.
Worst Circuit BER: The highest value of Raw BER or Effective BER during the test.
Create New Test
To initiate a new test, the user clicks the Create Test button, which opens a modal dialog.
The tool can create up to five tests. If the maximum limit is reached and a new test is initiated, the system will automatically remove the oldest test to maintain a maximum of five tests in memory.
Multiple tests should be able to run simultaneously if they are on different nodes. For example, if the Golden BER Test is already running on [node1, node2], and an Advanced Flapping Test is requested for [node1, node4], the flapping test will fail because node1 is already occupied by the Golden BER Test.
The collected amber will be saved for only 6 hours, after which it will be deleted.
Please note that the user should load the DC layout file in order to use the Scalable Unit and Data Hall options
After creation, the test is added to the table. Clicking on the test allows users to view its detailed results.
Note: If the test duration expires while the test is still incomplete due to errors or lack of responses from any agent within the test scope, a 5-minute buffer time will be added. As a result, the total test duration will be the original test time plus 5 minutes.
Test Details
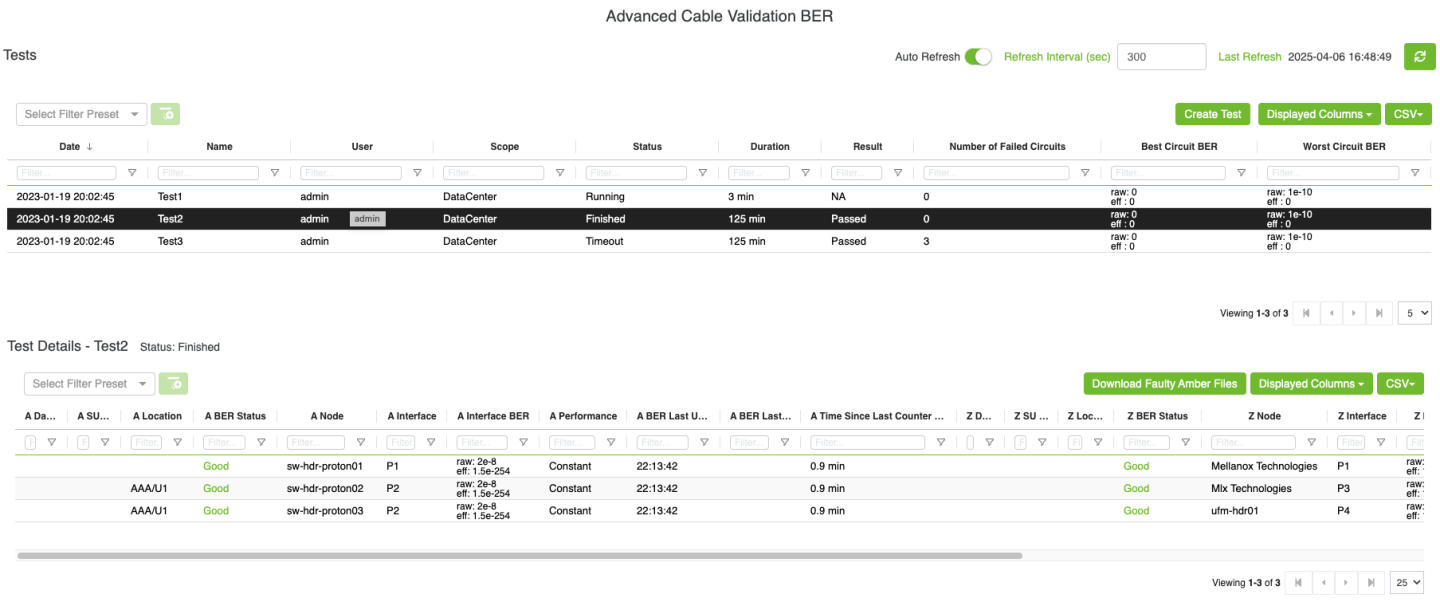
Detailed test results are displayed in a table, covering both A and Z endpoints. The columns include:
Protocol: circuit protocol (IB, Ethernet or NVLink).
Data Hall / SU Number: Data Hall and Scalable Unit
Location: Specifies the rack and unit location of the endpoint.
BER Status: Calculated based on the methodology mentioned earlier.
Node: The name of the node.
Interface: The port under analysis.
BER Counters: Displays Raw BER and Effective BER counters.
Performance: Indicates performance trends:
NA: No available Raw BER value or the first recorded value.
Improved: If the Raw BER value has decreased.
Degraded: If the Raw BER value has increased.
Constant: If the value remains unchanged.
BER Last Update: The timestamp of the last BER update.
BER Last Update Duration: Time since the most recent BER update.
Time Since Last Counter Clear: The elapsed time since the counters were last cleared.
Downloading Amber Files
After the test finished, user can download the Amber file for each circuit by clicking on the circuit then right-click
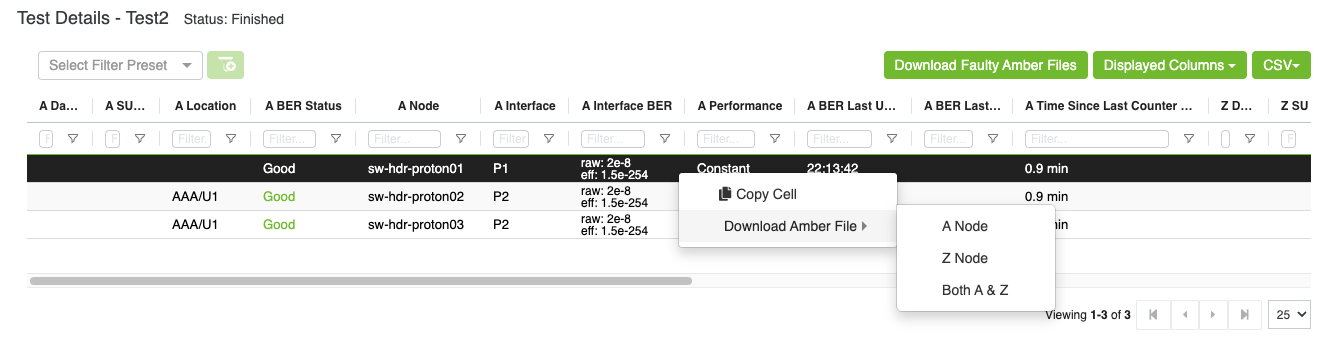
User can download the amber file for A, Z or both endpoints
Also, user can download faulty Amber files by click on Download Faulty Amber Files button
The Amber Collection test is designed to Collecting Amber Filenew upon request. The process starts by utilizing the mlxlink command to gather amber files from connected agents within the specified test scope. Once all agents complete the collection and send the amber files to the collector, these files are compressed into a single tar file and stored in the directory:/cable_bringup_root/data/tests/amber/<test_name> and the file name will be <test_name>.tar.gz. Afterward, the collector marks the test as Finished.
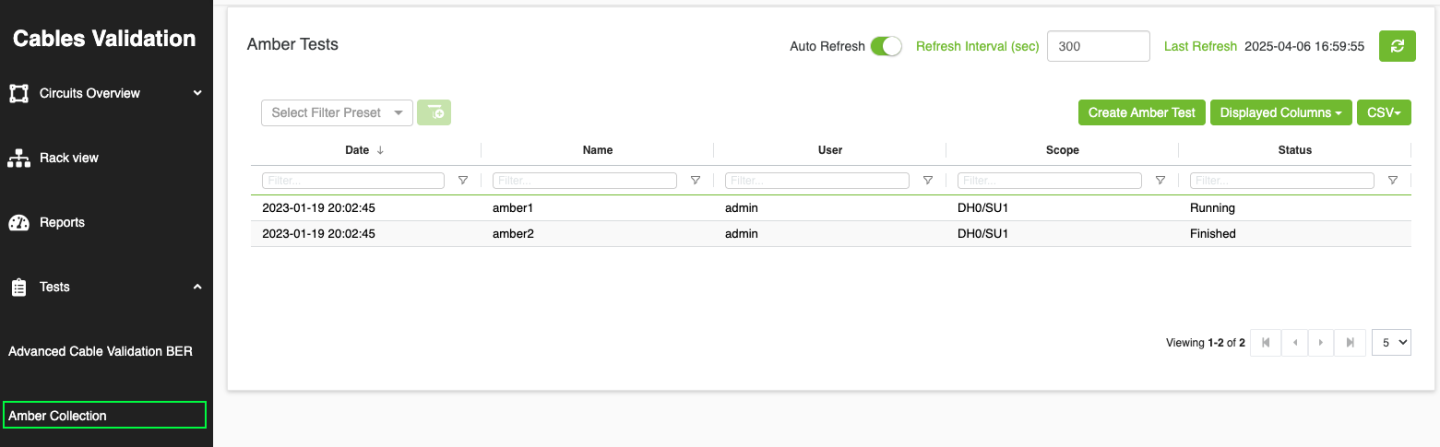
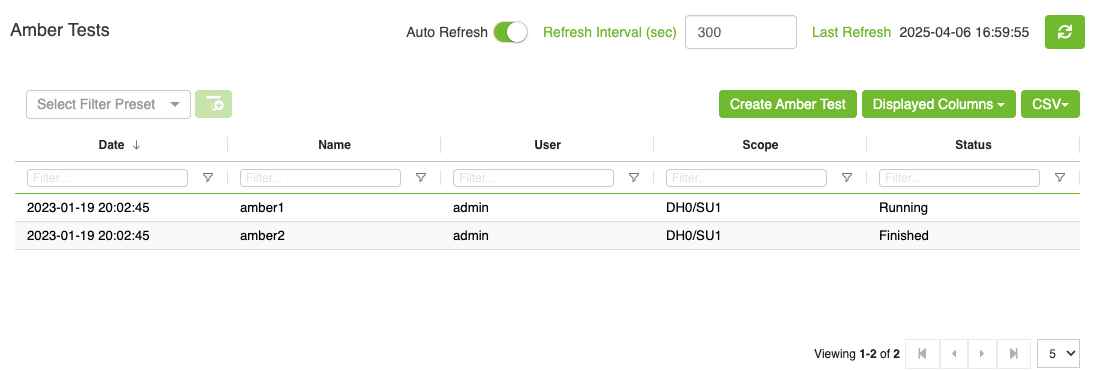
In the UI, the test is presented in a tabular format with the following columns:
Date: The creation date of the test.
Name: The name assigned to the test.
Scope: Test scope, which usually includes SU<n>/DH<n>, the DataCenter, or comma-separated racks or nodes.
Status: The current status of the test, which can be one of the following:
Running: The test is ongoing, and not all agents have returned their amber files.
Timeout: The test has exceeded the 5-minute time limit (test timeout = 5 min), and not all agents have returned their amber files.
Finished: All agents have successfully returned their amber files.
Pending: The test is in its initial state, awaiting execution.
Stopped: An error occurred while the test is running.
Create New Test
To initiate a new test, the user clicks the Create Test button, which opens a modal dialog.
The tool can create up to five tests. If the maximum limit is reached and a new test is initiated, the system will automatically remove the oldest test to maintain a maximum of five tests in memory.
Please note that the user should load the DC layout file in order to use the Scalable Unit and Data Hall options
After creation, the test is added to the table. Clicking on the test allows users to view its detailed results.
Test Details
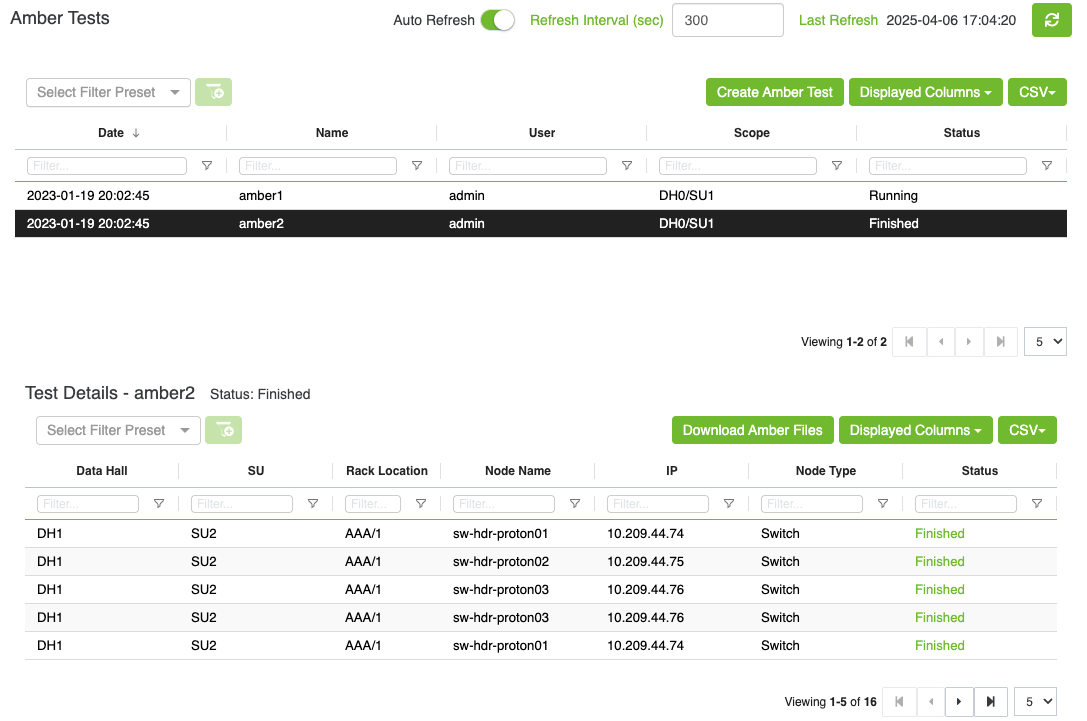
Detailed test results are displayed in a table, covering the node information where the test is running. The columns include:
Data Hall / SU Number: Data Hall and Scalable Unit
Location: Specifies the rack and unit location of the endpoint.
Node Name: The name of the node.
IP: The IP address.
Node Type: switch or host.
Status: Indicates the status of amber file collection for each agent:
Running: Amber file collection is in progress.
Timeout: The amber file collection has exceeded the 5-minute time limit without completion.
Finished: The amber file is successfully collected, and the collector has received it.
Pending: The test is in its initial state.
Stopped: An error occurred during the amber file collection process.
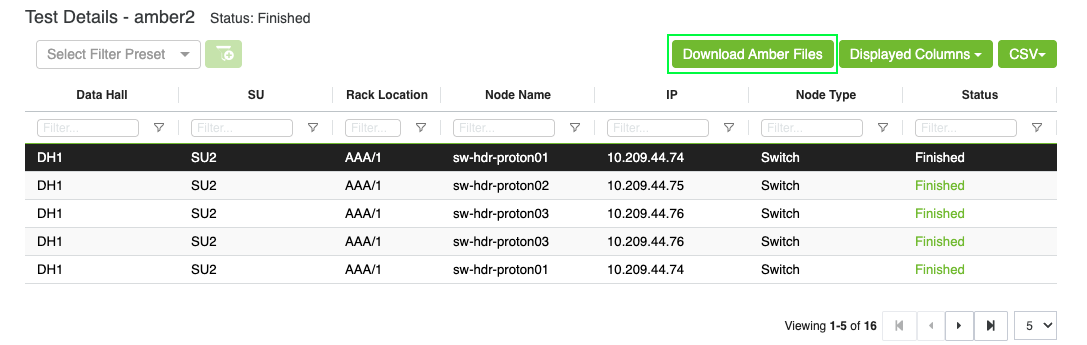
Downloading Amber Files
Once a test is marked as Finished, users can download the amber files by clicking the Download Amber Files button. This will download the compressed tar file containing all the collected amber files.
The Advanced Flapping Monitoring is designed to analyze the metrics that could lead to a flapping event. It tracks the circuit flapping events along with Bit Error Rates (BER), temperature, and Rx/Tx counters.
The process begins by resetting interface counters on connected agents using the command sudo mlxlink –pc, along with resetting the flap counter in CVT memory. Once initialized, the test runs for a user-defined duration, during which agents periodically report updated counter values to the collector every 10 minutes.
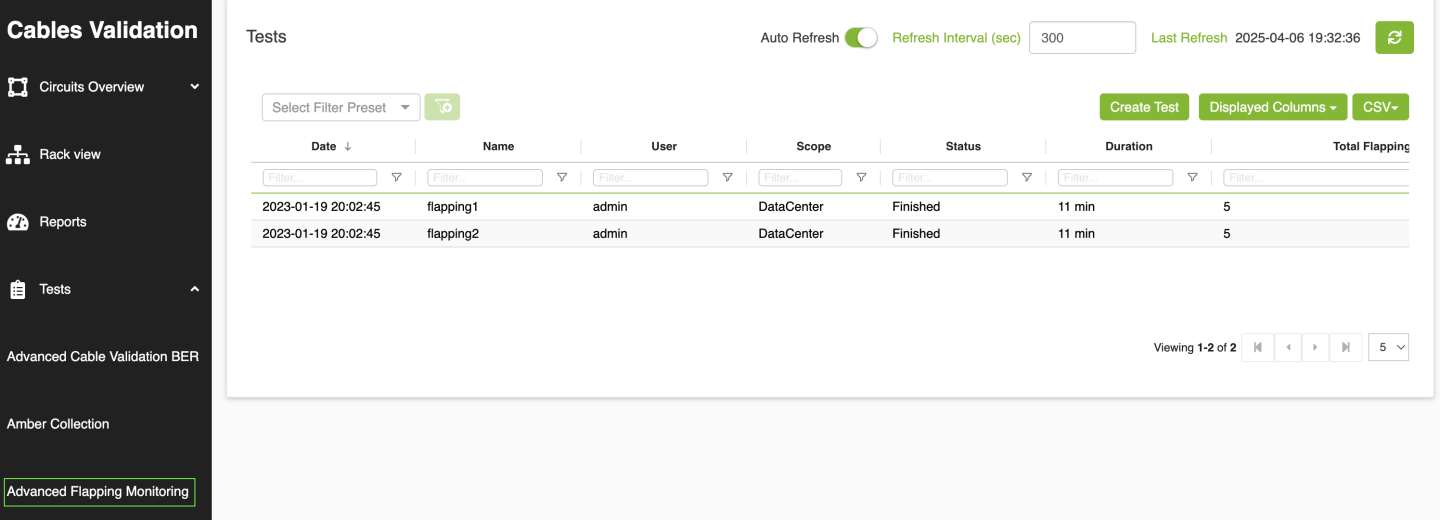
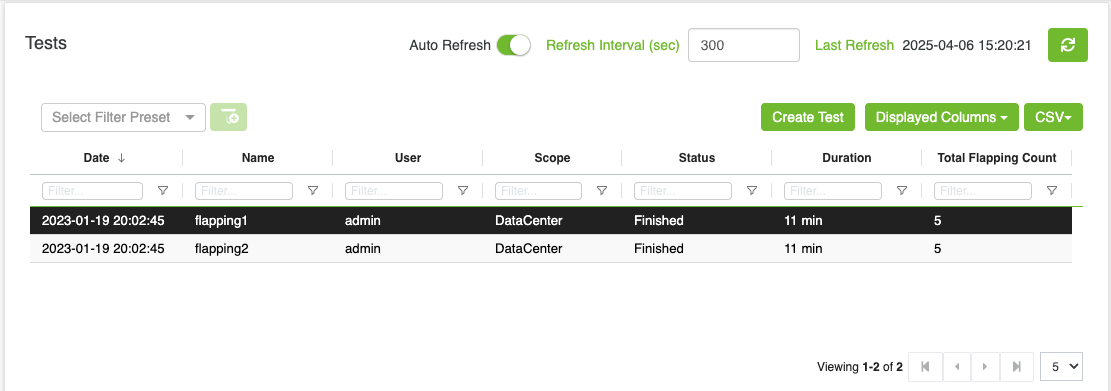
In the UI, the test is presented in a tabular format with the following columns:
Date: The creation date of the test.
Name: The name assigned to the test.
User: The creator of the test.
Scope: Test scope, which usually includes SU<n>/DH<n>, the DataCenter, or comma-separated racks or nodes.
Duration: The total runtime of the test.
Status: test status, and it could be one of the following values:
Running: test is running.
Timeout: The test running time exceeded the test duration
Finished: The test is successfully finished, and the collector has received the advanced stats.
Pending: The test is in its initial state.
Stopped: An error occurred while the test is running.
Total Flapping Count: The total flaps occurred across all switches for all ports from the time the test started.
Create New Test
To initiate a new test, the user clicks the Create Test button, which opens a modal dialog.
The tool can create up to five tests. If the maximum limit is reached and a new test is initiated, the system will automatically remove the oldest test to maintain a maximum of five tests in memory.
Multiple tests should be able to run simultaneously if they are on different nodes. For example, if the Golden BER Test is already running on [node1, node2], and an Advanced Flapping Test is requested for [node1, node4], the flapping test will fail because node1 is already occupied by the Golden BER Test.
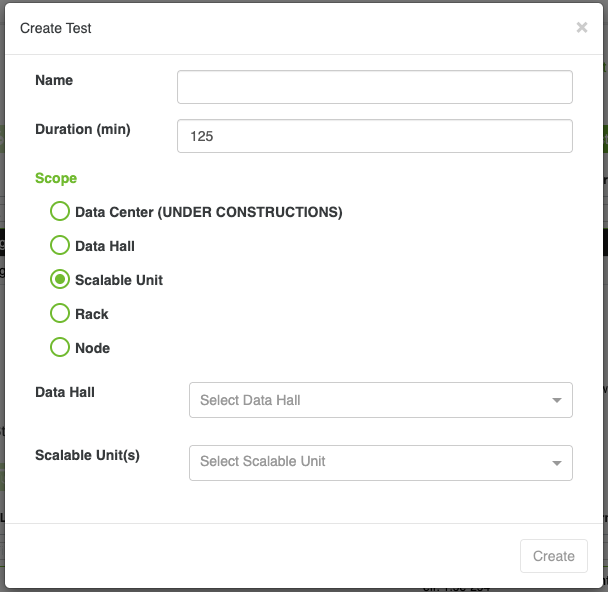
Please note that the user should load the DC layout file in order to use the Scalable Unit and Data Hall options
After creation, the test is added to the table. Clicking on the test allows users to view its detailed results.
Note: If the test duration expires while the test is still incomplete due to errors or lack of responses from any agent within the test scope, a 5-minute buffer time will be added. As a result, the total test duration will be the original test time plus 5 minutes.
Test Details
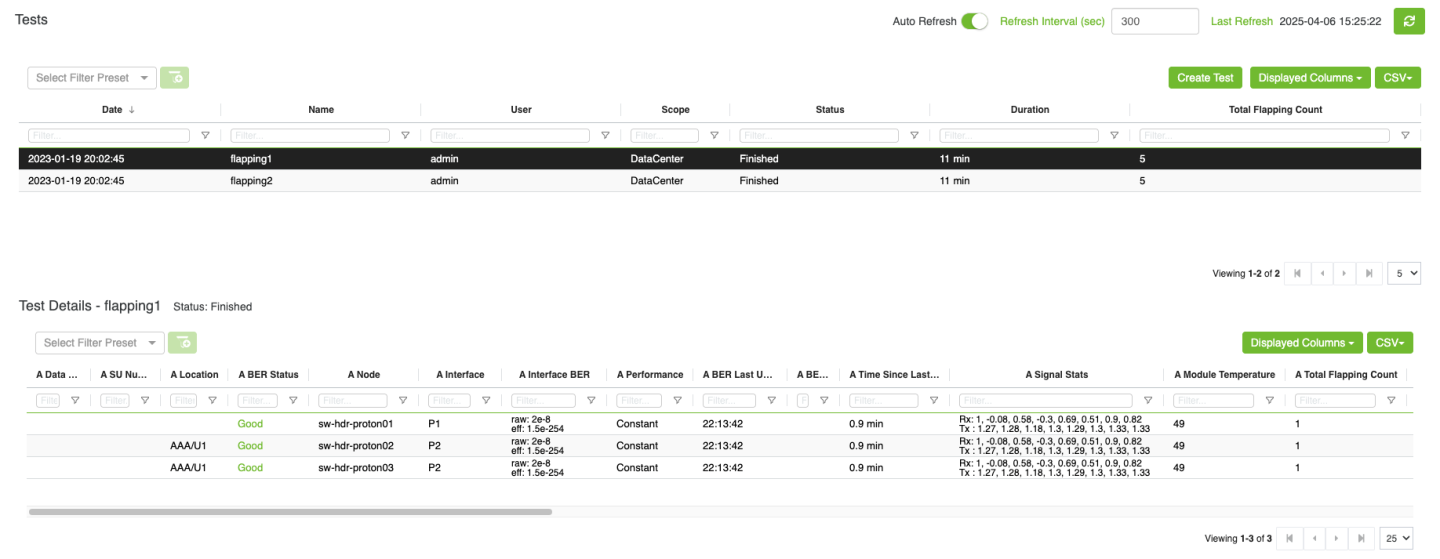
Detailed test results are displayed in a table, covering both A and Z endpoints. The columns include:
Protocol: circuit protocol (IB, Ethernet or NVLink).
Data Hall / SU Number: Data Hall and Scalable Unit
Location: Specifies the rack and unit location of the endpoint.
BER Status: BER status is determined by comparing factors such as SerDes Technology (16nm/7nm/5nm), Link Speed Active, Active FEC, Raw BER, and Effective BER against specific thresholds(the same logic used in the Underperforming link ). Depending on these values, the status is categorized as Good, Poor, or Marginal.
Node: The name of the node.
Interface: The port under analysis.
BER Counters: Displays Raw BER and Effective BER counters.
Performance: Indicates performance trends:
NA: No available Raw BER value or the first recorded value.
Improved: If the Raw BER value has decreased.
Degraded: If the Raw BER value has increased.
Constant: If the value remains unchanged.
BER Last Update: The timestamp of the last BER update.
BER Last Update Duration: Time since the most recent BER update.
Time Since Last Counter Clear: The elapsed time since the counters were last cleared.
Signal Stats: Shows transmission and reception power levels (Rx/Tx Power Lane)
Module Temperature: module temperature value.
Total Flapping Count: This is the total number of transitions occurring during the test.
Flapping Status: flapping status and it could be one of the following values:
Ok - no flapping events during the test.
Flapping - agent detected a flapping event in the last 1 minute
Flapped - agent detected a flapping event at some point while the test is running (The Flapping event counter >= 1)
Flap 30 sec: how many flaps happened in the last 30 seconds (hidden by default).
Flap 1 min: how many flaps happened in the last 1 minute (hidden by default).
Flap 5 min: how many flaps happened in the last 5 minutes (hidden by default).
Flap 1 hour: how many flaps happened in the last 1 hour (hidden by default).
Flap 12 hour: how many flaps happened in the last 12 hours (hidden by default).
Flap 24 hour: how many flaps happened in the last 24 hours (hidden by default).