Devices View
The Devices View presents network devices in a structured table format, allowing users to browse, filter, and select devices for detailed analysis.
Upon device selection, the interface provides detailed information through multiple tabs, including circuits, agent status, and device health metrics.
The system automatically refreshes device information and provides real-time status updates. Users can export device data, filter results, and navigate through different device details.
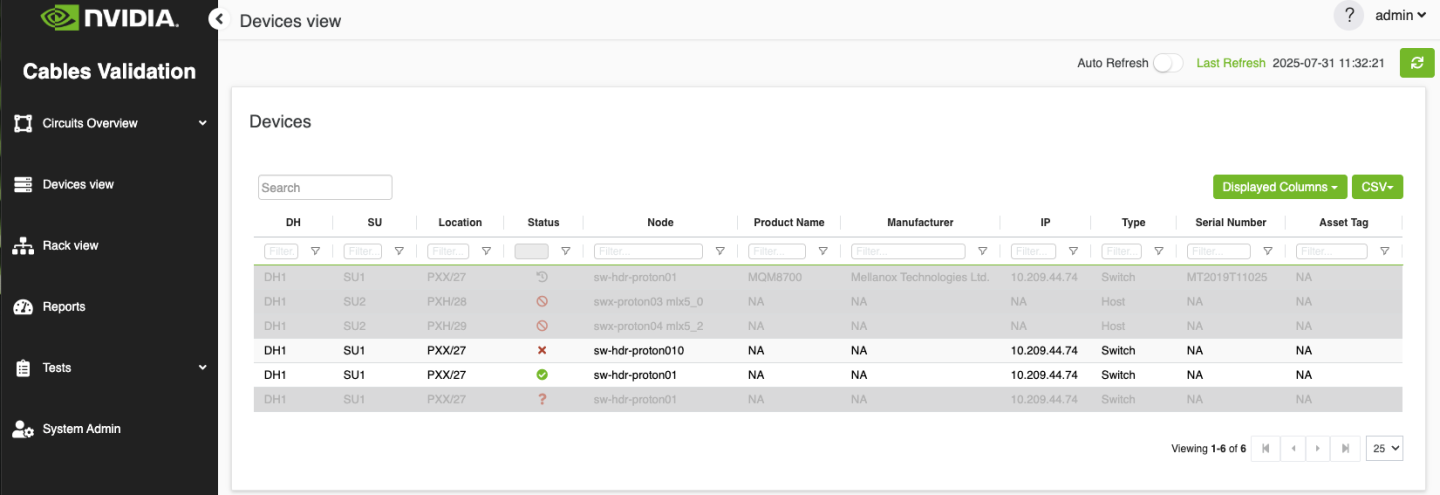
The main interface displays devices in a tabular format with the following columns:
Column | Description |
DH (Data Hall) | The data hall identifier where the device is located |
SU (Scalable Unit) | The scalable unit within the data hall |
Location | Physical location showing rack name and rack unit in format "Rack/Unit" |
Status | Agent status, for more information refer to Agent Status |
Node | The device node name with visual indicators for the device status |
Product Name | The product's name |
Manufacturer | The manufacturer name |
IP | The device IP address |
Type | The device type |
Serial Number | Serial Number |
Asset Tag | Asset Tag |
Agent status could be one of the following:
Unmanaged (🚫 Gray background): Agent installation is not supported on this device.
Agent Not Installed (❓ Gray background): No agent is installed.
Stale Agent (🕒 Gray background): No update has been received from the agent in the last 15 minutes.
Agent Reporting Failures (❌): The agent has reported either hardware issues (e.g., fans, power supplies) or port issues.
No Failures on Agent (✅): No hardware or port issues detected by the agent.
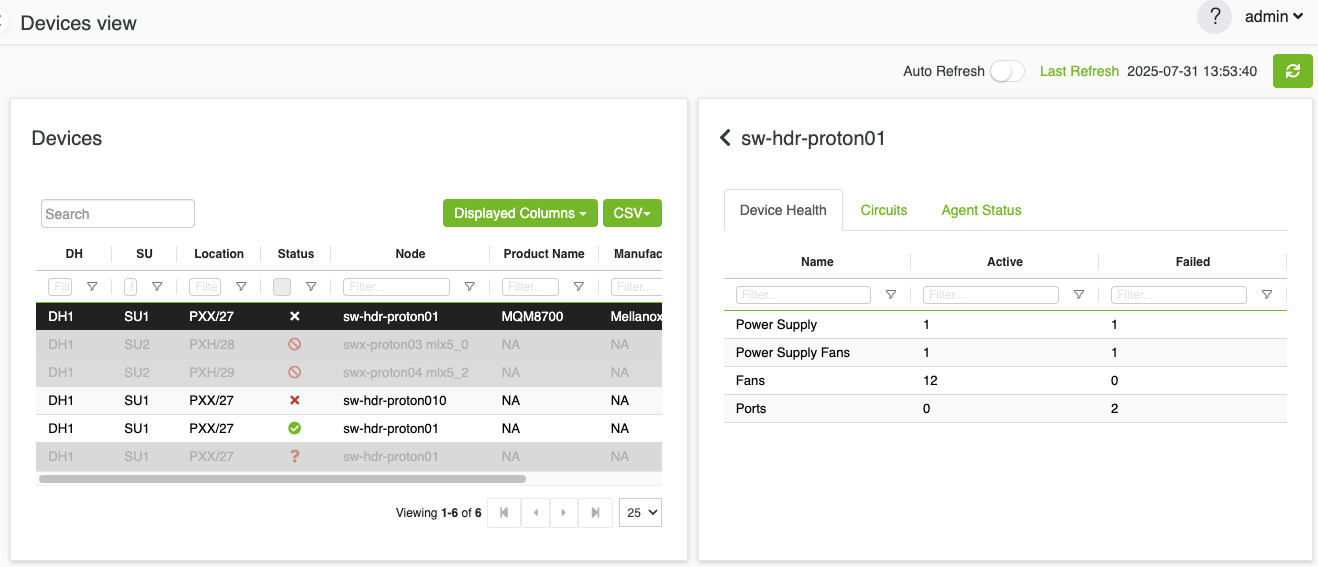
When a device is selected from the table, a details panel appears on the right side of the screen.
The selected device's information is highlighted in the device header, and the available tabs are dynamically determined based on the device's capabilities.
The device header displays the device name with expand/collapse functionality on the left side of the name.
In expanded mode, the device details panel stretches to fit the page and displays the device's location hierarchy — Data Hall > Scalable Unit > Rack > Unit (when available).
It also includes information about the device type.
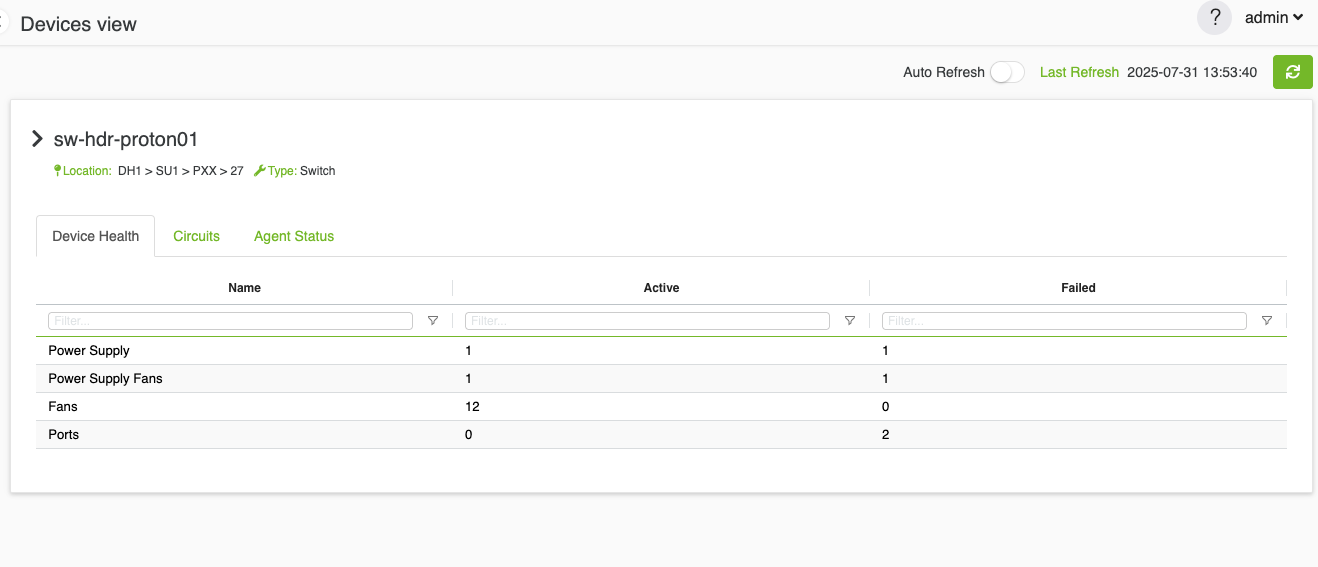
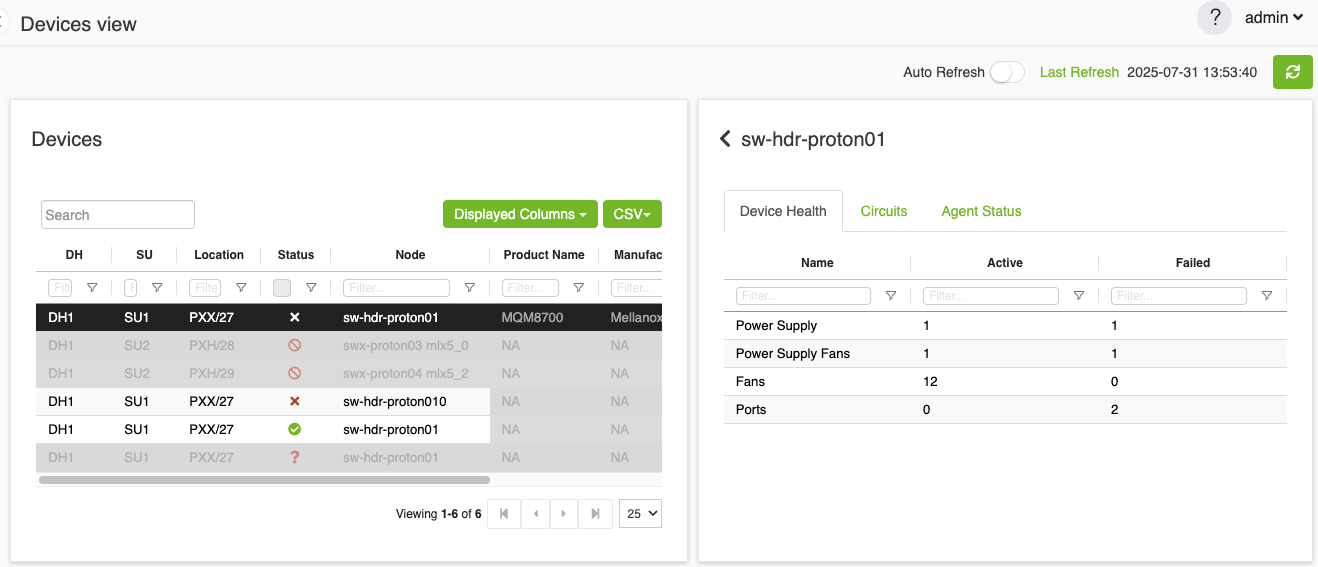
Device Health Tab
The Device Health tab provides an overview of the selected device’s health metrics in a tabular format.
Note: This tab is only visible for manageable devices.
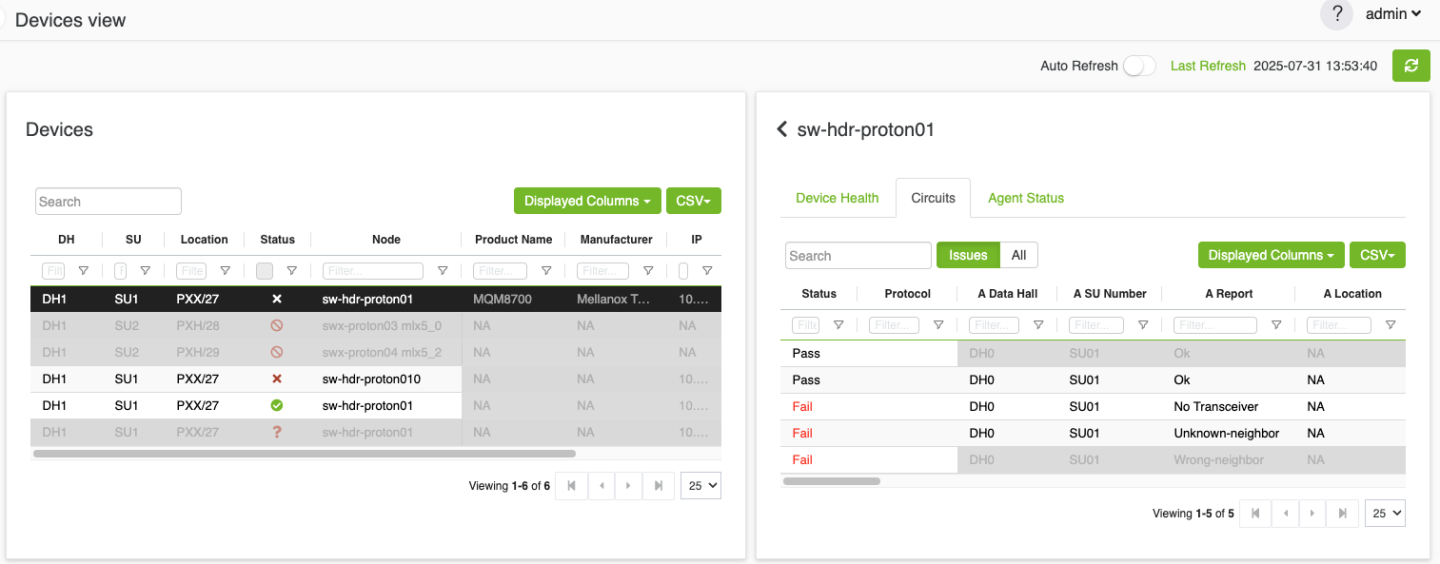
Circuits Tab
The Circuits tab displays all circuits related to the selected device.
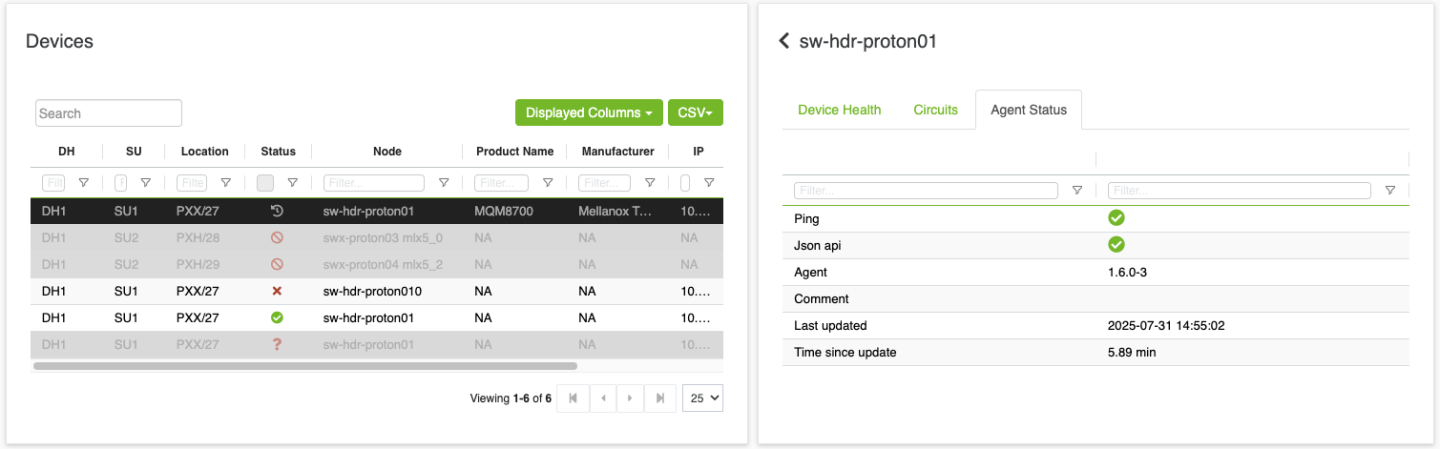
Agent Status Tab
The Agent Status tab presents detailed information about the software agent running on managed devices. It includes the agent's connectivity status, version information, and the timestamp of the last communication.
Note: This tab is only visible for manageable devices and is accessible only to users with administrative privileges.