Collected Data
NMX-Telemetry is capable of collecting the following types of data:
NVLink5 metrics
Switch tray gNMI messages
Syslog messages
NVL5 network and components are: ports, adapters, cables, switches. Collected data is accessible through both the Prometheus and gRPC metrics interfaces, and can also be streamed using the OTLP and Prometheus remote write protocols. Export Options v0.9.0-PS-Obsolete.
For a list of NMX-T telemetry metrics, refer to NVOnline ID 1092300.
NVL5 Metrics Schema
At runtime the list of data being collected can be retrieved with the following API query:
curl http://0.0.0.0:9352/management/schema?schema_id=all | jq
NMX Telemetry can collect metrics data from multiple endpoints via the gRPC Network Management Interface (gNMI). While it is commonly used to aggregate metrics from gNMI-enabled IB/NVL switches, its flexible interface allows it to receive data from any endpoint that supports the gNMI protocol.
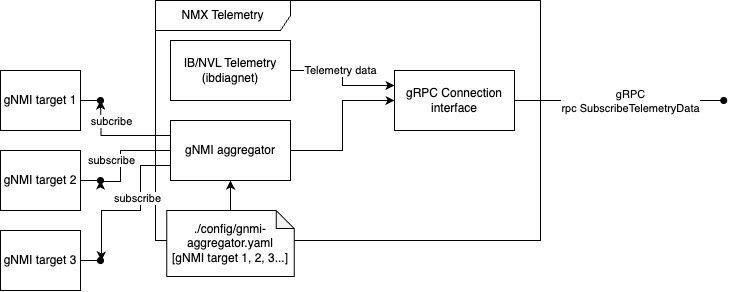
gNMI target configuration is managed via Telemetry Collection Configuration interface and the Aggregated gNMI data is streamed via the Telemetry gRPC interface gNMI Aggregation Data
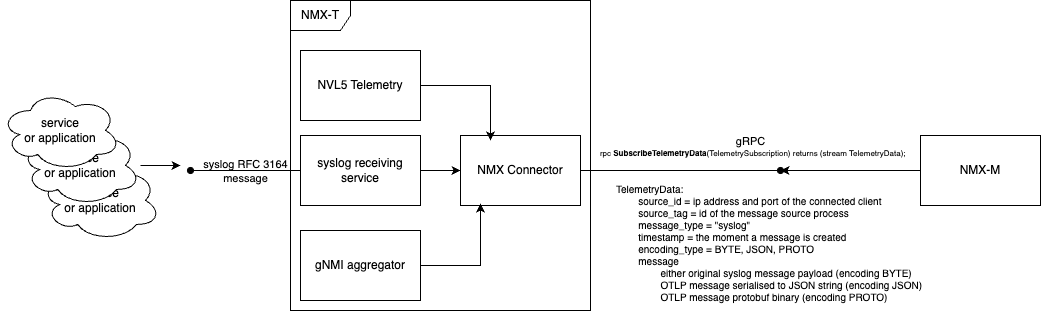
NMX-T operates a syslog service that receives messages from domain services and re-streams them over the network gNMI Aggregation Data.